Poverty in Rural America

Poverty in Rural America In this Research Note, HAC examines Poverty in Rural America . The issue of poverty has many complexities, but it is much more than an abstract condition for the over 40 million Americans who face daily struggles with food security, access to health care, and lack of basic shelter. Poverty rates are on the rise and more Americans are living in poverty than at any other time since the Census Bureau began measuring its occurrence. This research note includes analysis of: -Rural poverty; -The face of poverty in rural America; -Long-term poverty in rural America; and -Rural poverty and vulnerable populations. More rural poverty information can be found on HAC's "Poverty in the United States" map at www.ruralhome.org/poverty-map

Recommandé
Contenu connexe
Tendances
Tendances (20)
Similaire à Poverty in Rural America
Similaire à Poverty in Rural America (20)
Plus de Housing Assistance Council
Plus de Housing Assistance Council (20)
Dernier
Dernier (20)
Poverty in Rural America
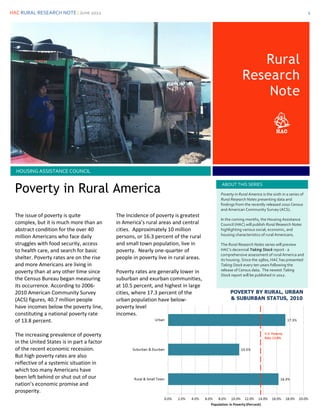
- 1. HAC RURAL RESEARCH NOTE | June 2012 1 Rural Research Note HOUSING ASSISTANCE COUNCIL Poverty in Rural America ABOUT THIS SERIES Poverty in Rural America is the sixth in a series of Rural Research Notes presenting data and findings from the recently released 2010 Census and American Community Survey (ACS). The issue of poverty is quite The Incidence of poverty is greatest In the coming months, the Housing Assistance complex, but it is much more than an in America’s rural areas and central Council (HAC) will publish Rural Research Notes abstract condition for the over 40 cities. Approximately 10 million highlighting various social, economic, and housing characteristics of rural Americans. million Americans who face daily persons, or 16.3 percent of the rural struggles with food security, access and small town population, live in The Rural Research Notes series will preview to health care, and search for basic poverty. Nearly one-quarter of HAC’s decennial Taking Stock report - a comprehensive assessment of rural America and shelter. Poverty rates are on the rise people in poverty live in rural areas. its housing. Since the 1980s, HAC has presented and more Americans are living in Taking Stock every ten years following the poverty than at any other time since Poverty rates are generally lower in release of Census data. The newest Taking Stock report will be published in 2012. the Census Bureau began measuring suburban and exurban communities, its occurrence. According to 2006- at 10.5 percent, and highest in large 2010 American Community Survey cities, where 17.3 percent of the (ACS) figures, 40.7 million people urban population have below- have incomes below the poverty line, poverty level constituting a national poverty rate incomes. of 13.8 percent. The increasing prevalence of poverty in the United States is in part a factor of the recent economic recession. But high poverty rates are also reflective of a systemic situation in which too many Americans have been left behind or shut out of our nation’s economic promise and prosperity.
- 2. HAC RURAL RESEARCH NOTE | June 2012 2 The Face of Poverty in Rural America Rural poverty rates generally follow the Consistent with regional patterns, rural small town areas. Large numbers of same trend as national rates, and have poverty rates were highest in poor, rural Native Americans are fluctuated up and down through periods southeastern states. Mississippi, concentrated on or near reservations, of economic growth, as well as through Louisiana, Kentucky, South Carolina, where the overall poverty rates can recessions similar to what the U.S. Georgia, Arkansas, and Alabama all have exceed half the population in these experienced in the late 2000s. While rural and small town poverty rates at 20 communities. The poverty rate among some gains have been made in reducing percent or more. Texas has the greatest rural Hispanics is more than twice the poverty over the past several decades, number of rural residents in poverty with national rate, and five percentage points poverty rates are still stubbornly high for nearly 730,000 rural residents below the higher than for Hispanics nationally, at certain populations in rural America – poverty line. North Carolina also has 27.3 percent. In fact, rural minorities consistently have higher poverty rates compared to minorities nationally. Additionally, economic conditions for many rural minorities have not improved over the past decade, as poverty rates for most groups have either remained the same or increased between 2000 and 2010. While minorities experience exceptionally high rates of poverty proportionate to their population size, it is important to remember that the vast majority of rural residents in poverty are white not Hispanics. More than 6 million individuals, or 63 percent of rural persons below the poverty line, are white not Hispanic. While some gains have namely minorities and children. more than one-half million rural residents who live in poverty. been made in reducing Regionally, rural and small town poverty rates are highest in the South where 19.3 Rural minorities continue to experience poverty over the past percent of southerners live in poverty. In some of the highest poverty rates in the several decades, poverty fact, more than half of all rural and small nation. The poverty rate of rural town persons in poverty reside in the minorities is more than twice that of rates are still stubbornly south. Rural and small town poverty rural white not Hispanics, at 28 percent. high for certain rates are lowest in the Northeast and Rural African Americans have among the Midwest at 12.9 and 13.6 percent highest poverty rates, at nearly 34 populations in rural respectively. Approximately 15.4 percent. Similarly, the poverty rate for percent of rural and small town residents rural Native Americans is also above 30 America in the West have incomes below the percent, and more than half of all Native poverty level. Americans in poverty live in rural and
- 3. HAC RURAL RESEARCH NOTE | June 2012 3 FAST FACTS 16.3% Overall poverty rate in rural and small town areas of the United States in 2010 28.7% Poverty rate for minorities in rural and small town areas in 2010 10 million Rural and small town people with incomes below the poverty line in 2010
- 4. HAC RURAL RESEARCH NOTE | June 2012 4 Persistently Poor: Long-Term Poverty in Rural America An increasing number of rural communities are racial and ethnic One highly visible impact of this communities are experiencing minorities, and the median economic distress can be seen in persistently high poverty rates. household income is $31,581, more these areas’ poor housing These areas are often isolated than 40 percent less than the conditions. The incidence of housing geographically, lack resources and national median. units lacking adequate pluming is economic opportunities, and suffer more than twice the national rate, from decades of disinvestment and and nearly 400,000 households in double- these regions live in crowded digit conditions. Additionally, while poverty housing costs are relatively low in rates. Often forgotten many of these communities, more or hidden from than half of persistent- mainstream America, poverty county renters these areas and encounter affordability populations have problems and are had high poverty considered housing cost rates for decades. burdened. Persistently poor The continued persistence of counties are poverty is most evident within classified as having several predominantly rural poverty rates of 20 regions and populations such as percent or more in Central Appalachia, the Lower 1990, 2000, and 2010. Using Mississippi Delta, the southern this metric, there Black Belt, the Colonias region were 429 along the U.S.-Mexico border, persistently Native American lands, and poor counties in migrant and seasonal 2010. These counties farmworkers. experiencing long-term poverty are almost exclusively rural, as 86 There are more than 5 One of the more distressing trends is percent of persistent poverty million people living below the that the number of persistent counties have entirely rural poverty line in these counties, with poverty counties is actually populations. an overall poverty rate of 25 percent increasing. Using the same -nearly twice the national rate. The benchmark, the number of Overall, there are more than of 21 poverty rate for minorities in these persistent-poverty counties million people living in persistent communities is even higher, at 32 increased by 8 percent from the year poverty counties. Nearly 60 percent percent. 2000 level. of the population in these Often forgotten or hidden from mainstream America, these areas and populations have had high poverty rates for decades.
- 5. HAC RURAL RESEARCH NOTE | June 2012 5 10 states with the highest rural & 10 states with the largest number small town poverty rate, 2010 of rural and small town residents in poverty, 2010 Mississippi—24.6% Texas – 728,128 Louisiana—21.3% North Carolina – 538,247 Kentucky—21.1% ABOUT THE DATA Georgia—468,900 South Carolina—20.9% Unless otherwise noted, all data presented in this Research Note are California—465,930 based on HAC tabulations of the 2006- New Mexico—20.9% 2010 American Community Survey or Kentucky—438,129 the Census Bureau’s 2010 Small Area Georgia—20.8% Income and Poverty Estimates (SAIPE). Mississippi—435,220 Arkansas—19.6% For more information on this Research Note contact the Housing Assistance Ohio—375,127 Council Alabama—19.5% Tennessee—356,661 lance@ruralhome.org North Carolina—19.1% 202-842-8600 Missouri—325,513 West Virginia—19.0% Alabama—306,684
- 6. HAC RURAL RESEARCH NOTE | June 2012 6 Rural poverty and vulnerable populations Poverty often has the most earning income and taking care of One of the greatest successes in detrimental impact on people who children—a task challenging even for ameliorating poverty has been are most vulnerable. Children, who two-adult households. Poverty rates among older Americans. Until recent cannot fully attend to their own are often extremely high in such decades, older persons in the United needs, suffer the most from low family situations. The U.S. poverty States experienced poverty rates at incomes and poverty. Research rate for single-parent families is 32.8 much higher levels than the overall suggests that children living multiple percent, compared to 6.7 percent for population. However, the years with unhealthy food, all other families with children. enactment of safety net programs substandard housing, and unsafe Approximately 4.1 million single- such as Social Security, living environments, are negatively parent families, 1.2 million of which Supplementary Security Income impacted in the long term and have live in rural areas, failed to reach the (SSI), and Medicare have helped reduced economic prospects. While poverty income threshold. reduce the rate of older persons in the poverty rate for all ages hovers poverty over the past half century. at 13 percent, it is estimated that Female-headed households make up In the mid-1960s, nearly 30 percent nearly 19 percent of children under the largest proportion of single- of seniors in the United States were the age of 18 live in poverty. In rural parent families, and they often suffer in poverty. In 2010, less than 10 and small town communities the the highest levels of poverty. Rural, percent of persons age 65 nationally child poverty rate increases to 22 percent and is even higher for rural children under age 5, at 26 percent. Similar to national patterns, minority children experience poverty at greater rates than white not Hispanics. The poverty rate for rural minority children is nearly 20 percentage points higher than for rural white not Hispanic children, at 36 percent. For some groups child poverty is even more extreme, as an astounding 45 percent of African American children in rural communities are estimated to live in poverty. Poverty rates also vary by gender. Approximately 15 percent of rural female single-parent families in had incomes below the poverty men are in poverty, while the overall particular experience poverty at level. However, rural seniors poverty rate for rural women is 18 exceptionally high levels. The experience higher poverty than percent. Female-headed families American Community Survey (ACS) seniors nationwide. Again, older with children often struggle the most estimates that 45 percent of rural women experience higher poverty to meet basic needs. In these female single-parent families are in rates than their male counterparts. families, a single parent typically poverty. Overall, 14 percent of elderly women shoulders the responsibility of both have poverty level incomes.
- 7. HAC RURAL RESEARCH NOTE | June 2012 7 POVERTY BY LOCATION, 2010 Source: HAC Tabulations of 2006-2010 American Community Survey Persons and Families With Below Poverty Incomes Small Town & Rural Suburban & Exurban Urban United States Number Percent Number Percent Number Percent Number Percent FAMILIES (TOTAL) 1,980,465 11.8 2,835,766 7.5 2,869,114 13.3 7,685,345 10.1 With Related Child Under 18 1,494,439 19.4 2,222,517 11.7 2,298,242 20.0 6,015,198 15.7 With Related Child Under 5 327,847 23.4 456,407 13.2 452,215 19.0 1,236,469 17.1 Female-Headed With Related Child Under 18 876,861 45.5 1,349,671 32.8 1,432,403 38.4 3,658,935 37.4 Female-Headed With Related Child Under 5 203,907 57.2 284,405 42.2 280,302 43.3 768,614 45.8 PERSONS (TOTAL) 10,018,664 16.3 14,837,958 10.5 16,060,891 17.3 40,917,513 13.8 18 Years Old and Over 6,634,902 14.2 9,666,674 9.1 10,635,440 15.0 26,937,016 12.1 65 Years Old and Over 1,023,513 10.9 1,266,276 7.2 1,264,502 12.0 3,554,291 9.5 Related Child Under 18 Years 3,291,861 22.3 5,023,012 14.0 5,325,962 24.4 13,640,835 18.8 Related Child 5 to 17 Years 2,211,411 20.5 3,401,679 12.9 3,608,762 23.4 9,221,852 17.5 Unrelated Individuals 15 Years and Over 3,178,832 29.9 4,798,344 21.8 5,483,377 25.5 13,460,553 24.8
- 8. HAC RURAL RESEARCH NOTE | June 2012 8 RURAL AND SMALL TOWN POVERTY BY STATE, 2010 Persons for whom Persons with below State poverty is determined poverty income Percent Alabama 1,572,562 306,684 19.5 Alaska 337,384 37,166 11.0 Arizona 1,103,566 204,166 18.5 Arkansas 1,398,660 273,917 19.6 California 2,779,686 465,930 16.8 Colorado 810,648 95,073 11.7 Connecticut 188,429 20,941 11.1 Delaware 186,846 21,985 11.8 Florida 1,447,911 253,882 17.5 Georgia 2,259,014 468,900 20.8 Hawaii 410,308 46,110 11.2 Idaho 613,290 93,220 15.2 Illinois 1,914,109 259,958 13.6 Indiana 1,708,671 223,698 13.1 Iowa 1,522,417 165,597 10.9 Kansas 1,224,157 160,797 13.1 Kentucky 2,078,631 438,129 21.1 Louisiana 1,403,812 298,920 21.3 Maine 681,793 94,053 13.8 Maryland 413,835 44,104 10.7 Massachusetts 208,845 25,198 12.1 Michigan 1,852,173 291,024 15.7 Minnesota 1,630,056 192,899 11.8 Mississippi 1,768,985 435,220 24.6 Missouri 1,951,150 325,513 16.7 Montana 671,874 98,237 14.6 Nebraska 807,230 92,709 11.5 Nevada 295,751 33,194 11.2 New Hampshire 483,297 45,113 9.3 New Jersey 126,727 14,701 11.6 New Mexico 816,633 170,807 20.9 New York 1,934,428 277,393 14.3 North Carolina 2,820,663 538,247 19.1 North Dakota 369,488 42,702 11.6 Ohio 2,496,325 375,127 15.0 Oklahoma 1,573,324 286,088 18.2 Oregon 1,145,078 172,302 15.0 Pennsylvania 2,275,091 287,972 12.7 Rhode Island 22,511 1,653 7.3 South Carolina 1,271,075 265,934 20.9 South Dakota 496,353 76,387 15.4 Tennessee 1,902,061 356,661 18.8 Texas 4,006,746 728,128 18.2 Utah 471,201 53,431 11.3 Vermont 427,561 49,357 11.5 Virginia 1,453,450 216,978 14.9 Washington 1,064,799 176,067 16.5 West Virginia 934,323 177,344 19.0 Wisconsin 1,808,266 199,956 11.1 Wyoming 396,892 39,092 9.8 TOTAL 61,538,085 10,018,664 16.3
- 9. HAC RURAL RESEARCH NOTE | June 2012 9 The Housing Assistance Council is a national nonprofit organization that supports affordable housing efforts in rural areas of the United States. HAC provides technical housing services, seed money loans from a revolving fund, housing program and policy assistance, and research and information services. HAC is an equal opportunity lender. HAC Rural Research Note 1025 Vermont Avenue NW Suite 606 Washington, DC 20005 202-842-8600 www.ruralhome.org Southeast Office Midwest Office Southwest Office Western Office 600 W Peachtree St., N.W. 10920 Ambassador Dr. 3939 San Pedro, N.E. 717 K Street Suite 1500 Suite 220 Suite C-7 Suite 404 Atlanta, GA 30308 Kansas City, MO 64153 Albuquerque, NM 87110 Sacramento, CA 95814 Tel.: 404-892-4824 Tel.: 816-880-0400 Tel.: 505-883-1003 Tel.: 916-706-1836 Fax: 404-892-1204 Fax: 816-880-0500 Fax: 505-883-1005 Fax: 916-706-1849 southeast@ruralhome.org midwest@ruralhome.org southwest@ruralhome.org western@ruralhome.org