SlideShare a Scribd company logo
1 of 8
Download to read offline
REVIEW                                                                                                                                                                   doi:10.1038/nature10717


The Amazon basin in transition
Eric A. Davidson1, Alessandro C. de Arau 2,3, Paulo Artaxo4, Jennifer K. Balch1,5, I. Foster Brown1,6, Mercedes M. C. Bustamante7,
                                        ´jo
Michael T. Coe1, Ruth S. DeFries8, Michael Keller9,10, Marcos Longo11, J. William Munger11, Wilfrid Schroeder12,
Britaldo S. Soares-Filho13, Carlos M. Souza Jr14 & Steven C. Wofsy11


   Agricultural expansion and climate variability have become important agents of disturbance in the Amazon basin.
   Recent studies have demonstrated considerable resilience of Amazonian forests to moderate annual drought, but they
   also show that interactions between deforestation, fire and drought potentially lead to losses of carbon storage and
   changes in regional precipitation patterns and river discharge. Although the basin-wide impacts of land use and drought
   may not yet surpass the magnitude of natural variability of hydrologic and biogeochemical cycles, there are some signs of
   a transition to a disturbance-dominated regime. These signs include changing energy and water cycles in the southern
   and eastern portions of the Amazon basin.


         umans have been part of the vast forest–river system of the                                    northwest to the wet/dry climate and long dry season of the southern

H        Amazon basin for many thousands of years, but expansion
         and intensification of agriculture, logging and urban footprints
during the past few decades have been unprecedented. The human
                                                                                                        and eastern regions, including the Cerrado (woodland/savannah) in the
                                                                                                        southeast. This climatic gradient is largely coincident with a gradient in
                                                                                                        land-use change, with more conversion to agriculture in the drier eastern
population of the Brazilian Amazon region increased from 6 million                                      and southern regions, indicating the interconnectedness of biophysical
in 1960 to 25 million in 2010, and the forest cover for this region has                                 and socio-economic processes.
declined to about 80% of its original area1. Efforts to curb deforestation                                            ˜
                                                                                                           The El Nino/Southern Oscillation (ENSO) profoundly affects rainfall
have led to a steep decline in forest clearing in the Brazilian Amazon,                                 in the Amazon basin5, especially the eastern portion; there is decreased
from nearly 28,000 km2 yr21 in 2004 to less than 7,000 km2 yr21 in                                      flow of the Amazon River and some of its major tributaries during El
20111. However, this progress remains fragile. The river system                                            ˜
                                                                                                        Nino years, and increased flow and increased flooding during La Nina    ˜
produces about 20% of the world’s freshwater discharge2, and the forest                                 years6. The ENSO effect is superimposed over a 28-year cycle of vari-
biomass holds about 100 billion tonnes of carbon (C; refs 3, 4), which is                               ation in precipitation5,6 such that the biggest floods occur when La Nina
                                                                                                                                                                                ˜
equivalent to more than 10 years’ worth of global fossil-fuel emissions.                                coincides with the wet phase in the 28-year cycle; this coincidence last
Maintaining the biotic integrity of the biome and the ecosystem services it                             occurred in the mid-1970s (Fig. 3). The worst droughts occur when El
provides to local, regional and global communities will require improved                                   ˜
                                                                                                        Nino coincides with the dry phase of the longer-term cycle, such as the
understanding of the vulnerability and resilience of Amazonian eco-                                     1992 drought. The North Atlantic Oscillation (NAO) also affects the
systems in the face of change.                                                                          region, contributing to, for example, the 2005 drought, which resulted in
   Here we provide a framework for understanding the linkages between                                   the lowest river levels recorded until then in southern and western
natural variability, drivers of change, responses and feedbacks in the                                  tributaries8. Although much has been learned about extreme events
Amazon basin (Fig. 1). Although the basin-wide carbon balance remains                                   and decadal-scale cycles, no discernable long-term trend has yet been
uncertain, evidence is emerging for a directional change from a possible                                identified in the total discharge of the Amazon River9.
sink towards a possible source. Where deforestation is widespread at
local and regional scales, the dry season duration is lengthening and wet                               Forests are resistant to seasonal droughts
season discharge is increasing. We show that the forest is resilient to                                 The ability of roots to access deep soil water10 and to redistribute it11
considerable natural climatic variation, but global and regional climate                                helps to maintain evergreen canopies during dry seasons, demonstrating
change forcings interact with land-use change, logging and fire in com-                                 the adaptation of Amazon forest species to seasonal drought. The com-
plex ways, generally leading to forest ecosystems that are increasingly                                 bination of access to deep soil water and less cloudiness permits con-
vulnerable to degradation.                                                                              tinued plant photosynthesis throughout most of the dry season12.
                                                                                                        However, transitional forests and Cerrado ecosystems, where mean
Natural and anthropogenic climatic variation                                                            annual precipitation is less than 1,700 mm and the dry season lasts for
Changes in Amazonian ecosystems must be viewed in the context of the                                    $4 months, show clear evidence of dry season declines in evapotran-
natural variation in climate5,6 and soils7 across the region, as well as                                spiration and therefore potential water stress13. Many tree species in the
natural cycles of climatic variation and extreme events. A climatic                                     Amazon and Cerrado produce a flush of new green leaves near the end
gradient spans the Amazon basin (Fig. 2), from the continuously rainy                                   of every dry season, which is often detected in satellite images as an
1
  The Woods Hole Research Center, 149 Woods Hole Road, Falmouth, Massachusetts 02540-1644, USA. 2Embrapa Amazonia Oriental, Travessa Dr. Eneas Pinheiro, s/n, Marco, Caixa Postal 48, Belem, Para
                                                                                                                         ˆ                            ´                                            ´       ´
66095-100, Brazil. 3Instituto Nacional de Pesquisas da Amazonia (INPA), Large Scale Biosphere-Atmosphere Experiment in Amazonia (LBA), Avenida Andre Araujo, 2936, Manaus, Amazonas, 69060-001,
                                                                                                                                                            ´     ´
Brazil. 4Instituto de Fısica, Universidade de Sao Paulo, Rua do Matao, Travessa R, 187, Sa Paulo, SP 05508-090, Brazil. 5National Center for Ecological Analysis and Synthesis, 735 State Street, Suite 300,
                       ´                       ˜                   ˜                     ˜o
Santa Barbara, California 93101, USA. 6Universidade Federal do Acre, Mestrado em Ecologia e Manejo de Recursos Naturais, Parque Zoobota        ˆnico, Distrito Industrial, Rio Branco, AC 69915-900, Brazil.
7
  Universidade de Brasılia, Instituto de Ciencias Biologicas, Departamento de Ecologia, Campus Universita Darcy Ribeiro, Asa Norte, Brasılia, Distrito Federal 70910-900, Brazil. 8Columbia University,
                         ´                  ˆ         ´                                                  ´rio                                ´
                                                                                                                           9
                                                                                                                                                                                                ´
Department of Ecology, Evolution, and Environmental Biology, 1200 Amsterdam Avenue, New York, New York 10027, USA. USDA Forest Service, International Institute of Tropical Forestry, Jardın Bota      ´nico
Sur, 1201 Calle Ceiba, San Juan, Puerto Rico 00926-1119, USA. 10Embrapa Monitoramento por Satelite, Avenida Soldado Passarinho, 303, Fazenda Chapada Campinas, Sao Paulo, Brazil. 11Harvard
                                                                                                      ´                                                          ˜o,              ˜
University, School of Engineering and Applied Sciences, Department of Earth and Planetary Sciences, 20 Oxford Street, Cambridge, Massachusetts 02138, USA. 12University of Maryland, Earth System
Science Interdisciplinary Center, 5825 University Research Court Suite 4001, College Park, Maryland 20740, USA. 13Universidade Federal de Minas Gerais, Centro de Sensoriamento Remoto, Avenida
Antonio Carlos 6627, Belo Horizonte, Minas Gerais 31270-900, Brazil. 14Imazon, Centro de Geotecnologia do Imazon, Rua Domingos Marreiros 2020, Belem, Para 66060-160, Brazil.
    ˆ                                                                                                                                                         ´       ´


                                                                                                                                   1 9 J A N U A RY 2 0 1 2 | VO L 4 8 1 | N AT U R E | 3 2 1
                                                             ©2012 Macmillan Publishers Limited. All rights reserved
RESEARCH REVIEW


                                         Agricultural                            Logging                    Global climate
                                         expansion                                                             change


                                                               Increased
                                                               economic
                                                                 activity
                                  Reduced                                                                Reduced precipitation
                              evapotranspiration                                                         over forests; increased
                                                                                                           extreme droughts

                                                                            Forest drying and
                                                                              tree mortality


                                              Biodiversity
                                                 loss                        Increased fire risk               Increased aerosols


                                                                                                                        Decreased regional-
                                                                                                                            scale runoff
                                       Increased local                     Infrastructure damage;
                                         scale runoff                   reduced investment incentive


                                                                                                                          Reduced water
                                                                                                                          Reduced water
                                   Flooding             Decreased agricultural             Increased respiratory    availability for human use,
                                                      and economic productivity              disease; air traffic      river navigation, and
                                                                                                 disruption          hydroelectric generation


Figure 1 | Interactions between global climate, land use, fire, hydrology, ecology and human dimensions. Forcing factors are indicated with red ovals;
processes addressed in this Review are indicated by green boxes and arrows; and consequences for human society are indicated by blue boxes with rounded corners.


                                                        1.75
                                                               55
                                                             1.7
                                                                 0
                                                                20
                                                                55
                                                              1.7


                                                                 1.75
                                                                  .50
                                                                  .0


                                                                         1.75
                                                                         0 .7


                                                                                                0.50
                                                                                                1.75
                                                                                                                                              5
                                                                                                                                            0.2


                Forest

                Cerrado

                Pasture/cropland

                Other


Figure 2 | Climatic gradient across the Amazon basin. Main figure, the                     data elsewhere. The arrow emphasizes the trend from continuously wet
hydrologic Amazon basin is demarcated by a thick blue line; isopleths of mean              conditions in the northwest to long and pronounced dry seasons in the
daily precipitation during the three driest months of the year97 (in mm; white             southeast, which includes Cerrado (savannah/woodland) vegetation. National
lines) are overlain onto four land-cover classes98,99 (key at bottom left). These          boundaries are demarcated by broken black lines. Inset, map showing area of
isopleths are presented only for areas within Brazil, because of lack of adequate          main figure (boxed).
3 2 2 | N AT U R E | VO L 4 8 1 | 1 9 J A N U A RY 2 0 1 2
                                                    ©2012 Macmillan Publishers Limited. All rights reserved
REVIEW RESEARCH

a                                            40                                                                               the Solimoes River basin was only 33–65% of average values8—may have
                                                                                                                                         ˜
                                                                                                                              exceeded the adaptive capacity of many forest species. Analysis of 51
Percentage deviation from mean flood area


                                                         La Niña years
                                            30                                                                                long-term monitoring plots across Amazonia showed that, relative to
                                                         El Niño years
                                                         Non-ENSO years                                                       pre-2005 conditions, most forest plots subjected to increased water
                                            20
                                                                                                                              deficit in 2005 lost several tons of living tree biomass carbon per hectare,
                                            10                                                                                owing to a marginally non-significant decline in growth and a significant
                                                                                                                              increase in mortality of trees19. A similarly severe but more extensive
                                              0                                                                               drought occurred again in 2010, affecting more than half of the basin
                                                                                                                              and resulting in the lowest discharge ever recorded at Manaus20,21.
                                            –10                                                                               Susceptibility to drought is likely to vary regionally, depending on the
                                                                                                                              climate (total precipitation and its seasonal distribution) and soil water
                                            –20                                                                               storage properties (texture and depth) to which the existing vegeta-
                                                                                                                              tion types (for example, Cerrado woodlands, tall-statured central
                                            –30
                                                                                                                              Amazon forests, and transition forests) are physiologically adapted.
                                            –40
                                                                                                                              Furthermore, there is evidence that certain taxa are more vulnerable to
                                               1938          1948     1958       1968         1978       1988          1998   drought-induced mortality17,22. Despite this regional variability, the
                                                                                                                              observations of natural droughts and the drought manipulation experi-
b 160                                                                                                                         ments indicate similar trends of mortality in response to dry season
                                                                                                      La Niña years           intensity23.
                                                                                                      El Niño years
                                            140                                                       Non-ENSO years          Land-use change and regional climate
                                                                                                                              Land use is changed to capture agricultural and forestry revenues, and
                                            120                                                                               results in trade-offs with multiple ecosystem services, such as C storage,
                                                                                                                              climate regulation, hydrologic balance and biodiversity (Fig. 1).
       (103 km2)


                                            100
                                                                                                                              The drivers of deforestation
                                                                                                                              Road paving is one of the economic activities that stimulates deforesta-
                                             80                                                                               tion24. Further clearing occurs along networks of ‘unofficial roads’ that
                                                                                                                              result from the interacting interests of colonist farmers and loggers25;
                                             60
                                                                                                                              loggers minimize their costs by buying the right to log private lands.
                                                                                                                              Although practices vary widely across the region, most small land
                                                                                                                              holders (,200 ha) have kept more than 50% of their land in some
                                             40                                                                               combination of mature and secondary forest26.
                                                  J M M J S N J M M J S N J M M J S N J M M J S N J M M J S N
                                                      1988          1989        1990           1991             1992             International and national demands for cattle and livestock feed are
                                                                             Month and year                                   increasingly driving land-use change. Direct conversion of forest to
Figure 3 | Decadal and seasonal variation in flood area. The long-term                                                        cropland in 2003, mostly by large land holders, represented 23% of
record of simulated interannual variation in percentage deviation from mean                                                   the deforestation in forest and Cerrado regions of the state of Mato
flood area (a) illustrates how the ENSO events are superimposed over a 28-year                                                Grosso27. Although cattle pasture remains the dominant use of cleared
cycle of high- and low-precipitation phases100. Recurrent seasonal patterns of                                                land, the growing importance of larger and faster conversion to crop-
flooded area (103 km2) for five selected years (b) are superimposed over the                                                  land, mostly for soybean export, has defined a trend of forest loss in
                                          ˜                             ˜
interannual variation. Striped bars, La Nina years; stippled bars, El Nino years;                                             Amazonia since the early 2000s.
solid bars, non-ENSO years.
                                                                                                                                 Although selective logging is not an immediate land-use change, it
increase in vegetation indices that involve ratios of red and near-infrared                                                   often leads to deforestation. From 1999 to 2003, the area annually logged
reflectance14,15. The relation between these satellite-based indices of                                                       in the Amazon basin was similar in magnitude to the area deforested28.
seasonal greenness and ecosystem productivity remains an unresolved                                                           Logged areas are accessible by logging roads and are likely to be cleared
focus of debate in these studies, but in any case, this response represents                                                   within only a few years after initial disturbance29, and those that are not
a short-term phenomenon.                                                                                                      cleared have a high risk of burning30. On the other hand, reduced-impact
                                                                                                                              logging has been demonstrated to be economically viable, while causing
Multi-year or extreme drought                                                                                                 only modest and transient effects on carbon storage and water
Experimental manipulations and observations of permanent forest plots                                                         exchange31. Expansion of protected areas has also played an important
address responses to multi-year and extreme drought. Two long-term                                                            role in reducing deforestation in the Brazilian Amazon (Fig. 4)32.
drought experiments have produced remarkably similar results, demon-
strating that adaptation to seasonal drought can be overwhelmed by                                                            Deforestation alters the energy balance
multi-year drought16,17. These studies demonstrated a physiological                                                           Incoming air from the Atlantic Ocean provides about two-thirds of the
adaptation of the trees, which maintained a relatively constant water                                                         moisture that forms precipitation over the Amazon basin33. The remainder
tension in the xylem (isohydry) in both wet and dry seasons; but this                                                         is supplied through recycling of evapotranspiration, primarily driven by
adaptation may eventually lead to mortality when roots are unable to                                                          the deep-rooted Amazon trees.
extract enough soil water during multi-year droughts18. After diverting                                                          A large number of observational and modelling studies have sug-
35–50% of total rainfall for three years using below-canopy panels and                                                        gested that deforestation causes two main changes in the energy and
gutters, plant-available soil moisture stores became depleted, wood pro-                                                      water balance of the Amazon basin, as follows. First, partitioning of the
duction declined by about 30–60%, tree mortality nearly doubled, and                                                          net radiation that is absorbed by the land surface changes, with a
live above-ground biomass decreased by about 18–25% (refs 16, 17).                                                            decrease in the latent heat flux and an increase in the sensible heat flux,
Mortality rates increased to nearly three times that in the control plot                                                      primarily because deforestation results in less vegetation being available
during years 4–7 of rainfall exclusion17.                                                                                     to transpire water to the atmosphere. Second, replacing the dark rainforest
   The severe 2005 drought in the southwestern Amazon—when dry                                                                with more reflective pasturelands or crops results in a decrease in solar
season temperatures were 3–5 uC warmer than normal and rainfall over                                                          radiation absorbed by the land surface. Reforestation can reverse these

                                                                                                                                                  1 9 J A N U A RY 2 0 1 2 | VO L 4 8 1 | N AT U R E | 3 2 3
                                                                                         ©2012 Macmillan Publishers Limited. All rights reserved
RESEARCH REVIEW

a                                                                                                  b
    Major towns                                                        Planned railway                                         Risk of fire
    Hydroelectric power plant in operation                             Railway                                          Low                   High

    Hydroelectric power plant under construction                       Gas/oil pipeline
                                                                       Major rivers
    Planned hydroelectric
    power plant                                                        Paved roads
                                                                       Roads to be paved
                                                   60° W               Planned roads                                                 60° W

                                                          7
                                                                   6


         0°                                                                                   0°
                                                                             4
                                                     3
                      8


                                         2
                                    5                                                10° S                                                                             10° S

                                9
                                                                        50° W                                                                              50° W
                                                               1
                            70° W                                                                              70° W
                                             10

                                                                                                                                                     National boundary

        Forest            Deforested              Non-forest           Protected areas

Figure 4 | The Amazon basin today and future fire risks. a, Protected areas                                                        ´                                   ´
                                                                                          a indicate the following cities: 1, Cuiaba; 2, Porto Velho; 3, Manaus; 4, Belem; 5,
and major planned infrastructure. b, The risk of fire by 205096 under business-           Rio Branco; 6, Paramaribo; 7, Georgetown; 8, Iquitos; 9, Puerto Maldonado; 10,
as-usual deforestation and climate change scenarios24. The numbers in                     Santa Cruz de la Sierra.


trends. Within a few years of pasture abandonment, regrowing                                 A large disturbance and a long data record are needed to detect
Amazonian forests establish rates of evapotranspiration and reflectivity                  unambiguously the effect of deforestation on the discharge from a large
that are close to those measured in mature forests, even though they have                 river, given the large interannual and decadal variation in precipitation.
not yet recovered the biomass and species diversity of a mature forest34,35.              For most of the major tributaries of the Amazon River, the area deforested
   Atmospheric convection and precipitation are driven by the fluxes of                   is not yet large enough to be able to attribute changes in discharge spe-
energy and water from the land surface. Where clearings for cattle pastures               cifically to deforestation. Similarly, a temporal trend in sediment load
extend tens of kilometres outward from a road, the air above the deforested               could not be distinguished from highly variable interannual and seasonal
areas warms up more quickly and tends to rise and draw moist air from the                 variation for the Madeira River, which drains the southwestern Amazon
surrounding forest, creating so-called ‘vegetation breezes’. This decreases               basin40. However, for the Tocantins River41 and Araguaia River42 systems,
rainfall over the forest while increasing cloudiness, rainfall and thunder-               which drain parts of the Cerrado and rainforest environments in the
storms over the pasture36. Heterogeneous deforestation at large scales                    southeastern Amazon, the relative contributions of climate variability
(hundreds to thousands of km2) leads to more complex circulation                          and deforestation have been teased apart. From 1955 to 1995, the area
changes, with suppressed rainfall over core clearings, particularly at the                of pasture and cropland in the Tocantins basin increased from about 30%
beginning and the end of the wet season, and unchanged or increased                       to 50% and annual river discharge increased by about 25%, but changes in
rainfall over large remnant forest patches37,38. These changes also affect                precipitation were not statistically significant. Changes of the same mag-
water and light availability, and the C uptake of the remaining forests, but              nitude have occurred in the Araguaia River since the 1970s, and sediment
those effects are not yet well quantified.                                                load increased by 28% with deforestation. In both rivers, discharge
   At deforestation scales greater than 105 km2, numerical models con-                    increased mostly during the wet season, when flooding risks are greatest.
sistently suggest that a significant decrease in basin-wide precipitation will            If deforestation approaches this magnitude in other tributaries, it is likely
occur39 due to: (1) a decrease in the evapotranspiration from deforested                  that land-use change will enhance flooding and sediment transport.
regions and resultant downwind transport of water vapour; and (2) a
decrease in net absorbed solar energy and a consequent general weakening                  Regional climate change
of the continental-scale low-pressure system that drives precipitation over               The IPCC fourth assessment climate change model runs show the highest
the basin.                                                                                probability of significant precipitation decrease predicted for southeastern
                                                                                          Amazonia, where deforestation is greatest and where the climate and
Deforestation, climate and river discharge                                                ecosystems transition from short-dry-season rainforest to long-dry-
Taken alone, a decrease in regional precipitation would result in                         season savannah ecosystems43,44. Various global and regional climate
decreased discharge. However, the integrated response of a river system                   modelling approaches have suggested that once deforestation exceeds
depends on the balance between precipitation and evapotranspiration                       about 40% of the entire Amazon basin, a ‘tipping point’ might be passed45,
effects (Fig. 1). Deforestation within a particular watershed would cause                 whereby decreased energy and moisture released to the atmosphere from
reduced evapotranspiration and increased discharge, but deforestation                     the largely deforested landscape would result in reduced convection and
at the continental scale could cause reduced regional precipitation and a                 precipitation, and a shift in the forest–savannah boundary or large-scale
tendency towards decreased river discharge39.                                             dieback of rainforest.

3 2 4 | N AT U R E | VO L 4 8 1 | 1 9 J A N U A RY 2 0 1 2
                                                         ©2012 Macmillan Publishers Limited. All rights reserved
REVIEW RESEARCH

   A number of deficiencies in the structure and application of global           fire53. However, several lines of evidence indicate that this natural res-
climate models suggest that the uncertainty of these simulated outcomes          istance may be changing: (1) about 39,000 km2 of Amazon forest burned
and estimated tipping points is very high. A few examples include: (1)           during the El Nino drought of 199854, including intact, closed-canopy
                                                                                                    ˜
many of the models simulate too little precipitation in the Amazon owing         forests; (2) both logging and drought-induced tree mortality allow sun-
to incomplete representation of the role of the Andes in continental             light to penetrate clearings in the canopy, which dries out the forest
circulation and large-scale convection over the core of the western              floor, rendering it more flammable53; (3) after a forest is burned once,
Amazon, and also owing to coarse representation of the land surface with         it is more likely to burn again, because a burned forest dries out more
respect to small-scale meteorological processes43; (2) inter-annual vari-        easily30; and (4) ignition sources have also increased owing to pasture
ation of sea surface temperatures in the tropical Pacific and tropical north     management and charcoal making46. Although Brazil has made great
Atlantic Ocean are closely associated with extreme flood and drought             strides in recent years to reduce rates of deforestation1, the frequency of
events in the Amazon5,8,20, but these teleconnections to the Amazon are          fire has not decreased55, and prospects for continued forest degradation
not yet adequately represented in global climate models; and (3) the             resulting from fires escaping nearby agricultural areas may be a growing
biophysical response of vegetation to increasing atmospheric CO2,                risk in many regions.
including effects on evapotranspiration, may be one of the largest
unknowns for the future of the Amazon forests. The probability of simu-          Fires alter forest characteristics
lated forest dieback due to decreased rainfall is greatly reduced when a         After fires sweep through Amazonian forests, tree mortality ranges from
strong CO2 fertilization response is included in a vegetation model44, but       8% to 64% of mature stems ($10 cm diameter at breast height)56. More
the scale of the actual impact of increasing CO2 on photosynthetic effi-         frequent and/or more severe fires tend to increase tree and liana
ciency remains a large source of uncertainty.                                    mortality57. Big trees are generally better adapted to surviving fire, but
   In summary, the changes in precipitation and discharge associated             tend to be the first to suffer from drought19,22,57. Although surviving stems
with deforestation already observed in the southern and eastern                  can benefit from the initial pulse of fire-released nutrients and reduced
Amazon demonstrate a potential for significant vegetation shifts and             competition, fire-induced mortality reduces overall canopy cover, bio-
further feedbacks to climate and discharge. Numerical models strongly            mass, and species richness57,58. The decline in plant species diversity also
suggest that potential future deforestation may also cause feedbacks to          reduces the abundance of fruits and invertebrates, thereby changing the
large-scale climate and vegetation distribution, but the models have             food supply of birds and other animals56. Frequent fire could change the
deficiencies that prevent confident prediction of the magnitude or spatial       structure, composition and functioning of vegetation by selecting fire-
distribution of deforestation that would lead to a significant region-wide       adapted species and favouring more flammable species (for example,
decrease in precipitation—including whether a threshold, or tipping point,       grasses), thus leading to a more savannah-like ecosystem59.
exists whereby the basin could slip into a dry, stable state. Focusing on a
theoretical and difficult-to-define tipping point for the entire basin may       Multiple fires retard forest regrowth
divert the scientific community from the important large-scale regional          Fire is used as a tool to help clear land for cattle pasture and to slow the
changes that are already taking place, such as lengthening of the dry            invasion of woody shrubs, but pastures are often abandoned after a few
season37,38 and increases in river discharge41,42 in ecologically and agricul-   years, when grass productivity declines and weeds can no longer be
turally important transition zones of the eastern and southern flanks of the     effectively controlled. Despite tremendous diversity in rates of regrowth
basin.                                                                           among secondary forests from different regions of the basin, the rate of
                                                                                 secondary forest regrowth following pasture abandonment was found to
Fire as cause and consequence of change                                          be negatively correlated with the number of fires that occurred while in
The probability of fire is clearly affected by climate and land use, the         the pasture phase60. Nitrogen (N) loss during burning alters the natural
latter providing the majority of ignition sources today46. Fire also affects     patterns of phosphorus limitation on highly weathered soils. In a study
regional climate through a complex set of biophysical and socio-                 of secondary forests growing on abandoned pastures and croplands,
economic feedback processes (Fig. 1).                                            several soil and foliage indicators of N limitation were strongest in the
                                                                                 youngest forest stands and became less pronounced as the forests aged61.
Smoke changes cloud physics and rainfall                                         After decades of forest regrowth, the N cycle gradually recuperates,
During the wet season, the air over most of the Amazon region is as              establishing a N-rich mature forest, but the rate of recuperation, as well
pristine as air over the open ocean—only a few hundred aerosol particles         as the rate of forest regrowth, depends, in part, on the legacy of previous
per cm3 of air47—inspiring the term ‘green ocean’48. In stark contrast,          land use and fire.
burning for land clearing, pasture management and charcoal produc-
tion, and escaped forest fires during the dry season, increase aerosols to       Disturbance effects on greenhouse gases
more than 40,000 particles per cm3 of air in some regions47. This smoke          Changes in greenhouse-gas emissions due to disturbance processes
and haze affects the microphysical processes within clouds that deter-           must be placed in the context of natural emissions. Amazonian forests
mine how droplets are formed, making droplets too small to precipitate           and wetlands are significant natural sources of methane62–64 and nitrous
as rain, thus reducing local rainfall and increasing cloud lifetime49. The       oxide65,66 (Fig. 5). Unfortunately, a net carbon balance for the region
water vapour remaining in the atmosphere ascends to higher altitudes,            remains elusive.
where it invigorates thunderstorm formation and lightning strikes, but
not necessarily rain. During the dry season, satellite-based measure-            Mature forests may be accumulating carbon
ments of aerosol optical depth were inversely correlated with precipita-         Repeated sampling of about 100 permanent plots in the RAINFOR
tion50. In addition to locally smoke-inhibited rainfall, fires cause further     network scattered across nearly all Amazonian countries indicates that
plant stress due to ozone pollution51 and thick haze that reduces light          mature Amazonian forests have been accumulating carbon at an esti-
availability and photosynthesis52. Generally, plants are most productive         mated rate of 0.4 Pg C yr21 (1 Pg 5 1015 g; 95% confidence interval
with some scattered light at intermediate levels of aerosol thickness, but       range of estimate, 0.29–0.57 Pg C yr21) in the decades before the 2005
conditions during the biomass burning season often exceed this                   drought19. The fastest growing trees are in the foothills of the Andes,
optimum52.                                                                       where the soils are generally younger and more fertile7, but where the
                                                                                 trees are generally smaller and shorter-lived3,4. In contrast, the biggest
Drought increases fire susceptibility                                            and slowest growing trees occur in the oldest and more nutrient-poor
The tall, dense tree canopy of central Amazonian forests creates a humid         soils of the lowland central and eastern parts of the basin67. The soils of
microclimate at ground level, which naturally protects the forest from           mature forests on highly weathered Oxisols and Ultisols are unlikely to

                                                                                                     1 9 J A N U A RY 2 0 1 2 | VO L 4 8 1 | N AT U R E | 3 2 5
                                               ©2012 Macmillan Publishers Limited. All rights reserved
RESEARCH REVIEW


                                                                                                                                                                                  <0.1 CH4 cattle emission 
                                                                                                                                                                                                              future aircraft measurements will corroborate the C sink inferred from


                                                                                         0.3 unknown CH4 source


                                                                                                                                                                                  <0.1 CH4 soil emission 
                                                                                                                                                                                                              scattered ground measurements in the more intact forests of the western


                                                                                         <0.1 CH4 soil uptake


                                                                                                                                     < 0.1 pyrogenic CH4 
                                                                                                                                                                                                              part of the basin.


                                                                                                                                                                                  <0.1 N2O reduced
                                                                                                                                                            < 0.1 pyrogenic N2O
                   0.7 CH4 emission


                                                                                         0.6 N2O emission
                                      ?? N2O emission


                                                                      2 CO2 net uptake


                                                                                                                                                                                  CO2 sink/source
   ?? CO2 uptake
   2 CO2 evasion


                                                                                                                    2 CO2 emission


                                                                                                                                                                                  soil emission
                                                                                                                                                                                                              Disturbing forests causes net C and N loss


                                                                                                                                                                                  ?? net soil
                                                                                                                                                                                                              The net effect of Amazonian deforestation and reforestation results in an
                                                                                                                                                                                                              annual net C source of 0.15–0.35 Pg C (ref. 80). Adding C emissions
                                                                                                                                                                                                              from fire and logging extends the range to an annual net release of
                                                                                                                                                                                                              0.2–0.8 Pg C (ref. 80). The estimated mean annual C emission from
                                                          0.4 DIC                                                                                                                                             deforestation and burning of Cerrado is 0.07 Pg C for 2003 to 200881.
                                                          and DOC
    Wetland/river/                                                                       Forest                                                                                        Pasture                These estimates are improving, in part because of advances in the tech-
    riparian forest                                     Groundwater                                               Deforestation,                                                                              nology for analysing satellite images82 to combine spatially explicit
                                                        and surface                                               reforestation,                                                                              deforestation rates with regionally specific estimates of forest-C stocks83.
                                                           runoff                                                 fire and logging
                                                                                                                                                                                                                 Pyrogenic CH4 emissions from conversion of Amazonian and Cerrado
Figure 5 | Estimates of Amazonian greenhouse-gas emissions. Estimates of                                                                                                                                      native vegetation to pasture are about 1.0 and 0.4 Tg CH4 yr21, respec-
annual, basin-wide greenhouse-gas fluxes described in the text are presented                                                                                                                                  tively81, but this does not include shifting cultivation or wildfire. Annual
together here, in a common currency of Pg CO2-equivalents, using 100-year                                                                                                                                     pyrogenic N2O emissions from conversion of Amazonian forest to pasture
global warming potentials for CO2 (black), CH4 (red) and N2O (purple). Owing
                                                                                                                                                                                                              are about 0.01 Tg N as N2O (ref. 81), but this does not include shifting
to large uncertainties, all values are rounded to one significant figure, and even
these estimates remain subject to debate. Where no estimate is available, ‘‘??’’ is                                                                                                                           cultivation or wildfire.
indicated. Note that dissolved inorganic carbon (DIC) and dissolved organic                                                                                                                                      When forests are replaced by cattle pastures, they can either gain84 or
carbon (DOC) may be transported via groundwater and overland flow from                                                                                                                                        lose85 soil C. Losses are more common where soil C stocks are initially
upland forests to streamside (riparian) forests, and that CO2 can be lost                                                                                                                                     large, and gains are more common when management inputs (fertilizer,
(evasion) from river water to the atmosphere.                                                                                                                                                                 herd rotation, overgrazing avoidance) are greatest86. However, changes
                                                                                                                                                                                                              in soil C stocks are usually dwarfed by much larger losses in tree bio-
be significant C sinks68, although more study is needed on a wider                                                                                                                                            mass. In contrast, the sparse and short-statured trees of the Cerrado
diversity of soils.                                                                                                                                                                                           have less above-ground biomass than an Amazonian forest, but the C
   The cause of observed biomass increases in mature Amazonian forests                                                                                                                                        stocks in roots and soil organic matter of the Cerrado (100 Mg C ha21 in
remains unknown. Plausible explanations include a rebound from pre-                                                                                                                                           the top 1 m of soil) can be 2–7 times higher than the above-ground
vious human or natural disturbances69 or a change in resources that limit                                                                                                                                     stocks87. Well-managed cultivated pastures may provide enough C
plant productivity, such as atmospheric CO2, soil nutrients, or light                                                                                                                                         inputs to maintain soil C88, but most pastures in the Cerrado region
availability due to changes in radiation, climate and cloudiness70. The                                                                                                                                       are in advanced stages of degradation, where C inputs are too low to
RAINFOR network is our best indicator of Amazonian above-ground                                                                                                                                               sustain high soil C storage.
biomass change, but the network is neither a systematic nor a randomized                                                                                                                                         Amazonian upland forest soils annually take up about 1–3 Tg of CH4,
sampling of Amazonian vegetation. Because the network has relatively                                                                                                                                          and pasture soils are probably a small net annual source of ,0.1 Tg CH4
few small plots covering a vast region, the effects of large-scale natural                                                                                                                                    (ref. 65). A significant net emission of CH4 in upland forests has been
disturbances over decadal and longer timescales may not be included                                                                                                                                           measured, which might include termites or anaerobic respiration in water-
in the sampling network, leading to an overestimate of a biomass                                                                                                                                              logged wood, soil, bromeliads, or moss patches, but the source remains
increase69,71. Although this challenge to the RAINFOR conclusions has                                                                                                                                         unknown64. Enteric fermentation by cattle is estimated to emit 2.6 and
been rebutted72,73, resolving the issue will require empirical data on the                                                                                                                                    4.1 Tg CH4 yr21 in Amazonian and Cerrado regions, respectively81.
distribution of natural disturbances, which is still poorly known71. A                                                                                                                                        Continuing studies point to major hydroelectric reservoirs as an increasing
recent analysis of satellite images and meteorological data showed that                                                                                                                                       source of methane76. On the basis of chamber flux measurements, upland
large disturbances (.5 ha) caused by windstorms are rare, with a return                                                                                                                                       Amazonian forest soils are estimated to emit 1.3 Tg yr21 of N2O-N
interval of about 40,000 years (ref. 74), suggesting that such disturbance                                                                                                                                    (ref. 65), which is about 15% of global non-anthropogenic emissions.
effects may not be common enough to undermine extrapolations of                                                                                                                                               Young cattle pastures have higher N2O emissions compared to forests,
carbon uptake rates from the RAINFOR network. However, more work                                                                                                                                              but old pastures have lower emissions, so the net effect of deforestation has
on this topic is needed, including better estimates of the return intervals of                                                                                                                                been a small annual decrease of ,0.1 Tg N2O-N (ref. 65).
smaller disturbances (,5 ha)71.                                                                                                                                                                                  Although secondary forests may be significant carbon sinks in other
   Full C accounting should also include exports from forests to aquatic                                                                                                                                      parts of the world89, they currently contribute little to the net C balance
systems. The river water is supersaturated with dissolved CO2, which is                                                                                                                                       of the Amazon basin, because they are frequently re-cut before they
eventually released to the atmosphere at an estimated rate of about                                                                                                                                           grow large enough to store much C90. Indeed, the area of secondary
0.5 Pg C yr21 (ref. 75). Estimates of the sources of this C remain poorly                                                                                                                                     forests is declining where agriculture continues to expand and intensify,
constrained—about two-thirds may come from leaf and wood detritus                                                                                                                                             leading to continued loss of biomass-C from those regions91.
dropped into the river from flooded forests, with about one-third pro-                                                                                                                                        Agroforestry and other alternatives to slash-and-burn agriculture for
duced by aquatic plants (mats of grasses and other macrophytes) within                                                                                                                                        smallholders have not been widely adopted, but the potential for sig-
the river, and a small fraction by algae76. Additional possible sources                                                                                                                                       nificant C sequestration per hectare and the techniques of nutrient
include particulates washed in with soil particles and dissolved organic                                                                                                                                      management in these systems have been demonstrated92,93.
and inorganic C in ground water77,78. We know very little about the C
budget of flooded forests and riparian zone forests, which probably                                                                                                                                           Emerging evidence for a transition
contribute significant terrestrially fixed C to streams and rivers76.                                                                                                                                         Are impacts of land-use and climate change in the Amazon basin sur-
   Estimates of CO2 fluxes based on year-round vertical profiling of                                                                                                                                          passing the natural variability of climate, greenhouse-gas emissions, and
atmospheric CO2 concentrations by aircraft are available now only for                                                                                                                                         cycles of carbon, nitrogen and water? Thanks to increased research in
part of the eastern Amazon. Fire emissions roughly cancel a modest                                                                                                                                            this area, including the Large-scale Biosphere-Atmosphere (LBA)
biological sink during the dry season, so that a wet season source yields                                                                                                                                     experiment in Amazonia (see the accompanying World View in this
an annual net source of C to the atmosphere79. This result is consistent                                                                                                                                      issue for a description of the LBA project), we can answer this question
with ground-based estimates of slow growing trees and a concentration                                                                                                                                         for some, but not all consequences of land-use and climate change. For
of land-use change in the eastern part of the basin. It remains to be seen if                                                                                                                                 greenhouse gases, the answer is probably ‘not yet’ with respect to CH4

3 2 6 | N AT U R E | VO L 4 8 1 | 1 9 J A N U A RY 2 0 1 2
                                                                                                                    ©2012 Macmillan Publishers Limited. All rights reserved
REVIEW RESEARCH

and N2O, because they remain dominated by large emissions from                                12. Saleska, S. R. et al. Carbon in Amazon forests: unexpected seasonal fluxes and
                                                                                                  disturbance-induced losses. Science 302, 1554–1557 (2003).
undisturbed wetlands and soils, respectively, but the answer for CO2                          13. da Rocha, H. R. et al. Patterns of water and heat flux across a biome gradient from
is more complex (Fig. 5). Although a C budget for the basin remains                               tropical forest to savanna in Brazil. J. Geophys. Res. 114, G00B12, http://
uncertain, deforestation has moved the net basin-wide budget away                                 dx.doi.org/10.1029/2007JG000640 (2009).
                                                                                              14. Brando, P., Goetz, S., Baccini, A., Nepstad, D. & Beck, P. Seasonal and interannual
from a possible late-twentieth-century net C sink and towards a net                               variability of climate and vegetation indices across the Amazon. Proc. Natl Acad.
source. This directional change is consistent with recent results of                              Sci. USA 107, 14685–14690 (2010).
inverse modelling based on the TransCom3 network of CO2 measure-                              15. Huete, A. et al. Amazon rainforests green-up with sunlight in dry season. Geophys.
                                                                                                  Res. Lett. 33, L06405, http://dx.doi.org/10.1029/02005GL025583 (2006).
ments, which reports a shift from a sink in the 1980s to a source in the                      16. Brando, P. M. et al. Drought effects on litterfall, wood production, and belowground
2000s for the tropical Americas94. Much of the Amazon forest is resilient                         carbon cycling in an Amazon forest: results of a throughfall reduction experiment.
to seasonal and moderate drought, but this resilience can and has been                            Phil. Trans. R. Soc. B 363, 1839–1848 (2008).
                                                                                              17. da Costa, A. C. L. et al. Effect of 7 yr of experimental drought on vegetation
exceeded with experimental and natural severe droughts, indicating a                              dynamics and biomass storage of an eastern Amazonian rainforest. New Phytol.
risk of C loss if drought increases with climate change. The forest is also                       187, 579–591 (2010).
resilient to initial disturbances, but repeated or prolonged disturbance                      18. Fisher, R. A., Williams, M., Lobo do Vale, R., Costa, A. & Meir, P. Evidence from
changes forest structure and nutrient dynamics, potentially leading to a                          Amazonian forests is consistent with isohydric control of leaf water potential. Plant
                                                                                                  Cell Environ. 29, 151–165 (2006).
long-term change in vegetation composition and C loss. A combination                          19. Phillips, O. L. et al. Drought sensitivity of the Amazon rainforest. Science 323,
of regional net flux estimates based on aircraft campaign measurements                            1344–1347 (2009).
with ground-based studies that elucidate process-level understanding is                       20. Lewis, S. L., Brando, P. M., Phillips, O. L., van der Heijden, G. M. F. & Nepstad, D. C.
                                                                                                  The 2010 Amazon drought. Science 331, 554 (2011).
needed to narrow uncertainties.                                                               21. Xu, L. et al. Widespread decline in greenness of Amazonian vegetation due to the
   With respect to energy and water cycles, at least two of the large river                       2010 drought. Geophys. Res. Lett. 38, L07402, http://dx.doi.org/10.1029/
basins on the southeastern flanks of the Amazon forest that also drain                            2011GL046824 (2011).
                                                                                              22. Nepstad, D. C., Tohver, I. M., Ray, D., Moutinho, P. & Cardinot, G. Mortality of large
the more heavily deforested Cerrado region—the Tocantins and                                      trees and lianas following experimental drought in an Amazon forest. Ecology 88,
Araguaia basins—have experienced increases in wet season discharge                                2259–2269 (2007).
and sediment load. Evidence for changes in temporal and spatial patterns                      23. Phillips, O. L. et al. Drought–mortality relationships for tropical forests. New Phytol.
                                                                                                  187, 631–646 (2010).
of precipitation, such as extended length of the dry season, is emerging at                   24. Soares-Filho, B. S. et al. Modelling conservation in the Amazon basin. Nature 440,
local and regional scales. We cannot yet answer the questions of whether                          520–523 (2006).
total precipitation has changed or whether recent severe droughts and                             Landmark presentation of scenarios of development and conservation policies
                                                                                                  in a spatially explicit simulation model.
other extreme events are clear indicators of patterns expected to persist.                    25. Arima, E. Y., Walker, R. T., Perz, S. G. & Caldas, M. M. Loggers and forest
Narrowing uncertainties about the effects of deforestation on regional                            fragmentation: behavioral models of road building in the Amazon basin. Ann.
precipitation, temperature and fire risk will require combining realistic                         Assoc. Am. Geogr. 95, 525–541 (2005).
                                                                                                         ´
                                                                                              26. Brondızio, E. S. et al. in Amazonia and Global Change (eds Keller, M., Bustamante, M.,
spatial patterns of deforestation and degradation with improved mesoscale
                                                                                                  Gash, J. & Dias, P. S.) 117–143 (American Geophysical Union, 2009).
circulation models of climate.                                                                27. Morton, D. C. et al. Cropland expansion changes deforestation dynamics in the
   The emerging evidence of a system in biophysical transition high-                              southern Brazilian Amazon. Proc. Natl Acad. Sci. USA 103, 14637–14641 (2006).
lights the need for improved understanding of the trade-offs between land                     28. Asner, G. P. et al. Selective logging in the Brazilian Amazon. Science 310, 480–482
                                                                                                  (2005).
cover, carbon stocks, water resources, habitat conservation, human health                     29. Asner, G. P. et al. Condition and fate of logged forests in the Brazilian Amazon. Proc.
and economic development in future scenarios of climate and land-use                              Natl Acad. Sci. USA 103, 12947–12950 (2006).
change24,32,95,96. Brazil is poised to become one of the few countries to                     30. Nepstad, D. C. et al. Road paving, fire regime feedbacks, and the future of Amazon
                                                                                                  forests. For. Ecol. Mgmt 154, 395–407 (2001).
achieve the transition to a major economic power without destroying                           31. Miller, S. D. et al. Reduced impact logging minimally alters tropical rainforest
most of its forests. However, continued improvements in scientific and                            carbon and energy exchange. Proc. Natl Acad. Sci. USA http://dx.doi.org/10.1073/
technological capacity and human resources will be required in the                                pnas.1105068108 108, 19431–19435 (2011).
                                                                                              32. Soares-Filho, B. S. et al. Role of the Brazilian Amazon protected areas in climate
Amazon region to guide and manage both biophysical and socio-                                     change mitigation. Proc. Natl Acad. Sci. USA 107, 10821–10826 (2010).
economic transitions.                                                                         33. Costa, M. H. & Foley, J. A. Trends in the hydrologic cycle of the Amazon basin.
                                                                                                  J. Geophys. Res. 104, 14189–14198 (1999).
                                                                                                     ¨              ´,                                        ¨
                                                                                              34. Holscher, D., Sa T. D. A., Bastos, T. X., Denich, M. & Folster, H. Evaporation from
1.  Instituto Nacional de Pesquisas Espaciais & National Institute for Space Research
                                                                              ´
    Projeto Prodes Monitoramento da Florsta Amazonica Brasileira por Satelite Prodes              young secondary vegetation in eastern Amazonia. J. Hydrol. 193, 293–305 (1997).
    Æhttp://www.obt.inpe.br/prodes/æ (2011).                                                  35. Vieira, I. C. G. et al. Classifying successional forests using Landsat spectral
                                                                                                  properties and ecological characteristics in eastern Amazonia. Remote Sens.
2. Salati, E. & Vose, R. Amazon basin: a system in equilibrium. Science 225, 129–138
                                                                                                  Environ. 87, 470–481 (2003).
    (1984).
                                                                                              36. Avissar, R. & Schmidt, T. An evaluation of the scale at which ground-surface heat
    One of the first presentations of the Amazon basin from a systems perspective.
                                                                                                  flux patchiness affects the convective boundary layer using a large-eddy
3. Malhi, Y. et al. The regional variation of aboveground live biomass in old-growth
                                                                                                  simulation model. J. Atmos. Sci. 55, 2666–2689 (1998).
    Amazonian forests. Glob. Change Biol. 12, 1107–1138 (2006).
                                                                                              37. Butt, N., Oliveira, P. A. & Costa, M. H. Evidence that deforestation affects the onset of
4. Saatchi, S. S., Houghton, R. A., Dos Santos Alvara, R. C., Soares, J. V. & Yu, Y.              the rainy season in Rondonia, Brazil. J. Geophys. Res. 116, D11120, http://
    Distribution of aboveground live biomass in the Amazon basin. Glob. Change Biol.              dx.doi.org/10.1029/2010JD015174 (2011).
    13, 816–837 (2007).                                                                       38. Knox, R., Bisht, G., Wang, J. & Bras, R. L. Precipitation variability over the forest to
    Estimates of regional variation and patterns in forest biomass are presented                  non-forest transition in southwestern Amazonia. J. Clim. 24, 2368–2377 (2011).
    based on a remote sensing approach.                                                       39. Coe, M. T., Costa, M. H. & Soares-Filho, B. S. The Influence of historical and potential
5. Marengo, J. A. Interdecadal variability and trends of rainfall across the Amazon               future deforestation on the stream flow of the Amazon River — land surface
    basin. Theor. Appl. Climatol. 78, 79–96 (2004).                                               processes and atmospheric feedbacks. J. Hydrol. 369, 165–174 (2009).
6. Coe, M. T., Costa, M. H., Botta, A. & Birkett, C. Long-term simulations of discharge       40. Leite, N. K. et al. Intra and interannual variability in the Madeira River water
    and floods in the Amazon basin. J. Geophys. Res. 107, 8044, http://dx.doi.org/                chemistry and sediment load. Biogeochemistry 105, 37–51 (2011).
    10.1029/2001JD000740 (2002).                                                              41. Costa, M. H., Botta, A. & Cardille, J. A. Effects of large-scale changes in land cover on
7. Quesada, C. A. et al. Variations in chemical and physical properties of Amazon                 the discharge of the Tocantins River, Southeastern Amazonia. J. Hydrol. 283,
    forest soils in relation to their genesis. Biogeosciences 7, 1515–1541 (2010).                206–217 (2003).
8. Marengo, J. A., Nobre, C. A., Tomasella, J., Cardosa, M. F. & Oyama, M. D. Hydro-          42. Coe, M. T., Latrubesse, E. M., Ferreira, M. E. & Amsler, M. L. The effects of
    climate and ecological behaviour of the drought of Amazonia in 2005. Phil. Trans.             deforestation and climate variability on the streamflow of the Araguaia River,
    R. Soc. B 363, 1773–1778 (2008).                                                              Brazil. Biogeochemistry 105, 119–131 (2011).
9. Marengo, J. in Tropical Rainforest Responses to Climatic Change (eds Bush, M. B. &         43. Malhi, Y. et al. Exploring the likelihood and mechanism of a climate-change-
    Flenley, J. R.) 236–268 (Springer Praxis Books, 2007).                                        induced dieback of the Amazon rainforest. Proc. Natl Acad. Sci. 106,
10. Nepstad, D. C. et al. The role of deep roots in the hydrological and carbon cycles of         20610–20615 (2009).
    Amazonian forests and pastures. Nature 372, 666–669 (1994).                                   A review of climate model predictions for the Amazon basin.
    First demonstration of the importance of deep rooting for survival of eastern             44. Rammig, A. et al. Estimating the risk of Amazonian forest dieback. New Phytol. 187,
    Amazonian trees.                                                                              694–706 (2010).
11. Oliveira, R. S. et al. Deep root function in soil water dynamics in cerrado savannas of   45. Nobre, C. A. & Simone Borma, L. Tipping points’ for the Amazon forest. Curr. Opin.
    central Brazil. Funct. Ecol. 19, 574–581 (2005).                                              Environ. Sust. 1, 28–36 (2009).

                                                                                                                       1 9 J A N U A RY 2 0 1 2 | VO L 4 8 1 | N AT U R E | 3 2 7
                                                       ©2012 Macmillan Publishers Limited. All rights reserved
RESEARCH REVIEW

                      ´
46. Alencar, A., Solorzano, L. & Nepstad, D. Modeling forest understory fire in an                   carbon loss. J. Geophys. Res. 115, G04005, http://dx.doi.org/10.1029/
    eastern Amazonian landscape. Ecol. Appl. 14, S139–S149 (2004).                                   2009JG001202 (2010).
47. Artaxo, P. et al. Physical and chemical properties of aerosols in the wet and dry            78. Johnson, M. S. et al. CO2 efflux from Amazonian headwater streams represents a
                        ˆ
    season in Rondonia, Amazonia. J. Geophys. Res. 107 (D20), 8081–8095 (2002).                      significant fate for deep soil respiration. Geophys. Res. Lett. 35, L17401, http://
48. Williams, E. et al. Contrasting convective regimes over the Amazon: implications for             dx.doi.org/10.1029/2008GL034619 (2008).
    cloud electrification. J. Geophys. Res. 107 (D20), 8082–8093 (2002).                         79. Gatti, L. V. et al. Vertical profiles of CO2 above eastern Amazonia suggest a net
49. Andreae, M. O. et al. Smoking rain clouds over the Amazon. Science 303,                          carbon flux to the atmosphere and balanced biosphere between 2000 and 2009.
    1337–1342 (2004).                                                                                Tellus B http://dx.doi.org/10.1111/j.1600-0889.2010.00484.x (published
    A review of understanding of how smoke from biomass burning affects local and                    online, 6 July 2010).
    regional climate.                                                                            80. Houghton, R. A., Gloor, M., Lloyd, J. & Potter, C. in Amazonia and Global Change (eds
50. Bevan, S. L., North, P. R. J., Grey, W. M. F., Los, S. O. & Plummer, S. E. Impact of             Keller, M. et al.) 409–428 (American Geophysical Union Books, 2009).
    atmospheric aerosol from biomass burning on Amazon dry-season drought.                           The net effect of carbon loss due to deforestation and carbon accumulation from
    J. Geophys. Res. 114, D09204, http://dx.doi.org/10.1029/2008JD011112 (2009).                     forest regrowth is estimated.
51. Longo, K. M. et al. Correlation between smoke and tropospheric ozone
                                                                                                 81. Bustamante, M. M. C. et al. Estimating greenhouse gas emissions from cattle
                                 ´
    concentration in Cuiaba during SCAR-B. J. Geophys. Res. 104 (D10),
                                                                                                     raising in Brazil. Clim. Change (submitted).
    12113–12129 (1999).
                                                                                                 82. Morton, D. C. et al. Rapid assessment of annual deforestation in the Brazilian
52. Oliveira, P. H. F. et al. The effects of biomass burning aerosols and clouds on the
    CO2 flux in Amazonia. Tellus B 59, 338–349 (2007).                                               Amazon using MODIS data. Earth Interact. 9, 1–22 (2005).
53. Ray, D., Nepstad, D. & Moutinho, P. Micrometeorological and canopy controls of               83. Fearnside, P. M. et al. Biomass and greenhouse-gas emissions from land-use
    flammability in mature and disturbed forests in an east-central Amazon                           change in Brazil’s Amazonian ‘‘arc of deforestation’’: the states of Mato Grosso
    landscape. Ecol. Appl. 15, 1664–1678 (2005).                                                     and Rondonia. For. Ecol. Mgmt 258, 1968–1978 (2009).
54. Alencar, A., Nepstad, D. C. & Vera Diaz, M. d. C. Forest understory fire in the              84. Cerri, C. E. P. et al. Modelling changes in soil organic matter in Amazon forest to
    Brazilian Amazon in ENSO and non-ENSO Years: area burned and committed                           pasture conversion, using the Century model. Glob. Change Biol. 10, 815–832
    carbon emissions. Earth Interact. 10, 6, 1–17 (2006).                                            (2004).
          ˜o,
55. Araga L. E. O. & Shimabukuro, Y. E. The incidence of fire in Amazonian forests with          85. Asner, G. P., Townsend, A. R., Bustamante, M. M. C., Nardoto, G. B. & Olander, L. P.
    implications for REDD. Science 328, 1275–1278 (2010).                                            Pasture degradation in the Central Amazon: linking changes in carbon and
56. Barlow, J. & Peres, C. A. in Emerging Threats to Tropical Forests (eds Laurance, W. F.           nutrient cycling with remote sensing. Glob. Change Biol. 10, 844–862 (2004).
    & Peres, C. A.) 225–240 (Univ. Chicago Press, 2006).                                         86. Neill, C. & Davidson, E. A. in Global Climate Change and Tropical Ecosystems (eds Lal,
57. Balch, J. K. et al. Size, species, and fire characteristics predict tree and liana               R., Kimble, J. M. & Stewart, B. A.) 197–211 (CRC Press, 2000).
    mortality from experimental burns in the Brazilian Amazon. For. Ecol. Mgmt 261,              87. Grace, J., San Jose, J., Meir, P., Miranda, H. S. & Montes, R. A. Productive and carbon
    68–77 (2011).                                                                                    fluxes of tropical savannas. J. Biogeogr. 33, 387–400 (2006).
58. Balch, J. D. et al. Negative fire feedback in a transitional forest of southeastern          88. Santos, A. J. B. et al. High rates of net ecosystem carbon assimilation by Brachiara
    Amazonia. Glob. Change Biol. 14, 2276–2287 (2008).                                               pasture in the Brazilian cerrado. Glob. Change Biol. 10, 877–885 (2004).
59. Nepstad, D. C., Stickler, C. M., Soares-Filho, B. & Merry, F. Interactions among             89. Pan, Y. et al. A large and persistent carbon sink in the world’s forests. Science 333,
    Amazon land use, forests and climate: prospects for a near-term forest tipping                   988–993 (2011).
    point. Phil. Trans. R. Soc. B 363, 1737–1746 (2008).                                         90. Neeff, T., Lucas, R. M., Santos, J. d., Brondizio, E. S. & Freitas, C. C. Area and age of
    Explores the mechanisms of how land use, fire and climate change interact.                       secondary forests in Brazilian Amazonia 1978–2002: an empirical estimate.
60. Zarin, D. J. et al. Legacy of fire slows carbon accumulation in Amazonian forest                 Ecosystems 9, 609–623 (2006).
    regrowth. Front. Ecol. Environ. 3, 365–369 (2005).                                           91. Almeida, A. S. d., Stone, T. A., Vieira, I. C. G. & Davidson, E. A. Non-frontier
61. Davidson, E. A. et al. Recuperation of nitrogen cycling in Amazonian forests                     deforestation in the eastern Amazon. Earth Interact. 14, 1–15 (2010).
    following agricultural abandonment. Nature 447, 995–998 (2007).                                       ˜
                                                                                                 92. Luizao, F., Fearnside, P. M., Cerri, C. E. P. & Lehmann, J. in Amazonia and Global
    Chronosequences of secondary forests were analysed to demonstrate that                           Change (eds Keller, M., Bustamante, M., Gash, J. & Dias, P. S.) 311–336 (American
    nitrogen limitation occurs in young Amazonian forests and then gradually
                                                                                                     Geophysical Union, 2009).
    declines during secondary succession.
                                                                                                 93. Davidson, E. A. et al. An integrated greenhouse gas assessment of an alternative to
62. Melack, J. M. et al. Regionalization of methane emissions in the Amazon basin with
                                                                                                     slash-and-burn agriculture in eastern Amazonia. Glob. Change Biol. 14, 998–1007
    microwave remote sensing. Glob. Change Biol. 10, 530–544 (2004).
                                                                                                     (2008).
63. Miller, J. B. et al. Airborne measurements indicate large methane emissions from
    the eastern Amazon basin. Geophys. Res. Lett. 34, L10809, http://dx.doi.org/                 94. Gurney, K. R. & Eckels, W. J. Regional trends in terrestrial carbon exchange and
    10.1029/2006GL029213 (2007).                                                                     their seasonal signatures. Tellus B 63, 328–339 (2011).
64. do Carmo, J. B., Keller, M., Dias, J. D., de Camargo, P. B. & Crill, P. A source of          95. da Silva, R. R., Werth, R. D. & Avissar, R. Regional impacts of future land-cover
    methane from upland forests in the Brazilian Amazon. Geophys. Res. Lett. 33, 1–4                 changes on the Amazon Basin wet-season climate. J. Clim. 21, 1153–1170 (2008).
    http://dx.doi.org/10.1029/2005GL025436 (2006).                                               96. Silvestrini, R. A. et al. Simulating fire regimes in the Amazon in response to climate
65. Davidson, E. A. & Artaxo, P. Globally significant changes in biological processes of             change and deforestation. Ecol. Appl. 21, 1573–1590 (2011).
    the Amazon Basin: results of the Large-scale Biosphere-Atmosphere Experiment.                97. Nepstad, D. C. et al. Amazon drought and its implications for forest flammability
    Glob. Change Biol. 10, 519–529 (2004).                                                           and tree growth: a basin-wide analysis. Glob. Change Biol. 10, 704–717 (2004).
66. D’Amelio, M. T. S., Gatti, L. V., Miller, J. B. & Tans, P. Regional N2O fluxes in Amazonia   98. Eva, H. D. et al. A land cover map of South America. Glob. Change Biol. 10, 731–744
    derived from aircraft vertical profiles. Atmos. Chem. Phys. 9, 8785–8797 (2009).                 (2004).
67. ter Steege, H. N. et al. Continental-scale patterns of canopy tree composition and           99. Sano, E. E., Rosa, R., Brito, J. L. & Ferreira, L. G. Mapeamento de Cobertura Vegetal do
    function across Amazonia. Nature 443, 444–447 (2006).                                                                       ´
                                                                                                     Bioma Cerrado: Estrategias e Resultados (Embrapa Cerrados, Planaltina, District
68. Telles, E. C. C. et al. Influence of soil texture on carbon dynamics and storage                 Federal, Brazil, 2007).
    potential in tropical forest soils of Amazonia. Glob. Biogeochem. Cycles 17, 1040,           100.Coe, M. T., Costa, M. H. & Howard, E. A. Simulating the surface waters of the Amazon
    http://dx.doi.org/10.1029/2002GB001953 (2003).                                                   River Basin: impacts of new river geomorphic and dynamic flow
69. Fisher, J. I., Hurtt, G. C., Thomas, R. Q. & Chambers, J. Q. Clustered disturbances              parameterizations. Hydrol. Process. 21, 2542–2553 (2007).
    lead to bias in large-scale estimates based on forest sample plots. Ecol. Lett. 11,
    554–563 (2008).                                                                              Acknowledgements We thank the Brazilian Ministry of Science and Technology (MCT),
70. Nemani, R. R. et al. Climate-driven increases in global terrestrial net primary              the National Institute for Space Research (INPE) and the National Institute of
    production from 1982 to 1999. Science 300, 1560–1563 (2003).                                 Amazonian Research (INPA) for designing, leading and managing the LBA project. We
71. Chambers, J. Q. et al. Lack of intermediate-scale disturbance data prevents robust           also thank D. Wickland (NASA) for more than a decade of leadership and support for the
    extrapolation of plot-level tree mortality rates for old-growth tropical forests. Ecol.      LBA-Eco project component of LBA. We thank the LBA-Eco team members who
    Lett. 12, E22–E25 (2009).                                                                    contributed to discussions on an early draft of this manuscript at a workshop in Foz do
72. Gloor, M. et al. Does the disturbance hypothesis explain the biomass increase in             Iguaçu in August 2010, and S. Saleska for comments on the manuscript. We thank
    basin-wide Amazon forest plot data? Glob. Change Biol. 15, 2418–2430 (2009).                 P. Lefebvre and W. Kingerlee for assistance with figure and manuscript preparation.
73. Lloyd, J., Gloor, E. U. & Lewis, S. L. Are the dynamics of tropical forests dominated by     Development of this manuscript was supported by NASA grants NNX08AF63A and
    large and rare disturbance events? Ecol. Lett. 12, E19–E21 (2009).                           NNX11AF20G.
        ´
74. Espırito-Santo, F. D. B. et al. Storm intensity and old growth forest disturbances in
    the Amazon region. Geophys. Res. Lett. 37, L11403, http://dx.doi.org/10.1029/                Author Contributions E.A.D. wrote an initial rough draft and edited the final draft of the
    2010GL043146 (2010).                                                                         paper. M.K. and M.T.C. contributed significant final edits. All of the other co-authors
75. Richey, J. E., Melack, J. M., Aufdenkampe, A. K., Ballester, V. M. & Hess, L. L.             participated in an LBA-Eco team meeting at Foz do Iguaçu on August, 13, 2010, where
    Outgassing from Amazonian rivers and wetlands as a large tropical source of                  this manuscript was designed, and either were co-leaders of breakout groups or made
    atmospheric CO2. Nature 416, 617–620 (2002).                                                 significant subsequent contributions of subsections of text or figures. All co-authors
    Presents first calculations of potential loss of CO2 to the atmosphere from the              also provided edits throughout.
    Amazon River and its main tributaries.
76. Melack, J. M., Novo, E. M. L. M., Forsberg, B. R., Piedade, M. T. F. & Maurice, L. in        Author Information Reprints and permissions information is available at
    Amazonia and Global Change (eds Keller, M. et al.) 525–542 (American Geophysical             www.nature.com/reprints. The authors declare no competing financial interests.
    Union Books, 2009).                                                                          Readers are welcome to comment on the online version of this article at
77. Davidson, E. A., Figueiredo, R. O., Markewitz, D. & Aufdenkampe, A. Dissolved CO2 in         www.nature.com/nature. Correspondence should be addressed to E.A.D.
    small catchment streams of eastern Amazonia: a minor pathway of terrestrial                  (edavidson@whrc.org).

3 2 8 | N AT U R E | VO L 4 8 1 | 1 9 J A N U A RY 2 0 1 2
                                                           ©2012 Macmillan Publishers Limited. All rights reserved

More Related Content

What's hot

GEOG5839.19, Dendroclimatology
GEOG5839.19, DendroclimatologyGEOG5839.19, Dendroclimatology
GEOG5839.19, DendroclimatologyScott St. George
 
GEOG5839.17, Dendroecology
GEOG5839.17, DendroecologyGEOG5839.17, Dendroecology
GEOG5839.17, DendroecologyScott St. George
 
Dr. Richard Taylor - Groundwater-climate interactions: current challenges & n...
Dr. Richard Taylor - Groundwater-climate interactions: current challenges & n...Dr. Richard Taylor - Groundwater-climate interactions: current challenges & n...
Dr. Richard Taylor - Groundwater-climate interactions: current challenges & n...engineerou
 
Building tree-ring chronologies and Program ARSTAN
Building tree-ring chronologies and Program ARSTANBuilding tree-ring chronologies and Program ARSTAN
Building tree-ring chronologies and Program ARSTANScott St. George
 
GEOG5839.13, Sampling strategies
GEOG5839.13, Sampling strategiesGEOG5839.13, Sampling strategies
GEOG5839.13, Sampling strategiesScott St. George
 
Albietz article in Tropical Resources Bulletin_2007
Albietz article in Tropical Resources Bulletin_2007Albietz article in Tropical Resources Bulletin_2007
Albietz article in Tropical Resources Bulletin_2007Jessica Albietz
 
CA and rainfall variability in Zambia: Is CA a promising option for respondin...
CA and rainfall variability in Zambia: Is CA a promising option for respondin...CA and rainfall variability in Zambia: Is CA a promising option for respondin...
CA and rainfall variability in Zambia: Is CA a promising option for respondin...Joanna Hicks
 
GEOG5839.06, The principle of cross dating
GEOG5839.06, The principle of cross datingGEOG5839.06, The principle of cross dating
GEOG5839.06, The principle of cross datingScott St. George
 
Class 1, introduction to dendrochronology
Class 1, introduction to dendrochronologyClass 1, introduction to dendrochronology
Class 1, introduction to dendrochronologyScott St. George
 
GEOG5839.18, Dendrogeomorphology
GEOG5839.18, DendrogeomorphologyGEOG5839.18, Dendrogeomorphology
GEOG5839.18, DendrogeomorphologyScott St. George
 
Report of guanica and yunque
Report of guanica and yunqueReport of guanica and yunque
Report of guanica and yunquecelizbetscolon
 
Open stax biology (nonmajors) ch20
Open stax biology (nonmajors) ch20Open stax biology (nonmajors) ch20
Open stax biology (nonmajors) ch20Lumen Learning
 
Contemporary problems in ancient climates
Contemporary problems in ancient climatesContemporary problems in ancient climates
Contemporary problems in ancient climatesScott St. George
 
Coyote Creek Historical Ecological Study
Coyote Creek Historical Ecological StudyCoyote Creek Historical Ecological Study
Coyote Creek Historical Ecological StudySon Lam
 
Dynamics of Cd, Cu and Pb added to soil through different kinds of sewage sludge
Dynamics of Cd, Cu and Pb added to soil through different kinds of sewage sludgeDynamics of Cd, Cu and Pb added to soil through different kinds of sewage sludge
Dynamics of Cd, Cu and Pb added to soil through different kinds of sewage sludgeSilvana Torri
 
Response of-central-california-oak-woodlands-to-extreme-drought-2157-7617-100...
Response of-central-california-oak-woodlands-to-extreme-drought-2157-7617-100...Response of-central-california-oak-woodlands-to-extreme-drought-2157-7617-100...
Response of-central-california-oak-woodlands-to-extreme-drought-2157-7617-100...science journals
 

What's hot (20)

GEOG5839.19, Dendroclimatology
GEOG5839.19, DendroclimatologyGEOG5839.19, Dendroclimatology
GEOG5839.19, Dendroclimatology
 
Ugum River Project
Ugum River ProjectUgum River Project
Ugum River Project
 
GEOG5839.17, Dendroecology
GEOG5839.17, DendroecologyGEOG5839.17, Dendroecology
GEOG5839.17, Dendroecology
 
Dr. Richard Taylor - Groundwater-climate interactions: current challenges & n...
Dr. Richard Taylor - Groundwater-climate interactions: current challenges & n...Dr. Richard Taylor - Groundwater-climate interactions: current challenges & n...
Dr. Richard Taylor - Groundwater-climate interactions: current challenges & n...
 
Building tree-ring chronologies and Program ARSTAN
Building tree-ring chronologies and Program ARSTANBuilding tree-ring chronologies and Program ARSTAN
Building tree-ring chronologies and Program ARSTAN
 
GEOG5839.13, Sampling strategies
GEOG5839.13, Sampling strategiesGEOG5839.13, Sampling strategies
GEOG5839.13, Sampling strategies
 
Albietz article in Tropical Resources Bulletin_2007
Albietz article in Tropical Resources Bulletin_2007Albietz article in Tropical Resources Bulletin_2007
Albietz article in Tropical Resources Bulletin_2007
 
CA and rainfall variability in Zambia: Is CA a promising option for respondin...
CA and rainfall variability in Zambia: Is CA a promising option for respondin...CA and rainfall variability in Zambia: Is CA a promising option for respondin...
CA and rainfall variability in Zambia: Is CA a promising option for respondin...
 
GEOG5839.06, The principle of cross dating
GEOG5839.06, The principle of cross datingGEOG5839.06, The principle of cross dating
GEOG5839.06, The principle of cross dating
 
Class 1, introduction to dendrochronology
Class 1, introduction to dendrochronologyClass 1, introduction to dendrochronology
Class 1, introduction to dendrochronology
 
GEOG5839.18, Dendrogeomorphology
GEOG5839.18, DendrogeomorphologyGEOG5839.18, Dendrogeomorphology
GEOG5839.18, Dendrogeomorphology
 
Report of guanica and yunque
Report of guanica and yunqueReport of guanica and yunque
Report of guanica and yunque
 
Open stax biology (nonmajors) ch20
Open stax biology (nonmajors) ch20Open stax biology (nonmajors) ch20
Open stax biology (nonmajors) ch20
 
Water2010
Water2010Water2010
Water2010
 
Contemporary problems in ancient climates
Contemporary problems in ancient climatesContemporary problems in ancient climates
Contemporary problems in ancient climates
 
Coyote Creek Historical Ecological Study
Coyote Creek Historical Ecological StudyCoyote Creek Historical Ecological Study
Coyote Creek Historical Ecological Study
 
Lewis Smith Comps Fall 2015
Lewis Smith Comps Fall 2015Lewis Smith Comps Fall 2015
Lewis Smith Comps Fall 2015
 
Dynamics of Cd, Cu and Pb added to soil through different kinds of sewage sludge
Dynamics of Cd, Cu and Pb added to soil through different kinds of sewage sludgeDynamics of Cd, Cu and Pb added to soil through different kinds of sewage sludge
Dynamics of Cd, Cu and Pb added to soil through different kinds of sewage sludge
 
Response of-central-california-oak-woodlands-to-extreme-drought-2157-7617-100...
Response of-central-california-oak-woodlands-to-extreme-drought-2157-7617-100...Response of-central-california-oak-woodlands-to-extreme-drought-2157-7617-100...
Response of-central-california-oak-woodlands-to-extreme-drought-2157-7617-100...
 
Grimaldo_et_al_2004
Grimaldo_et_al_2004Grimaldo_et_al_2004
Grimaldo_et_al_2004
 

Similar to The Amazon basin in transition: impacts of climate variability and human activities

Biospheric recycling of water in Amazon Basin.docx
Biospheric recycling of water in Amazon Basin.docxBiospheric recycling of water in Amazon Basin.docx
Biospheric recycling of water in Amazon Basin.docxFarzanaHaris3
 
Climate change: Changes in the biosphere
Climate change: Changes in the biosphereClimate change: Changes in the biosphere
Climate change: Changes in the biospherecdenef
 
The Amazon We Want: Science Based Pathways for a Sustainable, Inclusive, and ...
The Amazon We Want: Science Based Pathways for a Sustainable, Inclusive, and ...The Amazon We Want: Science Based Pathways for a Sustainable, Inclusive, and ...
The Amazon We Want: Science Based Pathways for a Sustainable, Inclusive, and ...catherine870535
 
Rain forest and golbal warming
Rain forest and golbal warmingRain forest and golbal warming
Rain forest and golbal warmingManjunathBetageri
 
NISAR NASA-ISRO Synthetic Aperture Radar (NISAR) Ecosystems
NISAR NASA-ISRO Synthetic Aperture Radar (NISAR) EcosystemsNISAR NASA-ISRO Synthetic Aperture Radar (NISAR) Ecosystems
NISAR NASA-ISRO Synthetic Aperture Radar (NISAR) EcosystemsDr. Pankaj Dhussa
 
Silvopastoral systems d_casaubon et al_peri et al eds_aaf 2016
Silvopastoral systems d_casaubon et al_peri et al eds_aaf 2016Silvopastoral systems d_casaubon et al_peri et al eds_aaf 2016
Silvopastoral systems d_casaubon et al_peri et al eds_aaf 2016DanielSomma
 
2011 grl xu_samanta_etal_main_r_final
2011 grl xu_samanta_etal_main_r_final2011 grl xu_samanta_etal_main_r_final
2011 grl xu_samanta_etal_main_r_finalSérgio Sacani
 
Amazon Rainforest wildfires Introduction
Amazon Rainforest wildfires IntroductionAmazon Rainforest wildfires Introduction
Amazon Rainforest wildfires IntroductionMANOJ DASI
 
Spatial–temporal changes in andean plateau climate and elevation from stable ...
Spatial–temporal changes in andean plateau climate and elevation from stable ...Spatial–temporal changes in andean plateau climate and elevation from stable ...
Spatial–temporal changes in andean plateau climate and elevation from stable ...herculanoalvarenga
 
Wildlife in a Warming World: Confronting the Climate Crisis
Wildlife in a Warming World: Confronting the Climate CrisisWildlife in a Warming World: Confronting the Climate Crisis
Wildlife in a Warming World: Confronting the Climate CrisisNational Wildlife Federation
 
Tropical rain forest extent and characteristics
Tropical rain forest extent and characteristicsTropical rain forest extent and characteristics
Tropical rain forest extent and characteristicsSenjutiSaha1
 
Rainwater Catchment and Sustainable Development in the Brazilian
Rainwater Catchment and Sustainable Development in the BrazilianRainwater Catchment and Sustainable Development in the Brazilian
Rainwater Catchment and Sustainable Development in the BrazilianD4Z
 
WOODY PLANT RICHNESS AND NDVI RESPONSE TO DROUGHT EVENTS IN CATALONIAN (NORT...
WOODY PLANT RICHNESS AND NDVI RESPONSE TO DROUGHT EVENTS  IN CATALONIAN (NORT...WOODY PLANT RICHNESS AND NDVI RESPONSE TO DROUGHT EVENTS  IN CATALONIAN (NORT...
WOODY PLANT RICHNESS AND NDVI RESPONSE TO DROUGHT EVENTS IN CATALONIAN (NORT...Hibrids
 
Ecology of the east african lakes for unfccc adaptation
Ecology of the east african lakes for unfccc adaptationEcology of the east african lakes for unfccc adaptation
Ecology of the east african lakes for unfccc adaptationNAP Events
 
Flood control by plants
Flood control by plants Flood control by plants
Flood control by plants Khalid Hakeem
 
Duncan &amp; Garfin 2006
Duncan &amp; Garfin 2006Duncan &amp; Garfin 2006
Duncan &amp; Garfin 2006fldhcky
 
India; Rainwater Harvesting as an Adaptation to Global Warming
India;  Rainwater Harvesting as an Adaptation to Global WarmingIndia;  Rainwater Harvesting as an Adaptation to Global Warming
India; Rainwater Harvesting as an Adaptation to Global WarmingD5Z
 
Flood, Flow and Flux: Climate variability and effects of the Kafue River regu...
Flood, Flow and Flux: Climate variability and effects of the Kafue River regu...Flood, Flow and Flux: Climate variability and effects of the Kafue River regu...
Flood, Flow and Flux: Climate variability and effects of the Kafue River regu...Premier Publishers
 

Similar to The Amazon basin in transition: impacts of climate variability and human activities (20)

Biospheric recycling of water in Amazon Basin.docx
Biospheric recycling of water in Amazon Basin.docxBiospheric recycling of water in Amazon Basin.docx
Biospheric recycling of water in Amazon Basin.docx
 
Climate change: Changes in the biosphere
Climate change: Changes in the biosphereClimate change: Changes in the biosphere
Climate change: Changes in the biosphere
 
The Amazon We Want: Science Based Pathways for a Sustainable, Inclusive, and ...
The Amazon We Want: Science Based Pathways for a Sustainable, Inclusive, and ...The Amazon We Want: Science Based Pathways for a Sustainable, Inclusive, and ...
The Amazon We Want: Science Based Pathways for a Sustainable, Inclusive, and ...
 
Rain forest and golbal warming
Rain forest and golbal warmingRain forest and golbal warming
Rain forest and golbal warming
 
NISAR NASA-ISRO Synthetic Aperture Radar (NISAR) Ecosystems
NISAR NASA-ISRO Synthetic Aperture Radar (NISAR) EcosystemsNISAR NASA-ISRO Synthetic Aperture Radar (NISAR) Ecosystems
NISAR NASA-ISRO Synthetic Aperture Radar (NISAR) Ecosystems
 
Silvopastoral systems d_casaubon et al_peri et al eds_aaf 2016
Silvopastoral systems d_casaubon et al_peri et al eds_aaf 2016Silvopastoral systems d_casaubon et al_peri et al eds_aaf 2016
Silvopastoral systems d_casaubon et al_peri et al eds_aaf 2016
 
2011 grl xu_samanta_etal_main_r_final
2011 grl xu_samanta_etal_main_r_final2011 grl xu_samanta_etal_main_r_final
2011 grl xu_samanta_etal_main_r_final
 
Amazon Rainforest wildfires Introduction
Amazon Rainforest wildfires IntroductionAmazon Rainforest wildfires Introduction
Amazon Rainforest wildfires Introduction
 
Spatial–temporal changes in andean plateau climate and elevation from stable ...
Spatial–temporal changes in andean plateau climate and elevation from stable ...Spatial–temporal changes in andean plateau climate and elevation from stable ...
Spatial–temporal changes in andean plateau climate and elevation from stable ...
 
Wildlife in a Warming World: Confronting the Climate Crisis
Wildlife in a Warming World: Confronting the Climate CrisisWildlife in a Warming World: Confronting the Climate Crisis
Wildlife in a Warming World: Confronting the Climate Crisis
 
Tropical rain forest extent and characteristics
Tropical rain forest extent and characteristicsTropical rain forest extent and characteristics
Tropical rain forest extent and characteristics
 
Rainwater Catchment and Sustainable Development in the Brazilian
Rainwater Catchment and Sustainable Development in the BrazilianRainwater Catchment and Sustainable Development in the Brazilian
Rainwater Catchment and Sustainable Development in the Brazilian
 
WOODY PLANT RICHNESS AND NDVI RESPONSE TO DROUGHT EVENTS IN CATALONIAN (NORT...
WOODY PLANT RICHNESS AND NDVI RESPONSE TO DROUGHT EVENTS  IN CATALONIAN (NORT...WOODY PLANT RICHNESS AND NDVI RESPONSE TO DROUGHT EVENTS  IN CATALONIAN (NORT...
WOODY PLANT RICHNESS AND NDVI RESPONSE TO DROUGHT EVENTS IN CATALONIAN (NORT...
 
Ecology of the east african lakes for unfccc adaptation
Ecology of the east african lakes for unfccc adaptationEcology of the east african lakes for unfccc adaptation
Ecology of the east african lakes for unfccc adaptation
 
Flood control by plants
Flood control by plants Flood control by plants
Flood control by plants
 
Duncan &amp; Garfin 2006
Duncan &amp; Garfin 2006Duncan &amp; Garfin 2006
Duncan &amp; Garfin 2006
 
2019-05-02 - Peter Bacon & Tapas Biswas - Quantifying the benefits of wetland...
2019-05-02 - Peter Bacon & Tapas Biswas - Quantifying the benefits of wetland...2019-05-02 - Peter Bacon & Tapas Biswas - Quantifying the benefits of wetland...
2019-05-02 - Peter Bacon & Tapas Biswas - Quantifying the benefits of wetland...
 
India; Rainwater Harvesting as an Adaptation to Global Warming
India;  Rainwater Harvesting as an Adaptation to Global WarmingIndia;  Rainwater Harvesting as an Adaptation to Global Warming
India; Rainwater Harvesting as an Adaptation to Global Warming
 
Flood, Flow and Flux: Climate variability and effects of the Kafue River regu...
Flood, Flow and Flux: Climate variability and effects of the Kafue River regu...Flood, Flow and Flux: Climate variability and effects of the Kafue River regu...
Flood, Flow and Flux: Climate variability and effects of the Kafue River regu...
 
2009 araujo
2009 araujo2009 araujo
2009 araujo
 

More from Sérgio Sacani

Formation of low mass protostars and their circumstellar disks
Formation of low mass protostars and their circumstellar disksFormation of low mass protostars and their circumstellar disks
Formation of low mass protostars and their circumstellar disksSérgio Sacani
 
Nightside clouds and disequilibrium chemistry on the hot Jupiter WASP-43b
Nightside clouds and disequilibrium chemistry on the hot Jupiter WASP-43bNightside clouds and disequilibrium chemistry on the hot Jupiter WASP-43b
Nightside clouds and disequilibrium chemistry on the hot Jupiter WASP-43bSérgio Sacani
 
Discovery of an Accretion Streamer and a Slow Wide-angle Outflow around FUOri...
Discovery of an Accretion Streamer and a Slow Wide-angle Outflow around FUOri...Discovery of an Accretion Streamer and a Slow Wide-angle Outflow around FUOri...
Discovery of an Accretion Streamer and a Slow Wide-angle Outflow around FUOri...Sérgio Sacani
 
Disentangling the origin of chemical differences using GHOST
Disentangling the origin of chemical differences using GHOSTDisentangling the origin of chemical differences using GHOST
Disentangling the origin of chemical differences using GHOSTSérgio Sacani
 
All-domain Anomaly Resolution Office U.S. Department of Defense (U) Case: “Eg...
All-domain Anomaly Resolution Office U.S. Department of Defense (U) Case: “Eg...All-domain Anomaly Resolution Office U.S. Department of Defense (U) Case: “Eg...
All-domain Anomaly Resolution Office U.S. Department of Defense (U) Case: “Eg...Sérgio Sacani
 
PossibleEoarcheanRecordsoftheGeomagneticFieldPreservedintheIsuaSupracrustalBe...
PossibleEoarcheanRecordsoftheGeomagneticFieldPreservedintheIsuaSupracrustalBe...PossibleEoarcheanRecordsoftheGeomagneticFieldPreservedintheIsuaSupracrustalBe...
PossibleEoarcheanRecordsoftheGeomagneticFieldPreservedintheIsuaSupracrustalBe...Sérgio Sacani
 
Isotopic evidence of long-lived volcanism on Io
Isotopic evidence of long-lived volcanism on IoIsotopic evidence of long-lived volcanism on Io
Isotopic evidence of long-lived volcanism on IoSérgio Sacani
 
Hubble Asteroid Hunter III. Physical properties of newly found asteroids
Hubble Asteroid Hunter III. Physical properties of newly found asteroidsHubble Asteroid Hunter III. Physical properties of newly found asteroids
Hubble Asteroid Hunter III. Physical properties of newly found asteroidsSérgio Sacani
 
Observational constraints on mergers creating magnetism in massive stars
Observational constraints on mergers creating magnetism in massive starsObservational constraints on mergers creating magnetism in massive stars
Observational constraints on mergers creating magnetism in massive starsSérgio Sacani
 
Observation of Gravitational Waves from the Coalescence of a 2.5–4.5 M⊙ Compa...
Observation of Gravitational Waves from the Coalescence of a 2.5–4.5 M⊙ Compa...Observation of Gravitational Waves from the Coalescence of a 2.5–4.5 M⊙ Compa...
Observation of Gravitational Waves from the Coalescence of a 2.5–4.5 M⊙ Compa...Sérgio Sacani
 
The SAMI Galaxy Sur v ey: galaxy spin is more strongly correlated with stella...
The SAMI Galaxy Sur v ey: galaxy spin is more strongly correlated with stella...The SAMI Galaxy Sur v ey: galaxy spin is more strongly correlated with stella...
The SAMI Galaxy Sur v ey: galaxy spin is more strongly correlated with stella...Sérgio Sacani
 
Is Betelgeuse Really Rotating? Synthetic ALMA Observations of Large-scale Con...
Is Betelgeuse Really Rotating? Synthetic ALMA Observations of Large-scale Con...Is Betelgeuse Really Rotating? Synthetic ALMA Observations of Large-scale Con...
Is Betelgeuse Really Rotating? Synthetic ALMA Observations of Large-scale Con...Sérgio Sacani
 
First Direct Imaging of a Kelvin–Helmholtz Instability by PSP/WISPR
First Direct Imaging of a Kelvin–Helmholtz Instability by PSP/WISPRFirst Direct Imaging of a Kelvin–Helmholtz Instability by PSP/WISPR
First Direct Imaging of a Kelvin–Helmholtz Instability by PSP/WISPRSérgio Sacani
 
The Sun’s differential rotation is controlled by high- latitude baroclinicall...
The Sun’s differential rotation is controlled by high- latitude baroclinicall...The Sun’s differential rotation is controlled by high- latitude baroclinicall...
The Sun’s differential rotation is controlled by high- latitude baroclinicall...Sérgio Sacani
 
Hydrogen Column Density Variability in a Sample of Local Compton-Thin AGN
Hydrogen Column Density Variability in a Sample of Local Compton-Thin AGNHydrogen Column Density Variability in a Sample of Local Compton-Thin AGN
Hydrogen Column Density Variability in a Sample of Local Compton-Thin AGNSérgio Sacani
 
Huygens - Exploring Titan A Mysterious World
Huygens - Exploring Titan A Mysterious WorldHuygens - Exploring Titan A Mysterious World
Huygens - Exploring Titan A Mysterious WorldSérgio Sacani
 
The Radcliffe Wave Of Milk Way is oscillating
The Radcliffe Wave Of Milk Way  is oscillatingThe Radcliffe Wave Of Milk Way  is oscillating
The Radcliffe Wave Of Milk Way is oscillatingSérgio Sacani
 
Thermonuclear explosions on neutron stars reveal the speed of their jets
Thermonuclear explosions on neutron stars reveal the speed of their jetsThermonuclear explosions on neutron stars reveal the speed of their jets
Thermonuclear explosions on neutron stars reveal the speed of their jetsSérgio Sacani
 
Identification of Superclusters and Their Properties in the Sloan Digital Sky...
Identification of Superclusters and Their Properties in the Sloan Digital Sky...Identification of Superclusters and Their Properties in the Sloan Digital Sky...
Identification of Superclusters and Their Properties in the Sloan Digital Sky...Sérgio Sacani
 
Digitized Continuous Magnetic Recordings for the August/September 1859 Storms...
Digitized Continuous Magnetic Recordings for the August/September 1859 Storms...Digitized Continuous Magnetic Recordings for the August/September 1859 Storms...
Digitized Continuous Magnetic Recordings for the August/September 1859 Storms...Sérgio Sacani
 

More from Sérgio Sacani (20)

Formation of low mass protostars and their circumstellar disks
Formation of low mass protostars and their circumstellar disksFormation of low mass protostars and their circumstellar disks
Formation of low mass protostars and their circumstellar disks
 
Nightside clouds and disequilibrium chemistry on the hot Jupiter WASP-43b
Nightside clouds and disequilibrium chemistry on the hot Jupiter WASP-43bNightside clouds and disequilibrium chemistry on the hot Jupiter WASP-43b
Nightside clouds and disequilibrium chemistry on the hot Jupiter WASP-43b
 
Discovery of an Accretion Streamer and a Slow Wide-angle Outflow around FUOri...
Discovery of an Accretion Streamer and a Slow Wide-angle Outflow around FUOri...Discovery of an Accretion Streamer and a Slow Wide-angle Outflow around FUOri...
Discovery of an Accretion Streamer and a Slow Wide-angle Outflow around FUOri...
 
Disentangling the origin of chemical differences using GHOST
Disentangling the origin of chemical differences using GHOSTDisentangling the origin of chemical differences using GHOST
Disentangling the origin of chemical differences using GHOST
 
All-domain Anomaly Resolution Office U.S. Department of Defense (U) Case: “Eg...
All-domain Anomaly Resolution Office U.S. Department of Defense (U) Case: “Eg...All-domain Anomaly Resolution Office U.S. Department of Defense (U) Case: “Eg...
All-domain Anomaly Resolution Office U.S. Department of Defense (U) Case: “Eg...
 
PossibleEoarcheanRecordsoftheGeomagneticFieldPreservedintheIsuaSupracrustalBe...
PossibleEoarcheanRecordsoftheGeomagneticFieldPreservedintheIsuaSupracrustalBe...PossibleEoarcheanRecordsoftheGeomagneticFieldPreservedintheIsuaSupracrustalBe...
PossibleEoarcheanRecordsoftheGeomagneticFieldPreservedintheIsuaSupracrustalBe...
 
Isotopic evidence of long-lived volcanism on Io
Isotopic evidence of long-lived volcanism on IoIsotopic evidence of long-lived volcanism on Io
Isotopic evidence of long-lived volcanism on Io
 
Hubble Asteroid Hunter III. Physical properties of newly found asteroids
Hubble Asteroid Hunter III. Physical properties of newly found asteroidsHubble Asteroid Hunter III. Physical properties of newly found asteroids
Hubble Asteroid Hunter III. Physical properties of newly found asteroids
 
Observational constraints on mergers creating magnetism in massive stars
Observational constraints on mergers creating magnetism in massive starsObservational constraints on mergers creating magnetism in massive stars
Observational constraints on mergers creating magnetism in massive stars
 
Observation of Gravitational Waves from the Coalescence of a 2.5–4.5 M⊙ Compa...
Observation of Gravitational Waves from the Coalescence of a 2.5–4.5 M⊙ Compa...Observation of Gravitational Waves from the Coalescence of a 2.5–4.5 M⊙ Compa...
Observation of Gravitational Waves from the Coalescence of a 2.5–4.5 M⊙ Compa...
 
The SAMI Galaxy Sur v ey: galaxy spin is more strongly correlated with stella...
The SAMI Galaxy Sur v ey: galaxy spin is more strongly correlated with stella...The SAMI Galaxy Sur v ey: galaxy spin is more strongly correlated with stella...
The SAMI Galaxy Sur v ey: galaxy spin is more strongly correlated with stella...
 
Is Betelgeuse Really Rotating? Synthetic ALMA Observations of Large-scale Con...
Is Betelgeuse Really Rotating? Synthetic ALMA Observations of Large-scale Con...Is Betelgeuse Really Rotating? Synthetic ALMA Observations of Large-scale Con...
Is Betelgeuse Really Rotating? Synthetic ALMA Observations of Large-scale Con...
 
First Direct Imaging of a Kelvin–Helmholtz Instability by PSP/WISPR
First Direct Imaging of a Kelvin–Helmholtz Instability by PSP/WISPRFirst Direct Imaging of a Kelvin–Helmholtz Instability by PSP/WISPR
First Direct Imaging of a Kelvin–Helmholtz Instability by PSP/WISPR
 
The Sun’s differential rotation is controlled by high- latitude baroclinicall...
The Sun’s differential rotation is controlled by high- latitude baroclinicall...The Sun’s differential rotation is controlled by high- latitude baroclinicall...
The Sun’s differential rotation is controlled by high- latitude baroclinicall...
 
Hydrogen Column Density Variability in a Sample of Local Compton-Thin AGN
Hydrogen Column Density Variability in a Sample of Local Compton-Thin AGNHydrogen Column Density Variability in a Sample of Local Compton-Thin AGN
Hydrogen Column Density Variability in a Sample of Local Compton-Thin AGN
 
Huygens - Exploring Titan A Mysterious World
Huygens - Exploring Titan A Mysterious WorldHuygens - Exploring Titan A Mysterious World
Huygens - Exploring Titan A Mysterious World
 
The Radcliffe Wave Of Milk Way is oscillating
The Radcliffe Wave Of Milk Way  is oscillatingThe Radcliffe Wave Of Milk Way  is oscillating
The Radcliffe Wave Of Milk Way is oscillating
 
Thermonuclear explosions on neutron stars reveal the speed of their jets
Thermonuclear explosions on neutron stars reveal the speed of their jetsThermonuclear explosions on neutron stars reveal the speed of their jets
Thermonuclear explosions on neutron stars reveal the speed of their jets
 
Identification of Superclusters and Their Properties in the Sloan Digital Sky...
Identification of Superclusters and Their Properties in the Sloan Digital Sky...Identification of Superclusters and Their Properties in the Sloan Digital Sky...
Identification of Superclusters and Their Properties in the Sloan Digital Sky...
 
Digitized Continuous Magnetic Recordings for the August/September 1859 Storms...
Digitized Continuous Magnetic Recordings for the August/September 1859 Storms...Digitized Continuous Magnetic Recordings for the August/September 1859 Storms...
Digitized Continuous Magnetic Recordings for the August/September 1859 Storms...
 

Recently uploaded

08448380779 Call Girls In Chhattarpur Women Seeking Men
08448380779 Call Girls In Chhattarpur Women Seeking Men08448380779 Call Girls In Chhattarpur Women Seeking Men
08448380779 Call Girls In Chhattarpur Women Seeking MenDelhi Call girls
 
Night 7k Call Girls Noida Sector 93 Escorts Call Me: 8448380779
Night 7k Call Girls Noida Sector 93 Escorts Call Me: 8448380779Night 7k Call Girls Noida Sector 93 Escorts Call Me: 8448380779
Night 7k Call Girls Noida Sector 93 Escorts Call Me: 8448380779Delhi Call girls
 
Exploring Sicily Your Comprehensive Ebook Travel Guide
Exploring Sicily Your Comprehensive Ebook Travel GuideExploring Sicily Your Comprehensive Ebook Travel Guide
Exploring Sicily Your Comprehensive Ebook Travel GuideTime for Sicily
 
char Dham yatra, Uttarakhand tourism.pptx
char Dham yatra, Uttarakhand tourism.pptxchar Dham yatra, Uttarakhand tourism.pptx
char Dham yatra, Uttarakhand tourism.pptxpalakdigital7
 
Visa Consultant in Lahore || 📞03094429236
Visa Consultant in Lahore || 📞03094429236Visa Consultant in Lahore || 📞03094429236
Visa Consultant in Lahore || 📞03094429236Sherazi Tours
 
Moving to Italy - A Relocation Rollercoaster
Moving to Italy - A Relocation RollercoasterMoving to Italy - A Relocation Rollercoaster
Moving to Italy - A Relocation RollercoasterStefSmulders1
 
BERMUDA Triangle the mystery of life.pptx
BERMUDA Triangle the mystery of life.pptxBERMUDA Triangle the mystery of life.pptx
BERMUDA Triangle the mystery of life.pptxseribangash
 
Study Consultants in Lahore || 📞03094429236
Study Consultants in Lahore || 📞03094429236Study Consultants in Lahore || 📞03094429236
Study Consultants in Lahore || 📞03094429236Sherazi Tours
 
Top 10 Traditional Indian Handicrafts.pptx
Top 10 Traditional Indian Handicrafts.pptxTop 10 Traditional Indian Handicrafts.pptx
Top 10 Traditional Indian Handicrafts.pptxdishha99
 
08448380779 Call Girls In Shahdara Women Seeking Men
08448380779 Call Girls In Shahdara Women Seeking Men08448380779 Call Girls In Shahdara Women Seeking Men
08448380779 Call Girls In Shahdara Women Seeking MenDelhi Call girls
 
best weekend places near delhi where you should visit.pdf
best weekend places near delhi where you should visit.pdfbest weekend places near delhi where you should visit.pdf
best weekend places near delhi where you should visit.pdftour guide
 
Hoi An Ancient Town, Vietnam (越南 會安古鎮).ppsx
Hoi An Ancient Town, Vietnam (越南 會安古鎮).ppsxHoi An Ancient Town, Vietnam (越南 會安古鎮).ppsx
Hoi An Ancient Town, Vietnam (越南 會安古鎮).ppsxChung Yen Chang
 
visa consultant | 📞📞 03094429236 || Best Study Visa Consultant
visa consultant | 📞📞 03094429236 || Best Study Visa Consultantvisa consultant | 📞📞 03094429236 || Best Study Visa Consultant
visa consultant | 📞📞 03094429236 || Best Study Visa ConsultantSherazi Tours
 
9 Days Kenya Ultimate Safari Odyssey with Kibera Holiday Safaris
9 Days Kenya Ultimate Safari Odyssey with Kibera Holiday Safaris9 Days Kenya Ultimate Safari Odyssey with Kibera Holiday Safaris
9 Days Kenya Ultimate Safari Odyssey with Kibera Holiday SafarisKibera Holiday Safaris Safaris
 
How to Get Unpublished Flight Deals and Discounts?
How to Get Unpublished Flight Deals and Discounts?How to Get Unpublished Flight Deals and Discounts?
How to Get Unpublished Flight Deals and Discounts?FlyFairTravels
 
"Fly with Ease: Booking Your Flights with Air Europa"
"Fly with Ease: Booking Your Flights with Air Europa""Fly with Ease: Booking Your Flights with Air Europa"
"Fly with Ease: Booking Your Flights with Air Europa"flyn goo
 
08448380779 Call Girls In Chirag Enclave Women Seeking Men
08448380779 Call Girls In Chirag Enclave Women Seeking Men08448380779 Call Girls In Chirag Enclave Women Seeking Men
08448380779 Call Girls In Chirag Enclave Women Seeking MenDelhi Call girls
 

Recently uploaded (20)

08448380779 Call Girls In Chhattarpur Women Seeking Men
08448380779 Call Girls In Chhattarpur Women Seeking Men08448380779 Call Girls In Chhattarpur Women Seeking Men
08448380779 Call Girls In Chhattarpur Women Seeking Men
 
Night 7k Call Girls Noida Sector 93 Escorts Call Me: 8448380779
Night 7k Call Girls Noida Sector 93 Escorts Call Me: 8448380779Night 7k Call Girls Noida Sector 93 Escorts Call Me: 8448380779
Night 7k Call Girls Noida Sector 93 Escorts Call Me: 8448380779
 
Exploring Sicily Your Comprehensive Ebook Travel Guide
Exploring Sicily Your Comprehensive Ebook Travel GuideExploring Sicily Your Comprehensive Ebook Travel Guide
Exploring Sicily Your Comprehensive Ebook Travel Guide
 
char Dham yatra, Uttarakhand tourism.pptx
char Dham yatra, Uttarakhand tourism.pptxchar Dham yatra, Uttarakhand tourism.pptx
char Dham yatra, Uttarakhand tourism.pptx
 
Call Girls In Munirka 📱 9999965857 🤩 Delhi 🫦 HOT AND SEXY VVIP 🍎 SERVICE
Call Girls In Munirka 📱  9999965857  🤩 Delhi 🫦 HOT AND SEXY VVIP 🍎 SERVICECall Girls In Munirka 📱  9999965857  🤩 Delhi 🫦 HOT AND SEXY VVIP 🍎 SERVICE
Call Girls In Munirka 📱 9999965857 🤩 Delhi 🫦 HOT AND SEXY VVIP 🍎 SERVICE
 
Visa Consultant in Lahore || 📞03094429236
Visa Consultant in Lahore || 📞03094429236Visa Consultant in Lahore || 📞03094429236
Visa Consultant in Lahore || 📞03094429236
 
Moving to Italy - A Relocation Rollercoaster
Moving to Italy - A Relocation RollercoasterMoving to Italy - A Relocation Rollercoaster
Moving to Italy - A Relocation Rollercoaster
 
BERMUDA Triangle the mystery of life.pptx
BERMUDA Triangle the mystery of life.pptxBERMUDA Triangle the mystery of life.pptx
BERMUDA Triangle the mystery of life.pptx
 
Study Consultants in Lahore || 📞03094429236
Study Consultants in Lahore || 📞03094429236Study Consultants in Lahore || 📞03094429236
Study Consultants in Lahore || 📞03094429236
 
Top 10 Traditional Indian Handicrafts.pptx
Top 10 Traditional Indian Handicrafts.pptxTop 10 Traditional Indian Handicrafts.pptx
Top 10 Traditional Indian Handicrafts.pptx
 
08448380779 Call Girls In Shahdara Women Seeking Men
08448380779 Call Girls In Shahdara Women Seeking Men08448380779 Call Girls In Shahdara Women Seeking Men
08448380779 Call Girls In Shahdara Women Seeking Men
 
best weekend places near delhi where you should visit.pdf
best weekend places near delhi where you should visit.pdfbest weekend places near delhi where you should visit.pdf
best weekend places near delhi where you should visit.pdf
 
Rohini Sector 18 Call Girls Delhi 9999965857 @Sabina Saikh No Advance
Rohini Sector 18 Call Girls Delhi 9999965857 @Sabina Saikh No AdvanceRohini Sector 18 Call Girls Delhi 9999965857 @Sabina Saikh No Advance
Rohini Sector 18 Call Girls Delhi 9999965857 @Sabina Saikh No Advance
 
Hoi An Ancient Town, Vietnam (越南 會安古鎮).ppsx
Hoi An Ancient Town, Vietnam (越南 會安古鎮).ppsxHoi An Ancient Town, Vietnam (越南 會安古鎮).ppsx
Hoi An Ancient Town, Vietnam (越南 會安古鎮).ppsx
 
visa consultant | 📞📞 03094429236 || Best Study Visa Consultant
visa consultant | 📞📞 03094429236 || Best Study Visa Consultantvisa consultant | 📞📞 03094429236 || Best Study Visa Consultant
visa consultant | 📞📞 03094429236 || Best Study Visa Consultant
 
Call Girls Service !! Indirapuram!! @9999965857 Delhi 🫦 No Advance VVVIP 🍎 S...
Call Girls Service !! Indirapuram!! @9999965857 Delhi 🫦 No Advance  VVVIP 🍎 S...Call Girls Service !! Indirapuram!! @9999965857 Delhi 🫦 No Advance  VVVIP 🍎 S...
Call Girls Service !! Indirapuram!! @9999965857 Delhi 🫦 No Advance VVVIP 🍎 S...
 
9 Days Kenya Ultimate Safari Odyssey with Kibera Holiday Safaris
9 Days Kenya Ultimate Safari Odyssey with Kibera Holiday Safaris9 Days Kenya Ultimate Safari Odyssey with Kibera Holiday Safaris
9 Days Kenya Ultimate Safari Odyssey with Kibera Holiday Safaris
 
How to Get Unpublished Flight Deals and Discounts?
How to Get Unpublished Flight Deals and Discounts?How to Get Unpublished Flight Deals and Discounts?
How to Get Unpublished Flight Deals and Discounts?
 
"Fly with Ease: Booking Your Flights with Air Europa"
"Fly with Ease: Booking Your Flights with Air Europa""Fly with Ease: Booking Your Flights with Air Europa"
"Fly with Ease: Booking Your Flights with Air Europa"
 
08448380779 Call Girls In Chirag Enclave Women Seeking Men
08448380779 Call Girls In Chirag Enclave Women Seeking Men08448380779 Call Girls In Chirag Enclave Women Seeking Men
08448380779 Call Girls In Chirag Enclave Women Seeking Men
 

The Amazon basin in transition: impacts of climate variability and human activities

  • 1. REVIEW doi:10.1038/nature10717 The Amazon basin in transition Eric A. Davidson1, Alessandro C. de Arau 2,3, Paulo Artaxo4, Jennifer K. Balch1,5, I. Foster Brown1,6, Mercedes M. C. Bustamante7, ´jo Michael T. Coe1, Ruth S. DeFries8, Michael Keller9,10, Marcos Longo11, J. William Munger11, Wilfrid Schroeder12, Britaldo S. Soares-Filho13, Carlos M. Souza Jr14 & Steven C. Wofsy11 Agricultural expansion and climate variability have become important agents of disturbance in the Amazon basin. Recent studies have demonstrated considerable resilience of Amazonian forests to moderate annual drought, but they also show that interactions between deforestation, fire and drought potentially lead to losses of carbon storage and changes in regional precipitation patterns and river discharge. Although the basin-wide impacts of land use and drought may not yet surpass the magnitude of natural variability of hydrologic and biogeochemical cycles, there are some signs of a transition to a disturbance-dominated regime. These signs include changing energy and water cycles in the southern and eastern portions of the Amazon basin. umans have been part of the vast forest–river system of the northwest to the wet/dry climate and long dry season of the southern H Amazon basin for many thousands of years, but expansion and intensification of agriculture, logging and urban footprints during the past few decades have been unprecedented. The human and eastern regions, including the Cerrado (woodland/savannah) in the southeast. This climatic gradient is largely coincident with a gradient in land-use change, with more conversion to agriculture in the drier eastern population of the Brazilian Amazon region increased from 6 million and southern regions, indicating the interconnectedness of biophysical in 1960 to 25 million in 2010, and the forest cover for this region has and socio-economic processes. declined to about 80% of its original area1. Efforts to curb deforestation ˜ The El Nino/Southern Oscillation (ENSO) profoundly affects rainfall have led to a steep decline in forest clearing in the Brazilian Amazon, in the Amazon basin5, especially the eastern portion; there is decreased from nearly 28,000 km2 yr21 in 2004 to less than 7,000 km2 yr21 in flow of the Amazon River and some of its major tributaries during El 20111. However, this progress remains fragile. The river system ˜ Nino years, and increased flow and increased flooding during La Nina ˜ produces about 20% of the world’s freshwater discharge2, and the forest years6. The ENSO effect is superimposed over a 28-year cycle of vari- biomass holds about 100 billion tonnes of carbon (C; refs 3, 4), which is ation in precipitation5,6 such that the biggest floods occur when La Nina ˜ equivalent to more than 10 years’ worth of global fossil-fuel emissions. coincides with the wet phase in the 28-year cycle; this coincidence last Maintaining the biotic integrity of the biome and the ecosystem services it occurred in the mid-1970s (Fig. 3). The worst droughts occur when El provides to local, regional and global communities will require improved ˜ Nino coincides with the dry phase of the longer-term cycle, such as the understanding of the vulnerability and resilience of Amazonian eco- 1992 drought. The North Atlantic Oscillation (NAO) also affects the systems in the face of change. region, contributing to, for example, the 2005 drought, which resulted in Here we provide a framework for understanding the linkages between the lowest river levels recorded until then in southern and western natural variability, drivers of change, responses and feedbacks in the tributaries8. Although much has been learned about extreme events Amazon basin (Fig. 1). Although the basin-wide carbon balance remains and decadal-scale cycles, no discernable long-term trend has yet been uncertain, evidence is emerging for a directional change from a possible identified in the total discharge of the Amazon River9. sink towards a possible source. Where deforestation is widespread at local and regional scales, the dry season duration is lengthening and wet Forests are resistant to seasonal droughts season discharge is increasing. We show that the forest is resilient to The ability of roots to access deep soil water10 and to redistribute it11 considerable natural climatic variation, but global and regional climate helps to maintain evergreen canopies during dry seasons, demonstrating change forcings interact with land-use change, logging and fire in com- the adaptation of Amazon forest species to seasonal drought. The com- plex ways, generally leading to forest ecosystems that are increasingly bination of access to deep soil water and less cloudiness permits con- vulnerable to degradation. tinued plant photosynthesis throughout most of the dry season12. However, transitional forests and Cerrado ecosystems, where mean Natural and anthropogenic climatic variation annual precipitation is less than 1,700 mm and the dry season lasts for Changes in Amazonian ecosystems must be viewed in the context of the $4 months, show clear evidence of dry season declines in evapotran- natural variation in climate5,6 and soils7 across the region, as well as spiration and therefore potential water stress13. Many tree species in the natural cycles of climatic variation and extreme events. A climatic Amazon and Cerrado produce a flush of new green leaves near the end gradient spans the Amazon basin (Fig. 2), from the continuously rainy of every dry season, which is often detected in satellite images as an 1 The Woods Hole Research Center, 149 Woods Hole Road, Falmouth, Massachusetts 02540-1644, USA. 2Embrapa Amazonia Oriental, Travessa Dr. Eneas Pinheiro, s/n, Marco, Caixa Postal 48, Belem, Para ˆ ´ ´ ´ 66095-100, Brazil. 3Instituto Nacional de Pesquisas da Amazonia (INPA), Large Scale Biosphere-Atmosphere Experiment in Amazonia (LBA), Avenida Andre Araujo, 2936, Manaus, Amazonas, 69060-001, ´ ´ Brazil. 4Instituto de Fısica, Universidade de Sao Paulo, Rua do Matao, Travessa R, 187, Sa Paulo, SP 05508-090, Brazil. 5National Center for Ecological Analysis and Synthesis, 735 State Street, Suite 300, ´ ˜ ˜ ˜o Santa Barbara, California 93101, USA. 6Universidade Federal do Acre, Mestrado em Ecologia e Manejo de Recursos Naturais, Parque Zoobota ˆnico, Distrito Industrial, Rio Branco, AC 69915-900, Brazil. 7 Universidade de Brasılia, Instituto de Ciencias Biologicas, Departamento de Ecologia, Campus Universita Darcy Ribeiro, Asa Norte, Brasılia, Distrito Federal 70910-900, Brazil. 8Columbia University, ´ ˆ ´ ´rio ´ 9 ´ Department of Ecology, Evolution, and Environmental Biology, 1200 Amsterdam Avenue, New York, New York 10027, USA. USDA Forest Service, International Institute of Tropical Forestry, Jardın Bota ´nico Sur, 1201 Calle Ceiba, San Juan, Puerto Rico 00926-1119, USA. 10Embrapa Monitoramento por Satelite, Avenida Soldado Passarinho, 303, Fazenda Chapada Campinas, Sao Paulo, Brazil. 11Harvard ´ ˜o, ˜ University, School of Engineering and Applied Sciences, Department of Earth and Planetary Sciences, 20 Oxford Street, Cambridge, Massachusetts 02138, USA. 12University of Maryland, Earth System Science Interdisciplinary Center, 5825 University Research Court Suite 4001, College Park, Maryland 20740, USA. 13Universidade Federal de Minas Gerais, Centro de Sensoriamento Remoto, Avenida Antonio Carlos 6627, Belo Horizonte, Minas Gerais 31270-900, Brazil. 14Imazon, Centro de Geotecnologia do Imazon, Rua Domingos Marreiros 2020, Belem, Para 66060-160, Brazil. ˆ ´ ´ 1 9 J A N U A RY 2 0 1 2 | VO L 4 8 1 | N AT U R E | 3 2 1 ©2012 Macmillan Publishers Limited. All rights reserved
  • 2. RESEARCH REVIEW Agricultural Logging Global climate expansion change Increased economic activity Reduced Reduced precipitation evapotranspiration over forests; increased extreme droughts Forest drying and tree mortality Biodiversity loss Increased fire risk Increased aerosols Decreased regional- scale runoff Increased local Infrastructure damage; scale runoff reduced investment incentive Reduced water Reduced water Flooding Decreased agricultural Increased respiratory availability for human use, and economic productivity disease; air traffic river navigation, and disruption hydroelectric generation Figure 1 | Interactions between global climate, land use, fire, hydrology, ecology and human dimensions. Forcing factors are indicated with red ovals; processes addressed in this Review are indicated by green boxes and arrows; and consequences for human society are indicated by blue boxes with rounded corners. 1.75 55 1.7 0 20 55 1.7 1.75 .50 .0 1.75 0 .7 0.50 1.75 5 0.2 Forest Cerrado Pasture/cropland Other Figure 2 | Climatic gradient across the Amazon basin. Main figure, the data elsewhere. The arrow emphasizes the trend from continuously wet hydrologic Amazon basin is demarcated by a thick blue line; isopleths of mean conditions in the northwest to long and pronounced dry seasons in the daily precipitation during the three driest months of the year97 (in mm; white southeast, which includes Cerrado (savannah/woodland) vegetation. National lines) are overlain onto four land-cover classes98,99 (key at bottom left). These boundaries are demarcated by broken black lines. Inset, map showing area of isopleths are presented only for areas within Brazil, because of lack of adequate main figure (boxed). 3 2 2 | N AT U R E | VO L 4 8 1 | 1 9 J A N U A RY 2 0 1 2 ©2012 Macmillan Publishers Limited. All rights reserved
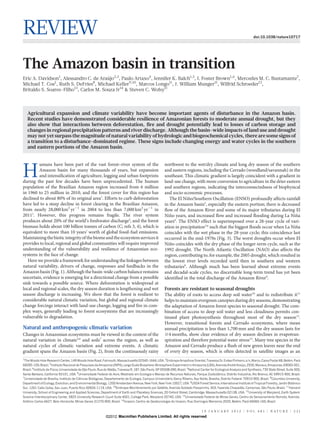
  • 3. REVIEW RESEARCH a 40 the Solimoes River basin was only 33–65% of average values8—may have ˜ exceeded the adaptive capacity of many forest species. Analysis of 51 Percentage deviation from mean flood area La Niña years 30 long-term monitoring plots across Amazonia showed that, relative to El Niño years Non-ENSO years pre-2005 conditions, most forest plots subjected to increased water 20 deficit in 2005 lost several tons of living tree biomass carbon per hectare, 10 owing to a marginally non-significant decline in growth and a significant increase in mortality of trees19. A similarly severe but more extensive 0 drought occurred again in 2010, affecting more than half of the basin and resulting in the lowest discharge ever recorded at Manaus20,21. –10 Susceptibility to drought is likely to vary regionally, depending on the climate (total precipitation and its seasonal distribution) and soil water –20 storage properties (texture and depth) to which the existing vegeta- tion types (for example, Cerrado woodlands, tall-statured central –30 Amazon forests, and transition forests) are physiologically adapted. –40 Furthermore, there is evidence that certain taxa are more vulnerable to 1938 1948 1958 1968 1978 1988 1998 drought-induced mortality17,22. Despite this regional variability, the observations of natural droughts and the drought manipulation experi- b 160 ments indicate similar trends of mortality in response to dry season La Niña years intensity23. El Niño years 140 Non-ENSO years Land-use change and regional climate Land use is changed to capture agricultural and forestry revenues, and 120 results in trade-offs with multiple ecosystem services, such as C storage, climate regulation, hydrologic balance and biodiversity (Fig. 1). (103 km2) 100 The drivers of deforestation Road paving is one of the economic activities that stimulates deforesta- 80 tion24. Further clearing occurs along networks of ‘unofficial roads’ that result from the interacting interests of colonist farmers and loggers25; 60 loggers minimize their costs by buying the right to log private lands. Although practices vary widely across the region, most small land holders (,200 ha) have kept more than 50% of their land in some 40 combination of mature and secondary forest26. J M M J S N J M M J S N J M M J S N J M M J S N J M M J S N 1988 1989 1990 1991 1992 International and national demands for cattle and livestock feed are Month and year increasingly driving land-use change. Direct conversion of forest to Figure 3 | Decadal and seasonal variation in flood area. The long-term cropland in 2003, mostly by large land holders, represented 23% of record of simulated interannual variation in percentage deviation from mean the deforestation in forest and Cerrado regions of the state of Mato flood area (a) illustrates how the ENSO events are superimposed over a 28-year Grosso27. Although cattle pasture remains the dominant use of cleared cycle of high- and low-precipitation phases100. Recurrent seasonal patterns of land, the growing importance of larger and faster conversion to crop- flooded area (103 km2) for five selected years (b) are superimposed over the land, mostly for soybean export, has defined a trend of forest loss in ˜ ˜ interannual variation. Striped bars, La Nina years; stippled bars, El Nino years; Amazonia since the early 2000s. solid bars, non-ENSO years. Although selective logging is not an immediate land-use change, it increase in vegetation indices that involve ratios of red and near-infrared often leads to deforestation. From 1999 to 2003, the area annually logged reflectance14,15. The relation between these satellite-based indices of in the Amazon basin was similar in magnitude to the area deforested28. seasonal greenness and ecosystem productivity remains an unresolved Logged areas are accessible by logging roads and are likely to be cleared focus of debate in these studies, but in any case, this response represents within only a few years after initial disturbance29, and those that are not a short-term phenomenon. cleared have a high risk of burning30. On the other hand, reduced-impact logging has been demonstrated to be economically viable, while causing Multi-year or extreme drought only modest and transient effects on carbon storage and water Experimental manipulations and observations of permanent forest plots exchange31. Expansion of protected areas has also played an important address responses to multi-year and extreme drought. Two long-term role in reducing deforestation in the Brazilian Amazon (Fig. 4)32. drought experiments have produced remarkably similar results, demon- strating that adaptation to seasonal drought can be overwhelmed by Deforestation alters the energy balance multi-year drought16,17. These studies demonstrated a physiological Incoming air from the Atlantic Ocean provides about two-thirds of the adaptation of the trees, which maintained a relatively constant water moisture that forms precipitation over the Amazon basin33. The remainder tension in the xylem (isohydry) in both wet and dry seasons; but this is supplied through recycling of evapotranspiration, primarily driven by adaptation may eventually lead to mortality when roots are unable to the deep-rooted Amazon trees. extract enough soil water during multi-year droughts18. After diverting A large number of observational and modelling studies have sug- 35–50% of total rainfall for three years using below-canopy panels and gested that deforestation causes two main changes in the energy and gutters, plant-available soil moisture stores became depleted, wood pro- water balance of the Amazon basin, as follows. First, partitioning of the duction declined by about 30–60%, tree mortality nearly doubled, and net radiation that is absorbed by the land surface changes, with a live above-ground biomass decreased by about 18–25% (refs 16, 17). decrease in the latent heat flux and an increase in the sensible heat flux, Mortality rates increased to nearly three times that in the control plot primarily because deforestation results in less vegetation being available during years 4–7 of rainfall exclusion17. to transpire water to the atmosphere. Second, replacing the dark rainforest The severe 2005 drought in the southwestern Amazon—when dry with more reflective pasturelands or crops results in a decrease in solar season temperatures were 3–5 uC warmer than normal and rainfall over radiation absorbed by the land surface. Reforestation can reverse these 1 9 J A N U A RY 2 0 1 2 | VO L 4 8 1 | N AT U R E | 3 2 3 ©2012 Macmillan Publishers Limited. All rights reserved
  • 4. RESEARCH REVIEW a b Major towns Planned railway Risk of fire Hydroelectric power plant in operation Railway Low High Hydroelectric power plant under construction Gas/oil pipeline Major rivers Planned hydroelectric power plant Paved roads Roads to be paved 60° W Planned roads 60° W 7 6 0° 0° 4 3 8 2 5 10° S 10° S 9 50° W 50° W 1 70° W 70° W 10 National boundary Forest Deforested Non-forest Protected areas Figure 4 | The Amazon basin today and future fire risks. a, Protected areas ´ ´ a indicate the following cities: 1, Cuiaba; 2, Porto Velho; 3, Manaus; 4, Belem; 5, and major planned infrastructure. b, The risk of fire by 205096 under business- Rio Branco; 6, Paramaribo; 7, Georgetown; 8, Iquitos; 9, Puerto Maldonado; 10, as-usual deforestation and climate change scenarios24. The numbers in Santa Cruz de la Sierra. trends. Within a few years of pasture abandonment, regrowing A large disturbance and a long data record are needed to detect Amazonian forests establish rates of evapotranspiration and reflectivity unambiguously the effect of deforestation on the discharge from a large that are close to those measured in mature forests, even though they have river, given the large interannual and decadal variation in precipitation. not yet recovered the biomass and species diversity of a mature forest34,35. For most of the major tributaries of the Amazon River, the area deforested Atmospheric convection and precipitation are driven by the fluxes of is not yet large enough to be able to attribute changes in discharge spe- energy and water from the land surface. Where clearings for cattle pastures cifically to deforestation. Similarly, a temporal trend in sediment load extend tens of kilometres outward from a road, the air above the deforested could not be distinguished from highly variable interannual and seasonal areas warms up more quickly and tends to rise and draw moist air from the variation for the Madeira River, which drains the southwestern Amazon surrounding forest, creating so-called ‘vegetation breezes’. This decreases basin40. However, for the Tocantins River41 and Araguaia River42 systems, rainfall over the forest while increasing cloudiness, rainfall and thunder- which drain parts of the Cerrado and rainforest environments in the storms over the pasture36. Heterogeneous deforestation at large scales southeastern Amazon, the relative contributions of climate variability (hundreds to thousands of km2) leads to more complex circulation and deforestation have been teased apart. From 1955 to 1995, the area changes, with suppressed rainfall over core clearings, particularly at the of pasture and cropland in the Tocantins basin increased from about 30% beginning and the end of the wet season, and unchanged or increased to 50% and annual river discharge increased by about 25%, but changes in rainfall over large remnant forest patches37,38. These changes also affect precipitation were not statistically significant. Changes of the same mag- water and light availability, and the C uptake of the remaining forests, but nitude have occurred in the Araguaia River since the 1970s, and sediment those effects are not yet well quantified. load increased by 28% with deforestation. In both rivers, discharge At deforestation scales greater than 105 km2, numerical models con- increased mostly during the wet season, when flooding risks are greatest. sistently suggest that a significant decrease in basin-wide precipitation will If deforestation approaches this magnitude in other tributaries, it is likely occur39 due to: (1) a decrease in the evapotranspiration from deforested that land-use change will enhance flooding and sediment transport. regions and resultant downwind transport of water vapour; and (2) a decrease in net absorbed solar energy and a consequent general weakening Regional climate change of the continental-scale low-pressure system that drives precipitation over The IPCC fourth assessment climate change model runs show the highest the basin. probability of significant precipitation decrease predicted for southeastern Amazonia, where deforestation is greatest and where the climate and Deforestation, climate and river discharge ecosystems transition from short-dry-season rainforest to long-dry- Taken alone, a decrease in regional precipitation would result in season savannah ecosystems43,44. Various global and regional climate decreased discharge. However, the integrated response of a river system modelling approaches have suggested that once deforestation exceeds depends on the balance between precipitation and evapotranspiration about 40% of the entire Amazon basin, a ‘tipping point’ might be passed45, effects (Fig. 1). Deforestation within a particular watershed would cause whereby decreased energy and moisture released to the atmosphere from reduced evapotranspiration and increased discharge, but deforestation the largely deforested landscape would result in reduced convection and at the continental scale could cause reduced regional precipitation and a precipitation, and a shift in the forest–savannah boundary or large-scale tendency towards decreased river discharge39. dieback of rainforest. 3 2 4 | N AT U R E | VO L 4 8 1 | 1 9 J A N U A RY 2 0 1 2 ©2012 Macmillan Publishers Limited. All rights reserved
  • 5. REVIEW RESEARCH A number of deficiencies in the structure and application of global fire53. However, several lines of evidence indicate that this natural res- climate models suggest that the uncertainty of these simulated outcomes istance may be changing: (1) about 39,000 km2 of Amazon forest burned and estimated tipping points is very high. A few examples include: (1) during the El Nino drought of 199854, including intact, closed-canopy ˜ many of the models simulate too little precipitation in the Amazon owing forests; (2) both logging and drought-induced tree mortality allow sun- to incomplete representation of the role of the Andes in continental light to penetrate clearings in the canopy, which dries out the forest circulation and large-scale convection over the core of the western floor, rendering it more flammable53; (3) after a forest is burned once, Amazon, and also owing to coarse representation of the land surface with it is more likely to burn again, because a burned forest dries out more respect to small-scale meteorological processes43; (2) inter-annual vari- easily30; and (4) ignition sources have also increased owing to pasture ation of sea surface temperatures in the tropical Pacific and tropical north management and charcoal making46. Although Brazil has made great Atlantic Ocean are closely associated with extreme flood and drought strides in recent years to reduce rates of deforestation1, the frequency of events in the Amazon5,8,20, but these teleconnections to the Amazon are fire has not decreased55, and prospects for continued forest degradation not yet adequately represented in global climate models; and (3) the resulting from fires escaping nearby agricultural areas may be a growing biophysical response of vegetation to increasing atmospheric CO2, risk in many regions. including effects on evapotranspiration, may be one of the largest unknowns for the future of the Amazon forests. The probability of simu- Fires alter forest characteristics lated forest dieback due to decreased rainfall is greatly reduced when a After fires sweep through Amazonian forests, tree mortality ranges from strong CO2 fertilization response is included in a vegetation model44, but 8% to 64% of mature stems ($10 cm diameter at breast height)56. More the scale of the actual impact of increasing CO2 on photosynthetic effi- frequent and/or more severe fires tend to increase tree and liana ciency remains a large source of uncertainty. mortality57. Big trees are generally better adapted to surviving fire, but In summary, the changes in precipitation and discharge associated tend to be the first to suffer from drought19,22,57. Although surviving stems with deforestation already observed in the southern and eastern can benefit from the initial pulse of fire-released nutrients and reduced Amazon demonstrate a potential for significant vegetation shifts and competition, fire-induced mortality reduces overall canopy cover, bio- further feedbacks to climate and discharge. Numerical models strongly mass, and species richness57,58. The decline in plant species diversity also suggest that potential future deforestation may also cause feedbacks to reduces the abundance of fruits and invertebrates, thereby changing the large-scale climate and vegetation distribution, but the models have food supply of birds and other animals56. Frequent fire could change the deficiencies that prevent confident prediction of the magnitude or spatial structure, composition and functioning of vegetation by selecting fire- distribution of deforestation that would lead to a significant region-wide adapted species and favouring more flammable species (for example, decrease in precipitation—including whether a threshold, or tipping point, grasses), thus leading to a more savannah-like ecosystem59. exists whereby the basin could slip into a dry, stable state. Focusing on a theoretical and difficult-to-define tipping point for the entire basin may Multiple fires retard forest regrowth divert the scientific community from the important large-scale regional Fire is used as a tool to help clear land for cattle pasture and to slow the changes that are already taking place, such as lengthening of the dry invasion of woody shrubs, but pastures are often abandoned after a few season37,38 and increases in river discharge41,42 in ecologically and agricul- years, when grass productivity declines and weeds can no longer be turally important transition zones of the eastern and southern flanks of the effectively controlled. Despite tremendous diversity in rates of regrowth basin. among secondary forests from different regions of the basin, the rate of secondary forest regrowth following pasture abandonment was found to Fire as cause and consequence of change be negatively correlated with the number of fires that occurred while in The probability of fire is clearly affected by climate and land use, the the pasture phase60. Nitrogen (N) loss during burning alters the natural latter providing the majority of ignition sources today46. Fire also affects patterns of phosphorus limitation on highly weathered soils. In a study regional climate through a complex set of biophysical and socio- of secondary forests growing on abandoned pastures and croplands, economic feedback processes (Fig. 1). several soil and foliage indicators of N limitation were strongest in the youngest forest stands and became less pronounced as the forests aged61. Smoke changes cloud physics and rainfall After decades of forest regrowth, the N cycle gradually recuperates, During the wet season, the air over most of the Amazon region is as establishing a N-rich mature forest, but the rate of recuperation, as well pristine as air over the open ocean—only a few hundred aerosol particles as the rate of forest regrowth, depends, in part, on the legacy of previous per cm3 of air47—inspiring the term ‘green ocean’48. In stark contrast, land use and fire. burning for land clearing, pasture management and charcoal produc- tion, and escaped forest fires during the dry season, increase aerosols to Disturbance effects on greenhouse gases more than 40,000 particles per cm3 of air in some regions47. This smoke Changes in greenhouse-gas emissions due to disturbance processes and haze affects the microphysical processes within clouds that deter- must be placed in the context of natural emissions. Amazonian forests mine how droplets are formed, making droplets too small to precipitate and wetlands are significant natural sources of methane62–64 and nitrous as rain, thus reducing local rainfall and increasing cloud lifetime49. The oxide65,66 (Fig. 5). Unfortunately, a net carbon balance for the region water vapour remaining in the atmosphere ascends to higher altitudes, remains elusive. where it invigorates thunderstorm formation and lightning strikes, but not necessarily rain. During the dry season, satellite-based measure- Mature forests may be accumulating carbon ments of aerosol optical depth were inversely correlated with precipita- Repeated sampling of about 100 permanent plots in the RAINFOR tion50. In addition to locally smoke-inhibited rainfall, fires cause further network scattered across nearly all Amazonian countries indicates that plant stress due to ozone pollution51 and thick haze that reduces light mature Amazonian forests have been accumulating carbon at an esti- availability and photosynthesis52. Generally, plants are most productive mated rate of 0.4 Pg C yr21 (1 Pg 5 1015 g; 95% confidence interval with some scattered light at intermediate levels of aerosol thickness, but range of estimate, 0.29–0.57 Pg C yr21) in the decades before the 2005 conditions during the biomass burning season often exceed this drought19. The fastest growing trees are in the foothills of the Andes, optimum52. where the soils are generally younger and more fertile7, but where the trees are generally smaller and shorter-lived3,4. In contrast, the biggest Drought increases fire susceptibility and slowest growing trees occur in the oldest and more nutrient-poor The tall, dense tree canopy of central Amazonian forests creates a humid soils of the lowland central and eastern parts of the basin67. The soils of microclimate at ground level, which naturally protects the forest from mature forests on highly weathered Oxisols and Ultisols are unlikely to 1 9 J A N U A RY 2 0 1 2 | VO L 4 8 1 | N AT U R E | 3 2 5 ©2012 Macmillan Publishers Limited. All rights reserved
  • 6. RESEARCH REVIEW <0.1 CH4 cattle emission  future aircraft measurements will corroborate the C sink inferred from 0.3 unknown CH4 source <0.1 CH4 soil emission  scattered ground measurements in the more intact forests of the western <0.1 CH4 soil uptake < 0.1 pyrogenic CH4  part of the basin. <0.1 N2O reduced < 0.1 pyrogenic N2O 0.7 CH4 emission 0.6 N2O emission ?? N2O emission 2 CO2 net uptake CO2 sink/source ?? CO2 uptake 2 CO2 evasion 2 CO2 emission soil emission Disturbing forests causes net C and N loss ?? net soil The net effect of Amazonian deforestation and reforestation results in an annual net C source of 0.15–0.35 Pg C (ref. 80). Adding C emissions from fire and logging extends the range to an annual net release of 0.2–0.8 Pg C (ref. 80). The estimated mean annual C emission from 0.4 DIC deforestation and burning of Cerrado is 0.07 Pg C for 2003 to 200881. and DOC Wetland/river/ Forest Pasture These estimates are improving, in part because of advances in the tech- riparian forest Groundwater Deforestation, nology for analysing satellite images82 to combine spatially explicit and surface reforestation, deforestation rates with regionally specific estimates of forest-C stocks83. runoff fire and logging Pyrogenic CH4 emissions from conversion of Amazonian and Cerrado Figure 5 | Estimates of Amazonian greenhouse-gas emissions. Estimates of native vegetation to pasture are about 1.0 and 0.4 Tg CH4 yr21, respec- annual, basin-wide greenhouse-gas fluxes described in the text are presented tively81, but this does not include shifting cultivation or wildfire. Annual together here, in a common currency of Pg CO2-equivalents, using 100-year pyrogenic N2O emissions from conversion of Amazonian forest to pasture global warming potentials for CO2 (black), CH4 (red) and N2O (purple). Owing are about 0.01 Tg N as N2O (ref. 81), but this does not include shifting to large uncertainties, all values are rounded to one significant figure, and even these estimates remain subject to debate. Where no estimate is available, ‘‘??’’ is cultivation or wildfire. indicated. Note that dissolved inorganic carbon (DIC) and dissolved organic When forests are replaced by cattle pastures, they can either gain84 or carbon (DOC) may be transported via groundwater and overland flow from lose85 soil C. Losses are more common where soil C stocks are initially upland forests to streamside (riparian) forests, and that CO2 can be lost large, and gains are more common when management inputs (fertilizer, (evasion) from river water to the atmosphere. herd rotation, overgrazing avoidance) are greatest86. However, changes in soil C stocks are usually dwarfed by much larger losses in tree bio- be significant C sinks68, although more study is needed on a wider mass. In contrast, the sparse and short-statured trees of the Cerrado diversity of soils. have less above-ground biomass than an Amazonian forest, but the C The cause of observed biomass increases in mature Amazonian forests stocks in roots and soil organic matter of the Cerrado (100 Mg C ha21 in remains unknown. Plausible explanations include a rebound from pre- the top 1 m of soil) can be 2–7 times higher than the above-ground vious human or natural disturbances69 or a change in resources that limit stocks87. Well-managed cultivated pastures may provide enough C plant productivity, such as atmospheric CO2, soil nutrients, or light inputs to maintain soil C88, but most pastures in the Cerrado region availability due to changes in radiation, climate and cloudiness70. The are in advanced stages of degradation, where C inputs are too low to RAINFOR network is our best indicator of Amazonian above-ground sustain high soil C storage. biomass change, but the network is neither a systematic nor a randomized Amazonian upland forest soils annually take up about 1–3 Tg of CH4, sampling of Amazonian vegetation. Because the network has relatively and pasture soils are probably a small net annual source of ,0.1 Tg CH4 few small plots covering a vast region, the effects of large-scale natural (ref. 65). A significant net emission of CH4 in upland forests has been disturbances over decadal and longer timescales may not be included measured, which might include termites or anaerobic respiration in water- in the sampling network, leading to an overestimate of a biomass logged wood, soil, bromeliads, or moss patches, but the source remains increase69,71. Although this challenge to the RAINFOR conclusions has unknown64. Enteric fermentation by cattle is estimated to emit 2.6 and been rebutted72,73, resolving the issue will require empirical data on the 4.1 Tg CH4 yr21 in Amazonian and Cerrado regions, respectively81. distribution of natural disturbances, which is still poorly known71. A Continuing studies point to major hydroelectric reservoirs as an increasing recent analysis of satellite images and meteorological data showed that source of methane76. On the basis of chamber flux measurements, upland large disturbances (.5 ha) caused by windstorms are rare, with a return Amazonian forest soils are estimated to emit 1.3 Tg yr21 of N2O-N interval of about 40,000 years (ref. 74), suggesting that such disturbance (ref. 65), which is about 15% of global non-anthropogenic emissions. effects may not be common enough to undermine extrapolations of Young cattle pastures have higher N2O emissions compared to forests, carbon uptake rates from the RAINFOR network. However, more work but old pastures have lower emissions, so the net effect of deforestation has on this topic is needed, including better estimates of the return intervals of been a small annual decrease of ,0.1 Tg N2O-N (ref. 65). smaller disturbances (,5 ha)71. Although secondary forests may be significant carbon sinks in other Full C accounting should also include exports from forests to aquatic parts of the world89, they currently contribute little to the net C balance systems. The river water is supersaturated with dissolved CO2, which is of the Amazon basin, because they are frequently re-cut before they eventually released to the atmosphere at an estimated rate of about grow large enough to store much C90. Indeed, the area of secondary 0.5 Pg C yr21 (ref. 75). Estimates of the sources of this C remain poorly forests is declining where agriculture continues to expand and intensify, constrained—about two-thirds may come from leaf and wood detritus leading to continued loss of biomass-C from those regions91. dropped into the river from flooded forests, with about one-third pro- Agroforestry and other alternatives to slash-and-burn agriculture for duced by aquatic plants (mats of grasses and other macrophytes) within smallholders have not been widely adopted, but the potential for sig- the river, and a small fraction by algae76. Additional possible sources nificant C sequestration per hectare and the techniques of nutrient include particulates washed in with soil particles and dissolved organic management in these systems have been demonstrated92,93. and inorganic C in ground water77,78. We know very little about the C budget of flooded forests and riparian zone forests, which probably Emerging evidence for a transition contribute significant terrestrially fixed C to streams and rivers76. Are impacts of land-use and climate change in the Amazon basin sur- Estimates of CO2 fluxes based on year-round vertical profiling of passing the natural variability of climate, greenhouse-gas emissions, and atmospheric CO2 concentrations by aircraft are available now only for cycles of carbon, nitrogen and water? Thanks to increased research in part of the eastern Amazon. Fire emissions roughly cancel a modest this area, including the Large-scale Biosphere-Atmosphere (LBA) biological sink during the dry season, so that a wet season source yields experiment in Amazonia (see the accompanying World View in this an annual net source of C to the atmosphere79. This result is consistent issue for a description of the LBA project), we can answer this question with ground-based estimates of slow growing trees and a concentration for some, but not all consequences of land-use and climate change. For of land-use change in the eastern part of the basin. It remains to be seen if greenhouse gases, the answer is probably ‘not yet’ with respect to CH4 3 2 6 | N AT U R E | VO L 4 8 1 | 1 9 J A N U A RY 2 0 1 2 ©2012 Macmillan Publishers Limited. All rights reserved
  • 7. REVIEW RESEARCH and N2O, because they remain dominated by large emissions from 12. Saleska, S. R. et al. Carbon in Amazon forests: unexpected seasonal fluxes and disturbance-induced losses. Science 302, 1554–1557 (2003). undisturbed wetlands and soils, respectively, but the answer for CO2 13. da Rocha, H. R. et al. Patterns of water and heat flux across a biome gradient from is more complex (Fig. 5). Although a C budget for the basin remains tropical forest to savanna in Brazil. J. Geophys. Res. 114, G00B12, http:// uncertain, deforestation has moved the net basin-wide budget away dx.doi.org/10.1029/2007JG000640 (2009). 14. Brando, P., Goetz, S., Baccini, A., Nepstad, D. & Beck, P. Seasonal and interannual from a possible late-twentieth-century net C sink and towards a net variability of climate and vegetation indices across the Amazon. Proc. Natl Acad. source. This directional change is consistent with recent results of Sci. USA 107, 14685–14690 (2010). inverse modelling based on the TransCom3 network of CO2 measure- 15. Huete, A. et al. Amazon rainforests green-up with sunlight in dry season. Geophys. Res. Lett. 33, L06405, http://dx.doi.org/10.1029/02005GL025583 (2006). ments, which reports a shift from a sink in the 1980s to a source in the 16. Brando, P. M. et al. Drought effects on litterfall, wood production, and belowground 2000s for the tropical Americas94. Much of the Amazon forest is resilient carbon cycling in an Amazon forest: results of a throughfall reduction experiment. to seasonal and moderate drought, but this resilience can and has been Phil. Trans. R. Soc. B 363, 1839–1848 (2008). 17. da Costa, A. C. L. et al. Effect of 7 yr of experimental drought on vegetation exceeded with experimental and natural severe droughts, indicating a dynamics and biomass storage of an eastern Amazonian rainforest. New Phytol. risk of C loss if drought increases with climate change. The forest is also 187, 579–591 (2010). resilient to initial disturbances, but repeated or prolonged disturbance 18. Fisher, R. A., Williams, M., Lobo do Vale, R., Costa, A. & Meir, P. Evidence from changes forest structure and nutrient dynamics, potentially leading to a Amazonian forests is consistent with isohydric control of leaf water potential. Plant Cell Environ. 29, 151–165 (2006). long-term change in vegetation composition and C loss. A combination 19. Phillips, O. L. et al. Drought sensitivity of the Amazon rainforest. Science 323, of regional net flux estimates based on aircraft campaign measurements 1344–1347 (2009). with ground-based studies that elucidate process-level understanding is 20. Lewis, S. L., Brando, P. M., Phillips, O. L., van der Heijden, G. M. F. & Nepstad, D. C. The 2010 Amazon drought. Science 331, 554 (2011). needed to narrow uncertainties. 21. Xu, L. et al. Widespread decline in greenness of Amazonian vegetation due to the With respect to energy and water cycles, at least two of the large river 2010 drought. Geophys. Res. Lett. 38, L07402, http://dx.doi.org/10.1029/ basins on the southeastern flanks of the Amazon forest that also drain 2011GL046824 (2011). 22. Nepstad, D. C., Tohver, I. M., Ray, D., Moutinho, P. & Cardinot, G. Mortality of large the more heavily deforested Cerrado region—the Tocantins and trees and lianas following experimental drought in an Amazon forest. Ecology 88, Araguaia basins—have experienced increases in wet season discharge 2259–2269 (2007). and sediment load. Evidence for changes in temporal and spatial patterns 23. Phillips, O. L. et al. Drought–mortality relationships for tropical forests. New Phytol. 187, 631–646 (2010). of precipitation, such as extended length of the dry season, is emerging at 24. Soares-Filho, B. S. et al. Modelling conservation in the Amazon basin. Nature 440, local and regional scales. We cannot yet answer the questions of whether 520–523 (2006). total precipitation has changed or whether recent severe droughts and Landmark presentation of scenarios of development and conservation policies in a spatially explicit simulation model. other extreme events are clear indicators of patterns expected to persist. 25. Arima, E. Y., Walker, R. T., Perz, S. G. & Caldas, M. M. Loggers and forest Narrowing uncertainties about the effects of deforestation on regional fragmentation: behavioral models of road building in the Amazon basin. Ann. precipitation, temperature and fire risk will require combining realistic Assoc. Am. Geogr. 95, 525–541 (2005). ´ 26. Brondızio, E. S. et al. in Amazonia and Global Change (eds Keller, M., Bustamante, M., spatial patterns of deforestation and degradation with improved mesoscale Gash, J. & Dias, P. S.) 117–143 (American Geophysical Union, 2009). circulation models of climate. 27. Morton, D. C. et al. Cropland expansion changes deforestation dynamics in the The emerging evidence of a system in biophysical transition high- southern Brazilian Amazon. Proc. Natl Acad. Sci. USA 103, 14637–14641 (2006). lights the need for improved understanding of the trade-offs between land 28. Asner, G. P. et al. Selective logging in the Brazilian Amazon. Science 310, 480–482 (2005). cover, carbon stocks, water resources, habitat conservation, human health 29. Asner, G. P. et al. Condition and fate of logged forests in the Brazilian Amazon. Proc. and economic development in future scenarios of climate and land-use Natl Acad. Sci. USA 103, 12947–12950 (2006). change24,32,95,96. Brazil is poised to become one of the few countries to 30. Nepstad, D. C. et al. Road paving, fire regime feedbacks, and the future of Amazon forests. For. Ecol. Mgmt 154, 395–407 (2001). achieve the transition to a major economic power without destroying 31. Miller, S. D. et al. Reduced impact logging minimally alters tropical rainforest most of its forests. However, continued improvements in scientific and carbon and energy exchange. Proc. Natl Acad. Sci. USA http://dx.doi.org/10.1073/ technological capacity and human resources will be required in the pnas.1105068108 108, 19431–19435 (2011). 32. Soares-Filho, B. S. et al. Role of the Brazilian Amazon protected areas in climate Amazon region to guide and manage both biophysical and socio- change mitigation. Proc. Natl Acad. Sci. USA 107, 10821–10826 (2010). economic transitions. 33. Costa, M. H. & Foley, J. A. Trends in the hydrologic cycle of the Amazon basin. J. Geophys. Res. 104, 14189–14198 (1999). ¨ ´, ¨ 34. Holscher, D., Sa T. D. A., Bastos, T. X., Denich, M. & Folster, H. Evaporation from 1. Instituto Nacional de Pesquisas Espaciais & National Institute for Space Research ´ Projeto Prodes Monitoramento da Florsta Amazonica Brasileira por Satelite Prodes young secondary vegetation in eastern Amazonia. J. Hydrol. 193, 293–305 (1997). Æhttp://www.obt.inpe.br/prodes/æ (2011). 35. Vieira, I. C. G. et al. Classifying successional forests using Landsat spectral properties and ecological characteristics in eastern Amazonia. Remote Sens. 2. Salati, E. & Vose, R. Amazon basin: a system in equilibrium. Science 225, 129–138 Environ. 87, 470–481 (2003). (1984). 36. Avissar, R. & Schmidt, T. An evaluation of the scale at which ground-surface heat One of the first presentations of the Amazon basin from a systems perspective. flux patchiness affects the convective boundary layer using a large-eddy 3. Malhi, Y. et al. The regional variation of aboveground live biomass in old-growth simulation model. J. Atmos. Sci. 55, 2666–2689 (1998). Amazonian forests. Glob. Change Biol. 12, 1107–1138 (2006). 37. Butt, N., Oliveira, P. A. & Costa, M. H. Evidence that deforestation affects the onset of 4. Saatchi, S. S., Houghton, R. A., Dos Santos Alvara, R. C., Soares, J. V. & Yu, Y. the rainy season in Rondonia, Brazil. J. Geophys. Res. 116, D11120, http:// Distribution of aboveground live biomass in the Amazon basin. Glob. Change Biol. dx.doi.org/10.1029/2010JD015174 (2011). 13, 816–837 (2007). 38. Knox, R., Bisht, G., Wang, J. & Bras, R. L. Precipitation variability over the forest to Estimates of regional variation and patterns in forest biomass are presented non-forest transition in southwestern Amazonia. J. Clim. 24, 2368–2377 (2011). based on a remote sensing approach. 39. Coe, M. T., Costa, M. H. & Soares-Filho, B. S. The Influence of historical and potential 5. Marengo, J. A. Interdecadal variability and trends of rainfall across the Amazon future deforestation on the stream flow of the Amazon River — land surface basin. Theor. Appl. Climatol. 78, 79–96 (2004). processes and atmospheric feedbacks. J. Hydrol. 369, 165–174 (2009). 6. Coe, M. T., Costa, M. H., Botta, A. & Birkett, C. Long-term simulations of discharge 40. Leite, N. K. et al. Intra and interannual variability in the Madeira River water and floods in the Amazon basin. J. Geophys. Res. 107, 8044, http://dx.doi.org/ chemistry and sediment load. Biogeochemistry 105, 37–51 (2011). 10.1029/2001JD000740 (2002). 41. Costa, M. H., Botta, A. & Cardille, J. A. Effects of large-scale changes in land cover on 7. Quesada, C. A. et al. Variations in chemical and physical properties of Amazon the discharge of the Tocantins River, Southeastern Amazonia. J. Hydrol. 283, forest soils in relation to their genesis. Biogeosciences 7, 1515–1541 (2010). 206–217 (2003). 8. Marengo, J. A., Nobre, C. A., Tomasella, J., Cardosa, M. F. & Oyama, M. D. Hydro- 42. Coe, M. T., Latrubesse, E. M., Ferreira, M. E. & Amsler, M. L. The effects of climate and ecological behaviour of the drought of Amazonia in 2005. Phil. Trans. deforestation and climate variability on the streamflow of the Araguaia River, R. Soc. B 363, 1773–1778 (2008). Brazil. Biogeochemistry 105, 119–131 (2011). 9. Marengo, J. in Tropical Rainforest Responses to Climatic Change (eds Bush, M. B. & 43. Malhi, Y. et al. Exploring the likelihood and mechanism of a climate-change- Flenley, J. R.) 236–268 (Springer Praxis Books, 2007). induced dieback of the Amazon rainforest. Proc. Natl Acad. Sci. 106, 10. Nepstad, D. C. et al. The role of deep roots in the hydrological and carbon cycles of 20610–20615 (2009). Amazonian forests and pastures. Nature 372, 666–669 (1994). A review of climate model predictions for the Amazon basin. First demonstration of the importance of deep rooting for survival of eastern 44. Rammig, A. et al. Estimating the risk of Amazonian forest dieback. New Phytol. 187, Amazonian trees. 694–706 (2010). 11. Oliveira, R. S. et al. Deep root function in soil water dynamics in cerrado savannas of 45. Nobre, C. A. & Simone Borma, L. Tipping points’ for the Amazon forest. Curr. Opin. central Brazil. Funct. Ecol. 19, 574–581 (2005). Environ. Sust. 1, 28–36 (2009). 1 9 J A N U A RY 2 0 1 2 | VO L 4 8 1 | N AT U R E | 3 2 7 ©2012 Macmillan Publishers Limited. All rights reserved
  • 8. RESEARCH REVIEW ´ 46. Alencar, A., Solorzano, L. & Nepstad, D. Modeling forest understory fire in an carbon loss. J. Geophys. Res. 115, G04005, http://dx.doi.org/10.1029/ eastern Amazonian landscape. Ecol. Appl. 14, S139–S149 (2004). 2009JG001202 (2010). 47. Artaxo, P. et al. Physical and chemical properties of aerosols in the wet and dry 78. Johnson, M. S. et al. CO2 efflux from Amazonian headwater streams represents a ˆ season in Rondonia, Amazonia. J. Geophys. Res. 107 (D20), 8081–8095 (2002). significant fate for deep soil respiration. Geophys. Res. Lett. 35, L17401, http:// 48. Williams, E. et al. Contrasting convective regimes over the Amazon: implications for dx.doi.org/10.1029/2008GL034619 (2008). cloud electrification. J. Geophys. Res. 107 (D20), 8082–8093 (2002). 79. Gatti, L. V. et al. Vertical profiles of CO2 above eastern Amazonia suggest a net 49. Andreae, M. O. et al. Smoking rain clouds over the Amazon. Science 303, carbon flux to the atmosphere and balanced biosphere between 2000 and 2009. 1337–1342 (2004). Tellus B http://dx.doi.org/10.1111/j.1600-0889.2010.00484.x (published A review of understanding of how smoke from biomass burning affects local and online, 6 July 2010). regional climate. 80. Houghton, R. A., Gloor, M., Lloyd, J. & Potter, C. in Amazonia and Global Change (eds 50. Bevan, S. L., North, P. R. J., Grey, W. M. F., Los, S. O. & Plummer, S. E. Impact of Keller, M. et al.) 409–428 (American Geophysical Union Books, 2009). atmospheric aerosol from biomass burning on Amazon dry-season drought. The net effect of carbon loss due to deforestation and carbon accumulation from J. Geophys. Res. 114, D09204, http://dx.doi.org/10.1029/2008JD011112 (2009). forest regrowth is estimated. 51. Longo, K. M. et al. Correlation between smoke and tropospheric ozone 81. Bustamante, M. M. C. et al. Estimating greenhouse gas emissions from cattle ´ concentration in Cuiaba during SCAR-B. J. Geophys. Res. 104 (D10), raising in Brazil. Clim. Change (submitted). 12113–12129 (1999). 82. Morton, D. C. et al. Rapid assessment of annual deforestation in the Brazilian 52. Oliveira, P. H. F. et al. The effects of biomass burning aerosols and clouds on the CO2 flux in Amazonia. Tellus B 59, 338–349 (2007). Amazon using MODIS data. Earth Interact. 9, 1–22 (2005). 53. Ray, D., Nepstad, D. & Moutinho, P. Micrometeorological and canopy controls of 83. Fearnside, P. M. et al. Biomass and greenhouse-gas emissions from land-use flammability in mature and disturbed forests in an east-central Amazon change in Brazil’s Amazonian ‘‘arc of deforestation’’: the states of Mato Grosso landscape. Ecol. Appl. 15, 1664–1678 (2005). and Rondonia. For. Ecol. Mgmt 258, 1968–1978 (2009). 54. Alencar, A., Nepstad, D. C. & Vera Diaz, M. d. C. Forest understory fire in the 84. Cerri, C. E. P. et al. Modelling changes in soil organic matter in Amazon forest to Brazilian Amazon in ENSO and non-ENSO Years: area burned and committed pasture conversion, using the Century model. Glob. Change Biol. 10, 815–832 carbon emissions. Earth Interact. 10, 6, 1–17 (2006). (2004). ˜o, 55. Araga L. E. O. & Shimabukuro, Y. E. The incidence of fire in Amazonian forests with 85. Asner, G. P., Townsend, A. R., Bustamante, M. M. C., Nardoto, G. B. & Olander, L. P. implications for REDD. Science 328, 1275–1278 (2010). Pasture degradation in the Central Amazon: linking changes in carbon and 56. Barlow, J. & Peres, C. A. in Emerging Threats to Tropical Forests (eds Laurance, W. F. nutrient cycling with remote sensing. Glob. Change Biol. 10, 844–862 (2004). & Peres, C. A.) 225–240 (Univ. Chicago Press, 2006). 86. Neill, C. & Davidson, E. A. in Global Climate Change and Tropical Ecosystems (eds Lal, 57. Balch, J. K. et al. Size, species, and fire characteristics predict tree and liana R., Kimble, J. M. & Stewart, B. A.) 197–211 (CRC Press, 2000). mortality from experimental burns in the Brazilian Amazon. For. Ecol. Mgmt 261, 87. Grace, J., San Jose, J., Meir, P., Miranda, H. S. & Montes, R. A. Productive and carbon 68–77 (2011). fluxes of tropical savannas. J. Biogeogr. 33, 387–400 (2006). 58. Balch, J. D. et al. Negative fire feedback in a transitional forest of southeastern 88. Santos, A. J. B. et al. High rates of net ecosystem carbon assimilation by Brachiara Amazonia. Glob. Change Biol. 14, 2276–2287 (2008). pasture in the Brazilian cerrado. Glob. Change Biol. 10, 877–885 (2004). 59. Nepstad, D. C., Stickler, C. M., Soares-Filho, B. & Merry, F. Interactions among 89. Pan, Y. et al. A large and persistent carbon sink in the world’s forests. Science 333, Amazon land use, forests and climate: prospects for a near-term forest tipping 988–993 (2011). point. Phil. Trans. R. Soc. B 363, 1737–1746 (2008). 90. Neeff, T., Lucas, R. M., Santos, J. d., Brondizio, E. S. & Freitas, C. C. Area and age of Explores the mechanisms of how land use, fire and climate change interact. secondary forests in Brazilian Amazonia 1978–2002: an empirical estimate. 60. Zarin, D. J. et al. Legacy of fire slows carbon accumulation in Amazonian forest Ecosystems 9, 609–623 (2006). regrowth. Front. Ecol. Environ. 3, 365–369 (2005). 91. Almeida, A. S. d., Stone, T. A., Vieira, I. C. G. & Davidson, E. A. Non-frontier 61. Davidson, E. A. et al. Recuperation of nitrogen cycling in Amazonian forests deforestation in the eastern Amazon. Earth Interact. 14, 1–15 (2010). following agricultural abandonment. Nature 447, 995–998 (2007). ˜ 92. Luizao, F., Fearnside, P. M., Cerri, C. E. P. & Lehmann, J. in Amazonia and Global Chronosequences of secondary forests were analysed to demonstrate that Change (eds Keller, M., Bustamante, M., Gash, J. & Dias, P. S.) 311–336 (American nitrogen limitation occurs in young Amazonian forests and then gradually Geophysical Union, 2009). declines during secondary succession. 93. Davidson, E. A. et al. An integrated greenhouse gas assessment of an alternative to 62. Melack, J. M. et al. Regionalization of methane emissions in the Amazon basin with slash-and-burn agriculture in eastern Amazonia. Glob. Change Biol. 14, 998–1007 microwave remote sensing. Glob. Change Biol. 10, 530–544 (2004). (2008). 63. Miller, J. B. et al. Airborne measurements indicate large methane emissions from the eastern Amazon basin. Geophys. Res. Lett. 34, L10809, http://dx.doi.org/ 94. Gurney, K. R. & Eckels, W. J. Regional trends in terrestrial carbon exchange and 10.1029/2006GL029213 (2007). their seasonal signatures. Tellus B 63, 328–339 (2011). 64. do Carmo, J. B., Keller, M., Dias, J. D., de Camargo, P. B. & Crill, P. A source of 95. da Silva, R. R., Werth, R. D. & Avissar, R. Regional impacts of future land-cover methane from upland forests in the Brazilian Amazon. Geophys. Res. Lett. 33, 1–4 changes on the Amazon Basin wet-season climate. J. Clim. 21, 1153–1170 (2008). http://dx.doi.org/10.1029/2005GL025436 (2006). 96. Silvestrini, R. A. et al. Simulating fire regimes in the Amazon in response to climate 65. Davidson, E. A. & Artaxo, P. Globally significant changes in biological processes of change and deforestation. Ecol. Appl. 21, 1573–1590 (2011). the Amazon Basin: results of the Large-scale Biosphere-Atmosphere Experiment. 97. Nepstad, D. C. et al. Amazon drought and its implications for forest flammability Glob. Change Biol. 10, 519–529 (2004). and tree growth: a basin-wide analysis. Glob. Change Biol. 10, 704–717 (2004). 66. D’Amelio, M. T. S., Gatti, L. V., Miller, J. B. & Tans, P. Regional N2O fluxes in Amazonia 98. Eva, H. D. et al. A land cover map of South America. Glob. Change Biol. 10, 731–744 derived from aircraft vertical profiles. Atmos. Chem. Phys. 9, 8785–8797 (2009). (2004). 67. ter Steege, H. N. et al. Continental-scale patterns of canopy tree composition and 99. Sano, E. E., Rosa, R., Brito, J. L. & Ferreira, L. G. Mapeamento de Cobertura Vegetal do function across Amazonia. Nature 443, 444–447 (2006). ´ Bioma Cerrado: Estrategias e Resultados (Embrapa Cerrados, Planaltina, District 68. Telles, E. C. C. et al. Influence of soil texture on carbon dynamics and storage Federal, Brazil, 2007). potential in tropical forest soils of Amazonia. Glob. Biogeochem. Cycles 17, 1040, 100.Coe, M. T., Costa, M. H. & Howard, E. A. Simulating the surface waters of the Amazon http://dx.doi.org/10.1029/2002GB001953 (2003). River Basin: impacts of new river geomorphic and dynamic flow 69. Fisher, J. I., Hurtt, G. C., Thomas, R. Q. & Chambers, J. Q. Clustered disturbances parameterizations. Hydrol. Process. 21, 2542–2553 (2007). lead to bias in large-scale estimates based on forest sample plots. Ecol. Lett. 11, 554–563 (2008). Acknowledgements We thank the Brazilian Ministry of Science and Technology (MCT), 70. Nemani, R. R. et al. Climate-driven increases in global terrestrial net primary the National Institute for Space Research (INPE) and the National Institute of production from 1982 to 1999. Science 300, 1560–1563 (2003). Amazonian Research (INPA) for designing, leading and managing the LBA project. We 71. Chambers, J. Q. et al. Lack of intermediate-scale disturbance data prevents robust also thank D. Wickland (NASA) for more than a decade of leadership and support for the extrapolation of plot-level tree mortality rates for old-growth tropical forests. Ecol. LBA-Eco project component of LBA. We thank the LBA-Eco team members who Lett. 12, E22–E25 (2009). contributed to discussions on an early draft of this manuscript at a workshop in Foz do 72. Gloor, M. et al. Does the disturbance hypothesis explain the biomass increase in Iguaçu in August 2010, and S. Saleska for comments on the manuscript. We thank basin-wide Amazon forest plot data? Glob. Change Biol. 15, 2418–2430 (2009). P. Lefebvre and W. Kingerlee for assistance with figure and manuscript preparation. 73. Lloyd, J., Gloor, E. U. & Lewis, S. L. Are the dynamics of tropical forests dominated by Development of this manuscript was supported by NASA grants NNX08AF63A and large and rare disturbance events? Ecol. Lett. 12, E19–E21 (2009). NNX11AF20G. ´ 74. Espırito-Santo, F. D. B. et al. Storm intensity and old growth forest disturbances in the Amazon region. Geophys. Res. Lett. 37, L11403, http://dx.doi.org/10.1029/ Author Contributions E.A.D. wrote an initial rough draft and edited the final draft of the 2010GL043146 (2010). paper. M.K. and M.T.C. contributed significant final edits. All of the other co-authors 75. Richey, J. E., Melack, J. M., Aufdenkampe, A. K., Ballester, V. M. & Hess, L. L. participated in an LBA-Eco team meeting at Foz do Iguaçu on August, 13, 2010, where Outgassing from Amazonian rivers and wetlands as a large tropical source of this manuscript was designed, and either were co-leaders of breakout groups or made atmospheric CO2. Nature 416, 617–620 (2002). significant subsequent contributions of subsections of text or figures. All co-authors Presents first calculations of potential loss of CO2 to the atmosphere from the also provided edits throughout. Amazon River and its main tributaries. 76. Melack, J. M., Novo, E. M. L. M., Forsberg, B. R., Piedade, M. T. F. & Maurice, L. in Author Information Reprints and permissions information is available at Amazonia and Global Change (eds Keller, M. et al.) 525–542 (American Geophysical www.nature.com/reprints. The authors declare no competing financial interests. Union Books, 2009). Readers are welcome to comment on the online version of this article at 77. Davidson, E. A., Figueiredo, R. O., Markewitz, D. & Aufdenkampe, A. Dissolved CO2 in www.nature.com/nature. Correspondence should be addressed to E.A.D. small catchment streams of eastern Amazonia: a minor pathway of terrestrial (edavidson@whrc.org). 3 2 8 | N AT U R E | VO L 4 8 1 | 1 9 J A N U A RY 2 0 1 2 ©2012 Macmillan Publishers Limited. All rights reserved