SlideShare une entreprise Scribd logo
1  sur  15
BRIEF HISTORY OF HDFC BANK:
Housing Development Finance Corporation Limited, more popularly known as HDFC Bank Ltd,
was established in the year 1994, as a part of the liberalization of the Indian Banking Industry by
Reserve Bank of India (RBI). It was one of the first banks to receive an 'in principle' approval
from RBI, for setting up a bank in the private sector. The bank was incorporated with the name
'HDFC Bank Limited', with its registered office in Mumbai. The following year, it started its
operations as a Scheduled Commercial Bank. Today, the bank boasts of as many as 1412
branches and over 3275 ATMs across India.

Amalgamations
In 2002, HDFC Bank witnessed its merger with Times Bank Limited (a private sector bank
promoted by Bennett, Coleman & Co. / Times Group). With this, HDFC and Times became the
first two private banks in the New Generation Private Sector Banks to have gone through a
merger. In 2008, RBI approved the amalgamation of Centurion Bank of Punjab with HDFC
Bank. With this, the Deposits of the merged entity became Rs. 1,22,000 crore, while the
Advances were Rs. 89,000 crore and Balance Sheet size was Rs. 1,63,000 crore..

Tech-Savvy
HDFC Bank has always prided itself on a highly automated environment, be it in terms of
information technology or communication systems. All the braches of the bank boast of online
connectivity with the other, ensuring speedy funds transfer for the clients. At the same time, the
bank's branch network and Automated Teller Machines (ATMs) allow multi-branch access to
retail clients. The bank makes use of its up-to-date technology, along with market position and
expertise, to create a competitive advantage and build market share.

Capital Structure

At present, HDFC Bank boasts of an authorized capital of Rs 550 crore (Rs5.5 billion), of this
the paid-up amount is Rs 424.6 crore (Rs.4.2 billion). In terms of equity share, the HDFC Group
holds 19.4%. Foreign Institutional Investors (FIIs) have around 28% of the equity and about
17.6% is held by the ADS Depository (in respect of the bank's American Depository Shares
(ADS) Issue). The bank has about 570,000 shareholders. Its shares find a listing on the Stock
Exchange, Mumbai and National Stock Exchange, while its American Depository Shares are
listed on the New York Stock Exchange (NYSE), under the symbol 'HDB'.

Products & services:

Personal Banking:

Savings Accounts, Salary Accounts, Current Accounts, Fixed Deposits, Demat Account, Safe
Deposit Lockers, Loans, Credit Cards, Debit Cards, Prepaid Cards, Investments & Insurance,
Forex Services, Payment Services, Net Banking , Insta Alerts, Mobile Banking , Insta Query ,
ATM & Phone Banking.

NRI Banking
Rupee Current Accounts, Rupee Savings Accounts, Rupee Fixed Deposits ,Foreign Currency
Deposits, Accounts for Returning Indians, Quickremit (North America, UK, Europe, Southeast
Asia), IndiaLink (Middle East, Africa), Cheque LockBox, Telegraphic / Wire Transfer, Funds
Transfer through Cheques / DDs / TCs, Mutual Funds, Private Banking, Portfolio Investment
Schemes, Loans, Payment Services, Net Banking , Insta Alerts , Mobile, Banking, Insta Query ,
ATM ,Phone Banking.


SHAREHOLDING PATTERN AS ON 30TH SEPTEMBER 2009:
The shareholders are divided in to two categories :

       shareholding of promoter and promoter group
       public shareholding

Under the first category (shareholding of promoter and promoter group) we have subcategories
they are:

       Indian
       Foreign

Under Indian, the corporate bodies are the promoters(total no.of shareholders are four)who holds
82443000 shares which accounts to 19.29% of the total shares. There are no foreign promoters
in this company. There has not been any change in the total no of shares when compared with the
previous two quarters.

Under the second category (public shareholding) we have sub divisions they are :

       Institutions
       Non-institutions

Under the institutions , the foreign institutional investors(total no of shareholders are 522) holds
the major part i.e 120326279 shares which accounts to 28%.When compared with the previous
two quarters it has been increased by 3%.The next major shareholders are the insurance
companies(total no of shareholders are 27) that holds 33661939 shares which accounts to 7.88 %
and when compared with previous two quarters there has been a negligible increase. The
institutional shareholders sum up to 40.62%.

The non institutions are the other investors like the private corporate bodies who holds 39281016
shares which accounts to 9.18% of the total shares and the others hold 80595303 shares which
accounts to 18.86%.The shares with the general public is 45148741 which accounts to 10.565
and when compared with the previous two quarters there has been a slight decrease. The total no
of shares are 427348828 and all the percentages sum up to 100.


                                        PERCENTAGE OF
 PARTICULARS                            SHARES
 PROMOTER GROUP                                      19.2913
 MUTUAL FUNDS/UTI                                     4.5877
 OTHERS                                               0.0903
 INSURANCE COMPANIES                                   7.788
 FOREIGN INSTITUTIONAL
 INVESTORS                                            28.1559
 BODIES CORPORATE                                      9.1916
 INDIVIDUALS- UPTO 1 LAKH                              8.0176
 INDIVIDUALS- ABOVE 1 LAKH                             2.5471
 NON RESIDENTS                                         1.4718
 DEPOSITORY RECIEPTS                                   18.859


                        PERCENTAGE OF SHARES


        NON                DEPOSITORY            PROMOTER
      RESIDENTS             RECIEPTS               GROUP
         1%                   19%                   19%
                                                                       MUTUAL
 INDIVIDUALS-                                                         FUNDS/UTI
 ABOVE 1 LAKH                                                            5%
      3%                                                              OTHERS
                  INDIVIDUALS-                                          0%
                                                          INSURANCE
                  UPTO 1 LAKH
                                                          COMPANIES
                       8%
                                                              8%
                        BODIES
                      CORPORATE
                          9%                 FOREIGN
                                          INSTITUTIONAL
                                            INVESTORS
                                               28%
PROMOTER:
HDFC is India's premier housing finance company and enjoys an impeccable track record in
India as well as in international markets. Since its inception in 1977, the Corporation has
maintained a consistent and healthy growth in its operations to remain the market leader in
mortgages. Its outstanding loan portfolio covers well over a million dwelling units. HDFC has
developed significant expertise in retail mortgage loans to different market segments and also
has a large corporate client base for its housing related credit facilities. With its experience in the
financial markets, a strong market reputation, large shareholder base and unique consumer
franchise, HDFC was ideally positioned to promote a bank in the Indian environment.


CONTENTS OF THE ANNUAL REPORT-

Director’s report-
Service quality initiatives include the audit of services and improvement on the areas identified on the
basis of customer feedback on experiences at various touch-points. New elements were added and
renewed improvement schemes were installed using technology to ensure customer convenience, security
of transactions and reduce transaction cost.

Risk Management & Portfolio Quality-

The Bank in the course of its business is exposed to various risks, of which the most important are credit
risk, market risk (including liquidity risk and price risk) and operational risk. The identification,
measurement, monitoring and control of risks remain key aspects of the Bank’s risk management system.
Sound risk management supported by a balanced risk-reward trade-off is critical to achieving the Bank’s
business strategy for business and revenue growth. The Bank has distinct policies and processes in place
for the retail and wholesale businesses. The


INTERNAL AUDIT & COMPLIANCE-

The Bank has Internal Audit & Compliance functions which are responsible for independently evaluating
the adequacy of all internal controls and ensuring operating and business units adhere to internal
processes and procedures as well as to regulatory and legal requirements. The audit function also
proactively recommends improvements in operational processes and service quality. To ensure
independence, the Audit department has a reporting line to the Chairman of the Board of Directors and
the Audit & Compliance Committee of the Board and only indirectly to the Managing Director.

CORPORATE SOCIAL RESPONSIBILITY-

As its operations have grown your bank has retained its focus onvarious areas of corporate sustainability
that impact the socio economic ecosystem that we are part of. HDFC Bank’s focus in the area of
corporate sustainability includes social sustainability & social welfare and financial inclusion.
Social Sustainability & Social Welfare-

The bank has initiated a number of programs to encourage economic, social and educational development
within the communities that it operates; while at the same time contributing to several grass root level
development programs across these geographies.

.

STATUTORY DISCLOSURES

The information required under Section 217(2A) of the Companies Act, 1956. and the rules made
thereunder, are given in the annexure appended hereto and forms part of this report.


DIRECTORS

Mr. Vineet Jain resigned as a Director of the Bank with effect from December 27, 2008.
Mr. Arvind Pande and Mr. Ashim Samanta retire by rotation atthe ensuing Annual General Meeting and
being eligible offer themselves for re-appointment.

AUDITORS-

The Auditors M/s. Haribhakti & Co., Chartered Accountants will retire at the conclusion of the
forthcoming Annual General Meeting and are eligible for re-appointment.

AUDITOR’S REPORT

The attached Balance Sheet of HDFC Bank Limited audited (“the Bank”) as at 31 March 2009 and also
the Profit and Loss Account of the Bank and the Cash Flow statement. We conducted our audit in
accordance with auditing
standards generally accepted in India.The An audit includes examining, on a test basis, evidence
supporting the amounts and disclosures in the financial statements.


INFORMATION OF ACCOUNTS OF THE COMPANY-

 Balance sheet on date 2008-09(In thousands)

ITEMS                                             2009                 2008
Capital                                           4,253,841            3,544,329
Equity share warrents                             4,009,158            -

Reseves and surplus                               142,209,460          111,428,076
    Total Assests                                 1,832,707,           1,331,766,032
Current assests                                   135,272,112          125,531,766

Fixed assests                                     17,067,290           11,750,917

The current year capital shows an increment with that of previous year by 16.67%
About the deviation of equity share can’t be predicted du to insufficient data.the company showsa high
amount of reserves and surplus which may due to the high percentage of general reseve and
amalgamation reserve.


INFORMATION ABOUT THE P&L ACCOUNT OF THE COMPANY(In thousands)
ITEMS                         2009           2008
INCOME                        196,228,646    123,981,512
EXPENDITURE                   173,779,254    108,079,582
PROFIT                        48,195,737     35,222,327
APPROPRIATIONS                48,195,737     35,222,327
EARNINGS PER EQUITY           52.85          46.22
SHARE
(Face value Rs. 10 per share)
A) Basic

The income increased by 36.817% may be due to high operating income ratio.There is an considerable
increase inexpendeture in current year by 37.806% compared to last year.The company has also mainted a
good profit increment for the current year which is almost 27%.


INFORAMAION ABOUT THE CASH FLOW ACTIVITY OF THE COMPANY(In thousands)
ITEMS                          2009            2008
Net cash flow from / (used in) (17,361,421)    27,231,256
operating activities
Net cash generated from        29,646,633      36,283,464
financing activities
Net cash used in investing     (6,637,774)     (6,197,812)

The net cash flow in the current year shows a considerable increase by 56.88%.
The financing activity ratio also increased by2256%.
About the balance sheet-
The company has Authoristed shares 55,00,00,000 ( 31 March, 2008 : 55,00,00,000) Equity Shares of
Rs. 10/- each, out of which 42,53,84,109 (31 March, 2008 : 35,44,32,920) Equity Shares of Rs. 10/-
eachare issued.


The company comprises of following type of reseves-
Types                       2009                               2008

Statutory Reserve              22,987,291                      15,193,539
General Reserve                7,360,523                       5,115,584
Amalgamation Reserve             10,635,564                       145,218
Capital Reserve                  956,510                          17,850
Investment Reserve               276,250                          414,800
Account

The company has a propose divedend 27,206,229 for the year 2009(figs are in thousands)
Also it has a bill payable 29224,076 for the current year as current libillites.
Next, the current assest i.e if u see the cash in hand for te current year is 15,861,868
Gross block for the current year is 7,160,665, which is a 26.76% increment then the previous year.

Net block for the current year is 11,311,063 and previous 7,322,171 which is a 9.352% increased
percentage.
Fixed assets are stated at cost less accumulated depreciation as adjusted for impairment, if any. Cost
includes cost of purchase and all expenditure like site preparation, installation costs and professional fees
incurred on the asset before it is ready to use. Subsequent expenditure incurred on assets put to use is
capitalized only when it increases the future benefit/functioning capability from/of such assets.
Depreciation is charged over the estimated useful life of the fixed asset on a straight-line basis. Income
tax comprises the current tax provision, the net change in the deferred tax asset or liability in the year and
fringe benefit tax.

Deferred tax assets and liabilities are recognised for the future tax consequences of timing differences
between the carrying values of assets and liabilities and their respective tax bases, and operating loss
carry forwards.
.
Statement pursuant to Section 212 of the Companies Act, 1956, relating to subsidiary
Companies

Name of the subsidiary               HDFC Securities Ltd.                   HDB Financial Services Ltd.
Capital                              1,500                                  10,501
Reserves and Surplus                 8,025                                  (1,288)
Total Assets                         20,599                                 19,588
Total Liabilities                    11,074                                 10,375
Investments                          _                                      _
Turnover                             12,466                                 2,354
Profit / (Loss) Before Taxation      2,809                                  (919)
Provision for Taxation               (1,152)                                (9)
Profit / (Loss) After Taxation       1,657                                  (928)
Proposed Dividend including tax      35                                     _


The New Capital Adequacy Framework is applicable to HDFC Bank Limited (hereinafter referred to as
the Bank)
and its two subsidiaries (HDFC Securities Ltd. and HDB Financial Services Private Ltd.) which together
constitutes the group in line with.

CAPITAL STRUCTURE-

Capital funds are classified into Tier I and Tier II capital under the capital adequacy framework. Tier I
capital includes paid-up equity capital, statutory reserves, other disclosed free reserves, capital reserves
and innovative perpetual debt instruments . Elements of Tier II capital include revaluation reserve, if any,
general provision for standard assets,


CAPITAL ADEQECY-

The Bank has a process for assessing its overall Capital ,Adequacy in relation to their risk profile and a
strategy for maintaining their capital level. The process provides an assurance that the Bank has adequate
capital to support all risk in its business and an appropriate capital buffer based on its business profile.
The Bank has a structured management framework in the internal capital adequacy assessment process for
the identification and evaluation of the significance of all risks that the Bank faces, which may have an
adverse material impact on its financial position. The Bank considers the following risks as material risks

 Credit Risk
�Market Risk
�Interest Rate Risk in the Banking Book
�Liquidity Risk
�Credit Concentration Risk
�Business Risk
�Strategic Risk
�Compliance Risk
�Reputation Risk�Operational Risk


Credit Risk-

Credit Risk is defined as the possibility of losses associated with diminution in the credit quality of
borrowers or
counterparties. In a bank’s portfolio, losses stem from outright default due to inability or unwillingness of
a
customer or counterparty to meet commitments in relation to lending, trading, settlement and other
financial
transactions.
Wal-Mart

PARTICULARS                                                    2006            2005 % CHANGE
SALES                                                         312427          285222 9.538184292
OPERATING INCOME/OPERATING PROFIT                              18530          17091 8.419636066
INTEREST                                                       1172             986 18.86409736
NET INCOME/ NET PROFIT                                         11231          10267 9.389305542
OPERATING EXPENSES                                             56733          51248   10.7028567
SHARE HOLDERS EQUITY                                           53171          49396 7.642319216
TOTAL ASSETS                                                  138187          120154 15.00823943
COST OF GOODS SOLD                                            240391          219793 9.371545045
GROSS PROFIT= SALES- COST OF GOODS SOLD                        72036          65429 10.09796879
PRETAXPROFIT=OPERATING PROFIT-INTEREST                         17358          16105 7.780192487


Profitability Ratios


PARTICULARS                                           2006             2005 % CHANGE
GROSS PROFIT RATIO=(GROSSPROFIT/SALES)*100      23.05690609     22.93967506       0.511040513
NET INCOME RATIO=(NETPROFIT/SALES)*100          3.594759736     3.599652201      -0.135914933
OPERATING PROFIT RATIO= (OPERATING
PROFIT/SALES)*100                               5.930985478     5.992174517      -1.021149139
PRETAX PROFIT RATIO=(PRETAXPROFIT/SALES)*100    5.555857848     5.646478883      -1.604912311
OPERATING EXPENSE RATIO=(OPERATING
EXPENSES/SALES)*100                              18.1588019     17.96775845       1.063256994
FINANCIAL EXPENSES RATIO=(INTEREST/SALES)*100    0.37512763     0.345695634       8.513846684
RETURN ON SALES=(NETINCOME/SALES)*100           3.594759736     3.599652201      -0.135914933
RETURN ON ASSETS=(NETINCOME/ ASSETS)*100        8.127392591      8.54486742      -4.885679419
RETURN ON EQUITY=(NET INCOME/SH.HLDRS
EQUITY)*100                                     21.12241635     20.78508381       1.622954929
PROFITABILITY=(NETINCOME/SALES)*100             3.594759736     3.599652201      -0.135914933
EFFICIENCY=(SALES/ASSETS)                       2.260900085     2.373803619      -4.756228912
LEVERAGE=(ASSETS/SHAREHOLDERS EQUITY)           2.598916703     2.432464167       6.842959408
DUPONT ANALYSIS                                 21.12241635     20.78508381       1.622954929
Profitability Ratios Interpretation:
PARTICULARS                                            2006              2005 % CHANGE
  INVENTORY(AVG)                                         32191             29762      8.161413883
  COST OF GOODS SOLD                                    240391         219793         9.371545045
  NET CREDIT SALES( NET SALES)                          312427         285222         9.538184292
  AVERAGE DEBTORS( RECIEVABLES)                          2662              1715       55.21865889
  CASH AND CASH EQUIVALENTS                              6414              5488       16.87317784
  CURRENT LIABILITIES                                    48826             43182      13.07026076
  TOTAL ASSETS                                          138187         120154         15.00823943
  CURRENT ASSETS                                         43824             38854      12.79147578
  AVERAGE CREDITORS(PAYABLES)                            25373             21987       15.4000091
  OPENING STOCK                                          29762                 0
  CLOSING STOCK                                          32191             29762      8.161413883
  FIXED ASSETS = TOTAL ASSETS-CURRENT ASSETS             94363             81300      16.06765068
  PURCHASES= COST OF GOODS SOLD- OPENING
  STOCK+ CLOSING STOCK                                  242820         249555         -2.698803871
  NETWORKING CAPITAL= CURRENT ASSETS-
  CURRENT LIABILITIES                                    -5002             -4328      15.57301294


      Asset Utilization Ratios


PARTICULARS                                                        2006            2005 % CHANGE
STOCK TURNOVER RATIO= COST OF GOODS SOLD/AVG INVENTORY       7.467646237     7.385021168   1.118819658
NUMBER OF DAYS TO INVENTORY=365/STOCK TURNOVER RATIO         48.87751621     49.42436747   -1.106440584
DEBTORS TURNOVER RATIO= NET CREDIT SALES/ AVG DEBTORS        117.3655147     166.3102041    -29.4297573
AVERAGE COLLECTION PERIOD= 365/DEBTORS TURNOVER RATIO        3.109942483     2.194693958   41.70278602
CREDITOR TURNOVER RATIO= NET CREDIT PURCHASES/AVG
CREDITORS                                                    9.570015371     11.35011598   -15.68354553
AVG PAYMENT PERIOD=365/ CREDITOR TURNOVER PERIOD             38.13995964     32.15826171   18.60081241
CASH TURNOVER RATIO=SALES/CASH AND CASH EQUIVALENTS          48.71016526     51.97193878   -6.276028158
CURRENT LIABILITIES TURNOVER RATIO=SALES/CURRENT
LIABILITIES                                                  6.398783435     6.605113242   -3.123789086
WORKING CAPITAL TURNOVER RATIO= SALES/ NET WORKING
CAPITAL                                                     -62.46041583    -65.90157116   -5.221659014
TOTAL ASSETS TURNOVER RATIO=SALES/TOTAL ASSETS               2.260900085     2.373803619   -4.756228912
FIXED ASSETS TURNOVER RATIO=SALES/FIXED ASSETS               3.310905758     3.508265683   -5.625569525
Asset Utilization Ratios Interpretation:
PARTICULARS                                      2006     2005 % CHANGE
TOTAL ASSETS                                   138187    120154 15.0082394
SH.HLDRS EQUITY                                 53171    49396 7.64231922
TOTAL LIABILITIES                               85016    70758 20.1503717
EBIT                                            18530    17091 8.41963607
INTEREST                                         1172      986 18.8640974
EBT=EBIT-INTEREST                               17358    16105 7.78019249


Leverage ratios


PARTICULARS                                       2006      2005 % CHANGE
ASSETS TO EQUITY RATIO= ASSETS/EQUITY          2.598917 2.432464 6.84295941
DEBT RATIO= TOTAL LIABILITIES/TOTAL ASSETS     0.615224 0.588894 4.47109902
DEBT EQUITY RATIO= TOTAL LIABILITIES/ EQUITY   1.598917 1.432464 11.6200139
INTERESTCOVERAGE RATIO= EBIT/ INTEREST         15.81058 17.33367   -8.7868932
FINANCIAL LEVERAGE=EBIT/EBT                    1.067519 1.061223 0.59328487


Leverage ratios interpretation:
PARTICULARS                                            2006     2005 % CHANGE
CURRENT ASSETS                                        43824    38854 12.7914758
CURRENT LIABILITIES                                   48826    43182 13.0702608
QUICK ASSETS(CA-STOCK-PREPAID EXPENSES)                9076     7203 26.0030543
LIQUID ASSETS(CASH,BAN,MARKETABLE SECURITIES)          6414     5488 16.8731778


Liquidity Ratios


PARTICULARS                                           2006       2005 % CHANGE
CURRENT RATIO=CURRENT ASSETS/CURRENT LIABILITIES   0.897555   0.899773   -0.2465591
QUICK RATIO= QUICK ASSETS/CURRENT LIABILITIES      0.185885   0.166806 11.4378382
ABSOLUTE LIQUID RATIO= LIQUID ASSETS/CURRENT
LIABILTIES                                         0.131364    0.12709 3.36332212


Liquidity Ratios Interpretation:
Strength and Weakness of Wal-mart


To conclude about the overall impression of the wal-mart’s performance over this period we
can say that the it is maintaining a good profitability and efficiency as we can observe that
gross profit ,net profit has increased over this period and even company has reduced its
operating expenses to get more operating profits in the 2004 it has ability to reduce operating
expenses . The company is able to generate the good net income over the sales and even the
ROE of the company is above 15 during years 2005 and 2006 so that we can say that company
is in very good position which also shows the company is able to generate the good income
out of the shares holders equity .THE ROE is mainly increased due to the assets to equity which
is observed by the investors. This ROE very importantly is considered by many investors to take
decision in investing in a company rather than considering the EPS as it misguides the investors.
Asset utilization is not that much good but it is not too bad .here it has used the fixed assets
very well in the 2005 to generate more sales and the inventory is replenished very well in this
year only. Then coming to collection period it is really good and even the they were able
convince the creditors very well in having credit sales in the 2005.the company is also able to
acquire more assets with the available equity in the year 2006.it has also increased its shares
holders equity from 2005 to 2006.It is able to attract the investors

                              But the company has to improve a lot in its liquidity position
because it has been far below the ideal situation if it has to meet any short obligations it very
much unable. The very important problem the company facing is that it not able to maintain
the balance between the liquidity and the profitability. It is much concentrating on the
profitability and not at all bothered about the liquidity where it has to be careful. Even it has to
improve in the inventory management .it has to give more assurance to the creditors in
interest payment .the company also has to be watchful in reducing financial leverage aspect so
that more risk is not provided to the share holders .the company has to reduce the operating
expenses to get more net margins.

             Finally as a whole it is having good profitability efficiency and good ROE which is
good sigh for investors. So I advice fund manager to invest in this company

Contenu connexe

Tendances

Financial ratio report
Financial ratio reportFinancial ratio report
Financial ratio reportvaibhav sharma
 
financial ststement ratio analysis
financial ststement ratio analysisfinancial ststement ratio analysis
financial ststement ratio analysisshabir shekh
 
comparative study of banks in nepal
comparative study of banks in nepalcomparative study of banks in nepal
comparative study of banks in nepalManzil Bhattarai
 
Ratio Analysis (Financial Accounting)
Ratio Analysis (Financial Accounting)Ratio Analysis (Financial Accounting)
Ratio Analysis (Financial Accounting)Udara Akalanka
 
Indus Motors Toyota Pakistan Financial Ratio Analysis
Indus Motors Toyota Pakistan Financial Ratio AnalysisIndus Motors Toyota Pakistan Financial Ratio Analysis
Indus Motors Toyota Pakistan Financial Ratio AnalysisMuhammad Zahid
 
CAMEL ANALYSIS OF BIG FOUR BANKS IN INDIA
CAMEL ANALYSIS OF BIG FOUR BANKS IN INDIACAMEL ANALYSIS OF BIG FOUR BANKS IN INDIA
CAMEL ANALYSIS OF BIG FOUR BANKS IN INDIAPradeep Kumar
 
Financial ratio analysis of Nishat mills ltd
Financial ratio analysis of Nishat mills ltdFinancial ratio analysis of Nishat mills ltd
Financial ratio analysis of Nishat mills ltdSoftSol
 
Fundamentals of Financial Ratio Analysis
Fundamentals of Financial Ratio AnalysisFundamentals of Financial Ratio Analysis
Fundamentals of Financial Ratio AnalysisB.V. Raghavendra
 
Ratio Analysis of Bata shoe company
Ratio Analysis of Bata shoe companyRatio Analysis of Bata shoe company
Ratio Analysis of Bata shoe companyJh Labonno
 
Financial Ratios
Financial RatiosFinancial Ratios
Financial Ratiosamitkadam14
 
Financial Analysis & Accounting Case Study - Infosys & TCS
Financial Analysis & Accounting Case Study - Infosys & TCSFinancial Analysis & Accounting Case Study - Infosys & TCS
Financial Analysis & Accounting Case Study - Infosys & TCSIshan Parekh
 
Key Ratio Analysis of Colgate
Key Ratio Analysis of ColgateKey Ratio Analysis of Colgate
Key Ratio Analysis of ColgateAJ Raina
 
Infosys - Financial Analysis
Infosys - Financial AnalysisInfosys - Financial Analysis
Infosys - Financial AnalysisAkash Dhar
 
Cash flow, working capital and dividens
Cash flow, working capital and dividensCash flow, working capital and dividens
Cash flow, working capital and dividensasgill3
 
Ratio analysis project on ONGC of year 2010-11 & 2011-12
Ratio analysis project on ONGC of  year 2010-11 & 2011-12Ratio analysis project on ONGC of  year 2010-11 & 2011-12
Ratio analysis project on ONGC of year 2010-11 & 2011-12Arjun Negi
 
ratio analysis of hero motocorp ltd.
ratio analysis of hero motocorp ltd.ratio analysis of hero motocorp ltd.
ratio analysis of hero motocorp ltd.amritpal kaur
 
Capital Structure of banking companies
Capital Structure of banking companiesCapital Structure of banking companies
Capital Structure of banking companiesParnavi Chakraborty
 

Tendances (20)

Financial ratio report
Financial ratio reportFinancial ratio report
Financial ratio report
 
financial ststement ratio analysis
financial ststement ratio analysisfinancial ststement ratio analysis
financial ststement ratio analysis
 
comparative study of banks in nepal
comparative study of banks in nepalcomparative study of banks in nepal
comparative study of banks in nepal
 
Ratio Analysis (Financial Accounting)
Ratio Analysis (Financial Accounting)Ratio Analysis (Financial Accounting)
Ratio Analysis (Financial Accounting)
 
Lec10 11 financial ratio analysis
Lec10 11 financial ratio analysisLec10 11 financial ratio analysis
Lec10 11 financial ratio analysis
 
Indus Motors Toyota Pakistan Financial Ratio Analysis
Indus Motors Toyota Pakistan Financial Ratio AnalysisIndus Motors Toyota Pakistan Financial Ratio Analysis
Indus Motors Toyota Pakistan Financial Ratio Analysis
 
CAMEL ANALYSIS OF BIG FOUR BANKS IN INDIA
CAMEL ANALYSIS OF BIG FOUR BANKS IN INDIACAMEL ANALYSIS OF BIG FOUR BANKS IN INDIA
CAMEL ANALYSIS OF BIG FOUR BANKS IN INDIA
 
Financial ratio analysis of Nishat mills ltd
Financial ratio analysis of Nishat mills ltdFinancial ratio analysis of Nishat mills ltd
Financial ratio analysis of Nishat mills ltd
 
Engro Foods Ratio Analysis
Engro Foods   Ratio AnalysisEngro Foods   Ratio Analysis
Engro Foods Ratio Analysis
 
Fundamentals of Financial Ratio Analysis
Fundamentals of Financial Ratio AnalysisFundamentals of Financial Ratio Analysis
Fundamentals of Financial Ratio Analysis
 
Ratio Analysis of Bata shoe company
Ratio Analysis of Bata shoe companyRatio Analysis of Bata shoe company
Ratio Analysis of Bata shoe company
 
Financial Ratios
Financial RatiosFinancial Ratios
Financial Ratios
 
Financial Analysis & Accounting Case Study - Infosys & TCS
Financial Analysis & Accounting Case Study - Infosys & TCSFinancial Analysis & Accounting Case Study - Infosys & TCS
Financial Analysis & Accounting Case Study - Infosys & TCS
 
Key Ratio Analysis of Colgate
Key Ratio Analysis of ColgateKey Ratio Analysis of Colgate
Key Ratio Analysis of Colgate
 
Infosys - Financial Analysis
Infosys - Financial AnalysisInfosys - Financial Analysis
Infosys - Financial Analysis
 
Cash flow, working capital and dividens
Cash flow, working capital and dividensCash flow, working capital and dividens
Cash flow, working capital and dividens
 
Ratio Analysis
Ratio AnalysisRatio Analysis
Ratio Analysis
 
Ratio analysis project on ONGC of year 2010-11 & 2011-12
Ratio analysis project on ONGC of  year 2010-11 & 2011-12Ratio analysis project on ONGC of  year 2010-11 & 2011-12
Ratio analysis project on ONGC of year 2010-11 & 2011-12
 
ratio analysis of hero motocorp ltd.
ratio analysis of hero motocorp ltd.ratio analysis of hero motocorp ltd.
ratio analysis of hero motocorp ltd.
 
Capital Structure of banking companies
Capital Structure of banking companiesCapital Structure of banking companies
Capital Structure of banking companies
 

En vedette

Final wal mart
Final wal martFinal wal mart
Final wal martbotirkhon
 
Impact of FDI on Indian Banking Sector
Impact of FDI on Indian Banking Sector Impact of FDI on Indian Banking Sector
Impact of FDI on Indian Banking Sector venkatesh yadav
 
Fdi in indian banking system
Fdi in indian banking systemFdi in indian banking system
Fdi in indian banking systemSourabh Modgil
 
accounting ratios and interpretation, Pepsi vs coca cola,
accounting ratios and interpretation, Pepsi vs coca cola, accounting ratios and interpretation, Pepsi vs coca cola,
accounting ratios and interpretation, Pepsi vs coca cola, Priyesh Chheda
 
Pepsi & Coca Cola Financial Analysis
Pepsi & Coca Cola Financial AnalysisPepsi & Coca Cola Financial Analysis
Pepsi & Coca Cola Financial AnalysisHassan Shahzad
 

En vedette (8)

Final wal mart
Final wal martFinal wal mart
Final wal mart
 
Impact of FDI on Indian Banking Sector
Impact of FDI on Indian Banking Sector Impact of FDI on Indian Banking Sector
Impact of FDI on Indian Banking Sector
 
Fdi in indian banking system
Fdi in indian banking systemFdi in indian banking system
Fdi in indian banking system
 
HDFC Bank
HDFC BankHDFC Bank
HDFC Bank
 
Comparative ratio analysis
Comparative ratio analysisComparative ratio analysis
Comparative ratio analysis
 
accounting ratios and interpretation, Pepsi vs coca cola,
accounting ratios and interpretation, Pepsi vs coca cola, accounting ratios and interpretation, Pepsi vs coca cola,
accounting ratios and interpretation, Pepsi vs coca cola,
 
Pepsi & Coca Cola Financial Analysis
Pepsi & Coca Cola Financial AnalysisPepsi & Coca Cola Financial Analysis
Pepsi & Coca Cola Financial Analysis
 
PepsiCo 2014 Presentation
PepsiCo 2014 Presentation PepsiCo 2014 Presentation
PepsiCo 2014 Presentation
 

Similaire à Brief History and Shareholding of HDFC Bank

Icici Bank Rm Project
Icici Bank Rm ProjectIcici Bank Rm Project
Icici Bank Rm ProjectAbhay pratap
 
HDFC Standard Life Insurance Co- Group 1.pptx
HDFC Standard Life Insurance Co- Group 1.pptxHDFC Standard Life Insurance Co- Group 1.pptx
HDFC Standard Life Insurance Co- Group 1.pptxParthGarg58
 
Reforming india’s financial system
Reforming india’s financial systemReforming india’s financial system
Reforming india’s financial systemShaivikharbikar1
 
SBI Life insurance
SBI Life insurance SBI Life insurance
SBI Life insurance Vishnu V
 
Industrial finance in india new
Industrial finance in india newIndustrial finance in india new
Industrial finance in india new8880003684
 
Comparative analysis of insurance market in india on hdfc-life-1-1
Comparative analysis of insurance market in india on hdfc-life-1-1Comparative analysis of insurance market in india on hdfc-life-1-1
Comparative analysis of insurance market in india on hdfc-life-1-1Flex
 
Project in e i-c analysis @il&f invest smart stock ltd mba finance
Project in e i-c analysis @il&f invest smart stock ltd mba financeProject in e i-c analysis @il&f invest smart stock ltd mba finance
Project in e i-c analysis @il&f invest smart stock ltd mba financeBabasab Patil
 
Project in e i-c analysis at aif investment ltd mba finance project
Project in e i-c analysis at aif investment ltd mba finance projectProject in e i-c analysis at aif investment ltd mba finance project
Project in e i-c analysis at aif investment ltd mba finance projectBabasab Patil
 
Iii post liberelisation
Iii post liberelisationIii post liberelisation
Iii post liberelisationCarol Peters
 
Project Report On Mutual fund
Project Report On Mutual fund Project Report On Mutual fund
Project Report On Mutual fund Amit Dazz
 
Mutualfundamit 130926045819-phpapp01
Mutualfundamit 130926045819-phpapp01Mutualfundamit 130926045819-phpapp01
Mutualfundamit 130926045819-phpapp01SantoshKale22
 
financial analysis of icici prudential life insurance
financial analysis of icici prudential life insurancefinancial analysis of icici prudential life insurance
financial analysis of icici prudential life insuranceamit soni
 
Ratio analysis at il&fs invest smart mba project finance
Ratio analysis at il&fs invest smart mba project financeRatio analysis at il&fs invest smart mba project finance
Ratio analysis at il&fs invest smart mba project financeBabasab Patil
 
52571626 indian-insurance 2
52571626 indian-insurance 252571626 indian-insurance 2
52571626 indian-insurance 2Varsha Singh
 
52571626 indian-insurance 2
52571626 indian-insurance 252571626 indian-insurance 2
52571626 indian-insurance 2Varsha Singh
 
Financial Services in India
Financial Services in IndiaFinancial Services in India
Financial Services in Indiasujit kumar
 
IRDA and claims of insurance
IRDA and claims of insuranceIRDA and claims of insurance
IRDA and claims of insurancegursaman maan
 
equity reserach
equity reserachequity reserach
equity reserachVajir Baji
 

Similaire à Brief History and Shareholding of HDFC Bank (20)

Icici Bank Rm Project
Icici Bank Rm ProjectIcici Bank Rm Project
Icici Bank Rm Project
 
HDFC Standard Life Insurance Co- Group 1.pptx
HDFC Standard Life Insurance Co- Group 1.pptxHDFC Standard Life Insurance Co- Group 1.pptx
HDFC Standard Life Insurance Co- Group 1.pptx
 
Reforming india’s financial system
Reforming india’s financial systemReforming india’s financial system
Reforming india’s financial system
 
SBI Life insurance
SBI Life insurance SBI Life insurance
SBI Life insurance
 
Industrial finance in india new
Industrial finance in india newIndustrial finance in india new
Industrial finance in india new
 
Comparative analysis of insurance market in india on hdfc-life-1-1
Comparative analysis of insurance market in india on hdfc-life-1-1Comparative analysis of insurance market in india on hdfc-life-1-1
Comparative analysis of insurance market in india on hdfc-life-1-1
 
Project in e i-c analysis @il&f invest smart stock ltd mba finance
Project in e i-c analysis @il&f invest smart stock ltd mba financeProject in e i-c analysis @il&f invest smart stock ltd mba finance
Project in e i-c analysis @il&f invest smart stock ltd mba finance
 
Project in e i-c analysis at aif investment ltd mba finance project
Project in e i-c analysis at aif investment ltd mba finance projectProject in e i-c analysis at aif investment ltd mba finance project
Project in e i-c analysis at aif investment ltd mba finance project
 
Iii post liberelisation
Iii post liberelisationIii post liberelisation
Iii post liberelisation
 
Project Report On Mutual fund
Project Report On Mutual fund Project Report On Mutual fund
Project Report On Mutual fund
 
Mutualfundamit 130926045819-phpapp01
Mutualfundamit 130926045819-phpapp01Mutualfundamit 130926045819-phpapp01
Mutualfundamit 130926045819-phpapp01
 
NBFI.pptx
NBFI.pptxNBFI.pptx
NBFI.pptx
 
financial analysis of icici prudential life insurance
financial analysis of icici prudential life insurancefinancial analysis of icici prudential life insurance
financial analysis of icici prudential life insurance
 
Cp ppt
Cp pptCp ppt
Cp ppt
 
Ratio analysis at il&fs invest smart mba project finance
Ratio analysis at il&fs invest smart mba project financeRatio analysis at il&fs invest smart mba project finance
Ratio analysis at il&fs invest smart mba project finance
 
52571626 indian-insurance 2
52571626 indian-insurance 252571626 indian-insurance 2
52571626 indian-insurance 2
 
52571626 indian-insurance 2
52571626 indian-insurance 252571626 indian-insurance 2
52571626 indian-insurance 2
 
Financial Services in India
Financial Services in IndiaFinancial Services in India
Financial Services in India
 
IRDA and claims of insurance
IRDA and claims of insuranceIRDA and claims of insurance
IRDA and claims of insurance
 
equity reserach
equity reserachequity reserach
equity reserach
 

Plus de samarpita27

Impact of celebraity endorsment
Impact of celebraity endorsmentImpact of celebraity endorsment
Impact of celebraity endorsmentsamarpita27
 
Brand extension ppt
Brand extension pptBrand extension ppt
Brand extension pptsamarpita27
 
Advertisment and planing
Advertisment and planingAdvertisment and planing
Advertisment and planingsamarpita27
 
Economic value added
Economic value addedEconomic value added
Economic value addedsamarpita27
 
Corporate governance
Corporate governanceCorporate governance
Corporate governancesamarpita27
 
Limited libility patnership
Limited libility patnershipLimited libility patnership
Limited libility patnershipsamarpita27
 
Evalution of opportunity
Evalution of opportunityEvalution of opportunity
Evalution of opportunitysamarpita27
 
Opportunity identification
Opportunity identificationOpportunity identification
Opportunity identificationsamarpita27
 
Enterprernurship
EnterprernurshipEnterprernurship
Enterprernurshipsamarpita27
 
Entrepreneurial planning sesion 9
Entrepreneurial planning sesion 9Entrepreneurial planning sesion 9
Entrepreneurial planning sesion 9samarpita27
 

Plus de samarpita27 (13)

Selco case
Selco caseSelco case
Selco case
 
Impact of celebraity endorsment
Impact of celebraity endorsmentImpact of celebraity endorsment
Impact of celebraity endorsment
 
Credit risk mgt
Credit risk mgtCredit risk mgt
Credit risk mgt
 
Brand extension ppt
Brand extension pptBrand extension ppt
Brand extension ppt
 
Advertisment and planing
Advertisment and planingAdvertisment and planing
Advertisment and planing
 
Economic value added
Economic value addedEconomic value added
Economic value added
 
Corporate governance
Corporate governanceCorporate governance
Corporate governance
 
Limited libility patnership
Limited libility patnershipLimited libility patnership
Limited libility patnership
 
Evalution of opportunity
Evalution of opportunityEvalution of opportunity
Evalution of opportunity
 
Opportunity identification
Opportunity identificationOpportunity identification
Opportunity identification
 
Enterprernurship
EnterprernurshipEnterprernurship
Enterprernurship
 
Entrepreneurial planning sesion 9
Entrepreneurial planning sesion 9Entrepreneurial planning sesion 9
Entrepreneurial planning sesion 9
 
business law
business lawbusiness law
business law
 

Dernier

Unlocking the Secrets of Affiliate Marketing.pdf
Unlocking the Secrets of Affiliate Marketing.pdfUnlocking the Secrets of Affiliate Marketing.pdf
Unlocking the Secrets of Affiliate Marketing.pdfOnline Income Engine
 
It will be International Nurses' Day on 12 May
It will be International Nurses' Day on 12 MayIt will be International Nurses' Day on 12 May
It will be International Nurses' Day on 12 MayNZSG
 
Best VIP Call Girls Noida Sector 40 Call Me: 8448380779
Best VIP Call Girls Noida Sector 40 Call Me: 8448380779Best VIP Call Girls Noida Sector 40 Call Me: 8448380779
Best VIP Call Girls Noida Sector 40 Call Me: 8448380779Delhi Call girls
 
Value Proposition canvas- Customer needs and pains
Value Proposition canvas- Customer needs and painsValue Proposition canvas- Customer needs and pains
Value Proposition canvas- Customer needs and painsP&CO
 
Lucknow 💋 Escorts in Lucknow - 450+ Call Girl Cash Payment 8923113531 Neha Th...
Lucknow 💋 Escorts in Lucknow - 450+ Call Girl Cash Payment 8923113531 Neha Th...Lucknow 💋 Escorts in Lucknow - 450+ Call Girl Cash Payment 8923113531 Neha Th...
Lucknow 💋 Escorts in Lucknow - 450+ Call Girl Cash Payment 8923113531 Neha Th...anilsa9823
 
0183760ssssssssssssssssssssssssssss00101011 (27).pdf
0183760ssssssssssssssssssssssssssss00101011 (27).pdf0183760ssssssssssssssssssssssssssss00101011 (27).pdf
0183760ssssssssssssssssssssssssssss00101011 (27).pdfRenandantas16
 
Pharma Works Profile of Karan Communications
Pharma Works Profile of Karan CommunicationsPharma Works Profile of Karan Communications
Pharma Works Profile of Karan Communicationskarancommunications
 
VIP Call Girls In Saharaganj ( Lucknow ) 🔝 8923113531 🔝 Cash Payment (COD) 👒
VIP Call Girls In Saharaganj ( Lucknow  ) 🔝 8923113531 🔝  Cash Payment (COD) 👒VIP Call Girls In Saharaganj ( Lucknow  ) 🔝 8923113531 🔝  Cash Payment (COD) 👒
VIP Call Girls In Saharaganj ( Lucknow ) 🔝 8923113531 🔝 Cash Payment (COD) 👒anilsa9823
 
VIP Call Girl Jamshedpur Aashi 8250192130 Independent Escort Service Jamshedpur
VIP Call Girl Jamshedpur Aashi 8250192130 Independent Escort Service JamshedpurVIP Call Girl Jamshedpur Aashi 8250192130 Independent Escort Service Jamshedpur
VIP Call Girl Jamshedpur Aashi 8250192130 Independent Escort Service JamshedpurSuhani Kapoor
 
Best Basmati Rice Manufacturers in India
Best Basmati Rice Manufacturers in IndiaBest Basmati Rice Manufacturers in India
Best Basmati Rice Manufacturers in IndiaShree Krishna Exports
 
HONOR Veterans Event Keynote by Michael Hawkins
HONOR Veterans Event Keynote by Michael HawkinsHONOR Veterans Event Keynote by Michael Hawkins
HONOR Veterans Event Keynote by Michael HawkinsMichael W. Hawkins
 
Monthly Social Media Update April 2024 pptx.pptx
Monthly Social Media Update April 2024 pptx.pptxMonthly Social Media Update April 2024 pptx.pptx
Monthly Social Media Update April 2024 pptx.pptxAndy Lambert
 
Understanding the Pakistan Budgeting Process: Basics and Key Insights
Understanding the Pakistan Budgeting Process: Basics and Key InsightsUnderstanding the Pakistan Budgeting Process: Basics and Key Insights
Understanding the Pakistan Budgeting Process: Basics and Key Insightsseribangash
 
Call Girls Pune Just Call 9907093804 Top Class Call Girl Service Available
Call Girls Pune Just Call 9907093804 Top Class Call Girl Service AvailableCall Girls Pune Just Call 9907093804 Top Class Call Girl Service Available
Call Girls Pune Just Call 9907093804 Top Class Call Girl Service AvailableDipal Arora
 
GD Birla and his contribution in management
GD Birla and his contribution in managementGD Birla and his contribution in management
GD Birla and his contribution in managementchhavia330
 
Cash Payment 9602870969 Escort Service in Udaipur Call Girls
Cash Payment 9602870969 Escort Service in Udaipur Call GirlsCash Payment 9602870969 Escort Service in Udaipur Call Girls
Cash Payment 9602870969 Escort Service in Udaipur Call GirlsApsara Of India
 
Progress Report - Oracle Database Analyst Summit
Progress  Report - Oracle Database Analyst SummitProgress  Report - Oracle Database Analyst Summit
Progress Report - Oracle Database Analyst SummitHolger Mueller
 
Insurers' journeys to build a mastery in the IoT usage
Insurers' journeys to build a mastery in the IoT usageInsurers' journeys to build a mastery in the IoT usage
Insurers' journeys to build a mastery in the IoT usageMatteo Carbone
 

Dernier (20)

Unlocking the Secrets of Affiliate Marketing.pdf
Unlocking the Secrets of Affiliate Marketing.pdfUnlocking the Secrets of Affiliate Marketing.pdf
Unlocking the Secrets of Affiliate Marketing.pdf
 
It will be International Nurses' Day on 12 May
It will be International Nurses' Day on 12 MayIt will be International Nurses' Day on 12 May
It will be International Nurses' Day on 12 May
 
Best VIP Call Girls Noida Sector 40 Call Me: 8448380779
Best VIP Call Girls Noida Sector 40 Call Me: 8448380779Best VIP Call Girls Noida Sector 40 Call Me: 8448380779
Best VIP Call Girls Noida Sector 40 Call Me: 8448380779
 
Value Proposition canvas- Customer needs and pains
Value Proposition canvas- Customer needs and painsValue Proposition canvas- Customer needs and pains
Value Proposition canvas- Customer needs and pains
 
Lucknow 💋 Escorts in Lucknow - 450+ Call Girl Cash Payment 8923113531 Neha Th...
Lucknow 💋 Escorts in Lucknow - 450+ Call Girl Cash Payment 8923113531 Neha Th...Lucknow 💋 Escorts in Lucknow - 450+ Call Girl Cash Payment 8923113531 Neha Th...
Lucknow 💋 Escorts in Lucknow - 450+ Call Girl Cash Payment 8923113531 Neha Th...
 
0183760ssssssssssssssssssssssssssss00101011 (27).pdf
0183760ssssssssssssssssssssssssssss00101011 (27).pdf0183760ssssssssssssssssssssssssssss00101011 (27).pdf
0183760ssssssssssssssssssssssssssss00101011 (27).pdf
 
Pharma Works Profile of Karan Communications
Pharma Works Profile of Karan CommunicationsPharma Works Profile of Karan Communications
Pharma Works Profile of Karan Communications
 
VIP Call Girls In Saharaganj ( Lucknow ) 🔝 8923113531 🔝 Cash Payment (COD) 👒
VIP Call Girls In Saharaganj ( Lucknow  ) 🔝 8923113531 🔝  Cash Payment (COD) 👒VIP Call Girls In Saharaganj ( Lucknow  ) 🔝 8923113531 🔝  Cash Payment (COD) 👒
VIP Call Girls In Saharaganj ( Lucknow ) 🔝 8923113531 🔝 Cash Payment (COD) 👒
 
VIP Call Girl Jamshedpur Aashi 8250192130 Independent Escort Service Jamshedpur
VIP Call Girl Jamshedpur Aashi 8250192130 Independent Escort Service JamshedpurVIP Call Girl Jamshedpur Aashi 8250192130 Independent Escort Service Jamshedpur
VIP Call Girl Jamshedpur Aashi 8250192130 Independent Escort Service Jamshedpur
 
Best Basmati Rice Manufacturers in India
Best Basmati Rice Manufacturers in IndiaBest Basmati Rice Manufacturers in India
Best Basmati Rice Manufacturers in India
 
HONOR Veterans Event Keynote by Michael Hawkins
HONOR Veterans Event Keynote by Michael HawkinsHONOR Veterans Event Keynote by Michael Hawkins
HONOR Veterans Event Keynote by Michael Hawkins
 
Monthly Social Media Update April 2024 pptx.pptx
Monthly Social Media Update April 2024 pptx.pptxMonthly Social Media Update April 2024 pptx.pptx
Monthly Social Media Update April 2024 pptx.pptx
 
Understanding the Pakistan Budgeting Process: Basics and Key Insights
Understanding the Pakistan Budgeting Process: Basics and Key InsightsUnderstanding the Pakistan Budgeting Process: Basics and Key Insights
Understanding the Pakistan Budgeting Process: Basics and Key Insights
 
Call Girls Pune Just Call 9907093804 Top Class Call Girl Service Available
Call Girls Pune Just Call 9907093804 Top Class Call Girl Service AvailableCall Girls Pune Just Call 9907093804 Top Class Call Girl Service Available
Call Girls Pune Just Call 9907093804 Top Class Call Girl Service Available
 
Forklift Operations: Safety through Cartoons
Forklift Operations: Safety through CartoonsForklift Operations: Safety through Cartoons
Forklift Operations: Safety through Cartoons
 
GD Birla and his contribution in management
GD Birla and his contribution in managementGD Birla and his contribution in management
GD Birla and his contribution in management
 
VVVIP Call Girls In Greater Kailash ➡️ Delhi ➡️ 9999965857 🚀 No Advance 24HRS...
VVVIP Call Girls In Greater Kailash ➡️ Delhi ➡️ 9999965857 🚀 No Advance 24HRS...VVVIP Call Girls In Greater Kailash ➡️ Delhi ➡️ 9999965857 🚀 No Advance 24HRS...
VVVIP Call Girls In Greater Kailash ➡️ Delhi ➡️ 9999965857 🚀 No Advance 24HRS...
 
Cash Payment 9602870969 Escort Service in Udaipur Call Girls
Cash Payment 9602870969 Escort Service in Udaipur Call GirlsCash Payment 9602870969 Escort Service in Udaipur Call Girls
Cash Payment 9602870969 Escort Service in Udaipur Call Girls
 
Progress Report - Oracle Database Analyst Summit
Progress  Report - Oracle Database Analyst SummitProgress  Report - Oracle Database Analyst Summit
Progress Report - Oracle Database Analyst Summit
 
Insurers' journeys to build a mastery in the IoT usage
Insurers' journeys to build a mastery in the IoT usageInsurers' journeys to build a mastery in the IoT usage
Insurers' journeys to build a mastery in the IoT usage
 

Brief History and Shareholding of HDFC Bank

  • 1. BRIEF HISTORY OF HDFC BANK: Housing Development Finance Corporation Limited, more popularly known as HDFC Bank Ltd, was established in the year 1994, as a part of the liberalization of the Indian Banking Industry by Reserve Bank of India (RBI). It was one of the first banks to receive an 'in principle' approval from RBI, for setting up a bank in the private sector. The bank was incorporated with the name 'HDFC Bank Limited', with its registered office in Mumbai. The following year, it started its operations as a Scheduled Commercial Bank. Today, the bank boasts of as many as 1412 branches and over 3275 ATMs across India. Amalgamations In 2002, HDFC Bank witnessed its merger with Times Bank Limited (a private sector bank promoted by Bennett, Coleman & Co. / Times Group). With this, HDFC and Times became the first two private banks in the New Generation Private Sector Banks to have gone through a merger. In 2008, RBI approved the amalgamation of Centurion Bank of Punjab with HDFC Bank. With this, the Deposits of the merged entity became Rs. 1,22,000 crore, while the Advances were Rs. 89,000 crore and Balance Sheet size was Rs. 1,63,000 crore.. Tech-Savvy HDFC Bank has always prided itself on a highly automated environment, be it in terms of information technology or communication systems. All the braches of the bank boast of online connectivity with the other, ensuring speedy funds transfer for the clients. At the same time, the bank's branch network and Automated Teller Machines (ATMs) allow multi-branch access to retail clients. The bank makes use of its up-to-date technology, along with market position and expertise, to create a competitive advantage and build market share. Capital Structure At present, HDFC Bank boasts of an authorized capital of Rs 550 crore (Rs5.5 billion), of this the paid-up amount is Rs 424.6 crore (Rs.4.2 billion). In terms of equity share, the HDFC Group holds 19.4%. Foreign Institutional Investors (FIIs) have around 28% of the equity and about 17.6% is held by the ADS Depository (in respect of the bank's American Depository Shares (ADS) Issue). The bank has about 570,000 shareholders. Its shares find a listing on the Stock Exchange, Mumbai and National Stock Exchange, while its American Depository Shares are listed on the New York Stock Exchange (NYSE), under the symbol 'HDB'. Products & services: Personal Banking: Savings Accounts, Salary Accounts, Current Accounts, Fixed Deposits, Demat Account, Safe Deposit Lockers, Loans, Credit Cards, Debit Cards, Prepaid Cards, Investments & Insurance,
  • 2. Forex Services, Payment Services, Net Banking , Insta Alerts, Mobile Banking , Insta Query , ATM & Phone Banking. NRI Banking Rupee Current Accounts, Rupee Savings Accounts, Rupee Fixed Deposits ,Foreign Currency Deposits, Accounts for Returning Indians, Quickremit (North America, UK, Europe, Southeast Asia), IndiaLink (Middle East, Africa), Cheque LockBox, Telegraphic / Wire Transfer, Funds Transfer through Cheques / DDs / TCs, Mutual Funds, Private Banking, Portfolio Investment Schemes, Loans, Payment Services, Net Banking , Insta Alerts , Mobile, Banking, Insta Query , ATM ,Phone Banking. SHAREHOLDING PATTERN AS ON 30TH SEPTEMBER 2009: The shareholders are divided in to two categories : shareholding of promoter and promoter group public shareholding Under the first category (shareholding of promoter and promoter group) we have subcategories they are: Indian Foreign Under Indian, the corporate bodies are the promoters(total no.of shareholders are four)who holds 82443000 shares which accounts to 19.29% of the total shares. There are no foreign promoters in this company. There has not been any change in the total no of shares when compared with the previous two quarters. Under the second category (public shareholding) we have sub divisions they are : Institutions Non-institutions Under the institutions , the foreign institutional investors(total no of shareholders are 522) holds the major part i.e 120326279 shares which accounts to 28%.When compared with the previous two quarters it has been increased by 3%.The next major shareholders are the insurance companies(total no of shareholders are 27) that holds 33661939 shares which accounts to 7.88 % and when compared with previous two quarters there has been a negligible increase. The institutional shareholders sum up to 40.62%. The non institutions are the other investors like the private corporate bodies who holds 39281016 shares which accounts to 9.18% of the total shares and the others hold 80595303 shares which accounts to 18.86%.The shares with the general public is 45148741 which accounts to 10.565
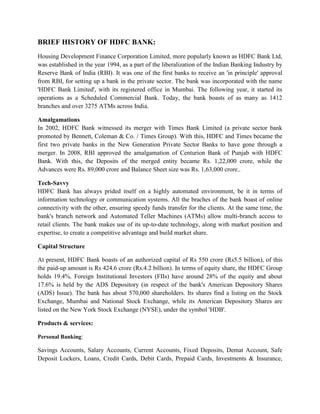
  • 3. and when compared with the previous two quarters there has been a slight decrease. The total no of shares are 427348828 and all the percentages sum up to 100. PERCENTAGE OF PARTICULARS SHARES PROMOTER GROUP 19.2913 MUTUAL FUNDS/UTI 4.5877 OTHERS 0.0903 INSURANCE COMPANIES 7.788 FOREIGN INSTITUTIONAL INVESTORS 28.1559 BODIES CORPORATE 9.1916 INDIVIDUALS- UPTO 1 LAKH 8.0176 INDIVIDUALS- ABOVE 1 LAKH 2.5471 NON RESIDENTS 1.4718 DEPOSITORY RECIEPTS 18.859 PERCENTAGE OF SHARES NON DEPOSITORY PROMOTER RESIDENTS RECIEPTS GROUP 1% 19% 19% MUTUAL INDIVIDUALS- FUNDS/UTI ABOVE 1 LAKH 5% 3% OTHERS INDIVIDUALS- 0% INSURANCE UPTO 1 LAKH COMPANIES 8% 8% BODIES CORPORATE 9% FOREIGN INSTITUTIONAL INVESTORS 28%
  • 4. PROMOTER: HDFC is India's premier housing finance company and enjoys an impeccable track record in India as well as in international markets. Since its inception in 1977, the Corporation has maintained a consistent and healthy growth in its operations to remain the market leader in mortgages. Its outstanding loan portfolio covers well over a million dwelling units. HDFC has developed significant expertise in retail mortgage loans to different market segments and also has a large corporate client base for its housing related credit facilities. With its experience in the financial markets, a strong market reputation, large shareholder base and unique consumer franchise, HDFC was ideally positioned to promote a bank in the Indian environment. CONTENTS OF THE ANNUAL REPORT- Director’s report- Service quality initiatives include the audit of services and improvement on the areas identified on the basis of customer feedback on experiences at various touch-points. New elements were added and renewed improvement schemes were installed using technology to ensure customer convenience, security of transactions and reduce transaction cost. Risk Management & Portfolio Quality- The Bank in the course of its business is exposed to various risks, of which the most important are credit risk, market risk (including liquidity risk and price risk) and operational risk. The identification, measurement, monitoring and control of risks remain key aspects of the Bank’s risk management system. Sound risk management supported by a balanced risk-reward trade-off is critical to achieving the Bank’s business strategy for business and revenue growth. The Bank has distinct policies and processes in place for the retail and wholesale businesses. The INTERNAL AUDIT & COMPLIANCE- The Bank has Internal Audit & Compliance functions which are responsible for independently evaluating the adequacy of all internal controls and ensuring operating and business units adhere to internal processes and procedures as well as to regulatory and legal requirements. The audit function also proactively recommends improvements in operational processes and service quality. To ensure independence, the Audit department has a reporting line to the Chairman of the Board of Directors and the Audit & Compliance Committee of the Board and only indirectly to the Managing Director. CORPORATE SOCIAL RESPONSIBILITY- As its operations have grown your bank has retained its focus onvarious areas of corporate sustainability that impact the socio economic ecosystem that we are part of. HDFC Bank’s focus in the area of corporate sustainability includes social sustainability & social welfare and financial inclusion.
  • 5. Social Sustainability & Social Welfare- The bank has initiated a number of programs to encourage economic, social and educational development within the communities that it operates; while at the same time contributing to several grass root level development programs across these geographies. . STATUTORY DISCLOSURES The information required under Section 217(2A) of the Companies Act, 1956. and the rules made thereunder, are given in the annexure appended hereto and forms part of this report. DIRECTORS Mr. Vineet Jain resigned as a Director of the Bank with effect from December 27, 2008. Mr. Arvind Pande and Mr. Ashim Samanta retire by rotation atthe ensuing Annual General Meeting and being eligible offer themselves for re-appointment. AUDITORS- The Auditors M/s. Haribhakti & Co., Chartered Accountants will retire at the conclusion of the forthcoming Annual General Meeting and are eligible for re-appointment. AUDITOR’S REPORT The attached Balance Sheet of HDFC Bank Limited audited (“the Bank”) as at 31 March 2009 and also the Profit and Loss Account of the Bank and the Cash Flow statement. We conducted our audit in accordance with auditing standards generally accepted in India.The An audit includes examining, on a test basis, evidence supporting the amounts and disclosures in the financial statements. INFORMATION OF ACCOUNTS OF THE COMPANY- Balance sheet on date 2008-09(In thousands) ITEMS 2009 2008 Capital 4,253,841 3,544,329 Equity share warrents 4,009,158 - Reseves and surplus 142,209,460 111,428,076 Total Assests 1,832,707, 1,331,766,032
  • 6. Current assests 135,272,112 125,531,766 Fixed assests 17,067,290 11,750,917 The current year capital shows an increment with that of previous year by 16.67% About the deviation of equity share can’t be predicted du to insufficient data.the company showsa high amount of reserves and surplus which may due to the high percentage of general reseve and amalgamation reserve. INFORMATION ABOUT THE P&L ACCOUNT OF THE COMPANY(In thousands) ITEMS 2009 2008 INCOME 196,228,646 123,981,512 EXPENDITURE 173,779,254 108,079,582 PROFIT 48,195,737 35,222,327 APPROPRIATIONS 48,195,737 35,222,327 EARNINGS PER EQUITY 52.85 46.22 SHARE (Face value Rs. 10 per share) A) Basic The income increased by 36.817% may be due to high operating income ratio.There is an considerable increase inexpendeture in current year by 37.806% compared to last year.The company has also mainted a good profit increment for the current year which is almost 27%. INFORAMAION ABOUT THE CASH FLOW ACTIVITY OF THE COMPANY(In thousands) ITEMS 2009 2008 Net cash flow from / (used in) (17,361,421) 27,231,256 operating activities Net cash generated from 29,646,633 36,283,464 financing activities Net cash used in investing (6,637,774) (6,197,812) The net cash flow in the current year shows a considerable increase by 56.88%. The financing activity ratio also increased by2256%. About the balance sheet- The company has Authoristed shares 55,00,00,000 ( 31 March, 2008 : 55,00,00,000) Equity Shares of Rs. 10/- each, out of which 42,53,84,109 (31 March, 2008 : 35,44,32,920) Equity Shares of Rs. 10/- eachare issued. The company comprises of following type of reseves- Types 2009 2008 Statutory Reserve 22,987,291 15,193,539 General Reserve 7,360,523 5,115,584
  • 7. Amalgamation Reserve 10,635,564 145,218 Capital Reserve 956,510 17,850 Investment Reserve 276,250 414,800 Account The company has a propose divedend 27,206,229 for the year 2009(figs are in thousands) Also it has a bill payable 29224,076 for the current year as current libillites. Next, the current assest i.e if u see the cash in hand for te current year is 15,861,868 Gross block for the current year is 7,160,665, which is a 26.76% increment then the previous year. Net block for the current year is 11,311,063 and previous 7,322,171 which is a 9.352% increased percentage. Fixed assets are stated at cost less accumulated depreciation as adjusted for impairment, if any. Cost includes cost of purchase and all expenditure like site preparation, installation costs and professional fees incurred on the asset before it is ready to use. Subsequent expenditure incurred on assets put to use is capitalized only when it increases the future benefit/functioning capability from/of such assets. Depreciation is charged over the estimated useful life of the fixed asset on a straight-line basis. Income tax comprises the current tax provision, the net change in the deferred tax asset or liability in the year and fringe benefit tax. Deferred tax assets and liabilities are recognised for the future tax consequences of timing differences between the carrying values of assets and liabilities and their respective tax bases, and operating loss carry forwards. . Statement pursuant to Section 212 of the Companies Act, 1956, relating to subsidiary Companies Name of the subsidiary HDFC Securities Ltd. HDB Financial Services Ltd. Capital 1,500 10,501 Reserves and Surplus 8,025 (1,288) Total Assets 20,599 19,588 Total Liabilities 11,074 10,375 Investments _ _ Turnover 12,466 2,354 Profit / (Loss) Before Taxation 2,809 (919) Provision for Taxation (1,152) (9) Profit / (Loss) After Taxation 1,657 (928) Proposed Dividend including tax 35 _ The New Capital Adequacy Framework is applicable to HDFC Bank Limited (hereinafter referred to as the Bank) and its two subsidiaries (HDFC Securities Ltd. and HDB Financial Services Private Ltd.) which together constitutes the group in line with. CAPITAL STRUCTURE- Capital funds are classified into Tier I and Tier II capital under the capital adequacy framework. Tier I capital includes paid-up equity capital, statutory reserves, other disclosed free reserves, capital reserves
  • 8. and innovative perpetual debt instruments . Elements of Tier II capital include revaluation reserve, if any, general provision for standard assets, CAPITAL ADEQECY- The Bank has a process for assessing its overall Capital ,Adequacy in relation to their risk profile and a strategy for maintaining their capital level. The process provides an assurance that the Bank has adequate capital to support all risk in its business and an appropriate capital buffer based on its business profile. The Bank has a structured management framework in the internal capital adequacy assessment process for the identification and evaluation of the significance of all risks that the Bank faces, which may have an adverse material impact on its financial position. The Bank considers the following risks as material risks Credit Risk �Market Risk �Interest Rate Risk in the Banking Book �Liquidity Risk �Credit Concentration Risk �Business Risk �Strategic Risk �Compliance Risk �Reputation Risk�Operational Risk Credit Risk- Credit Risk is defined as the possibility of losses associated with diminution in the credit quality of borrowers or counterparties. In a bank’s portfolio, losses stem from outright default due to inability or unwillingness of a customer or counterparty to meet commitments in relation to lending, trading, settlement and other financial transactions.
  • 9. Wal-Mart PARTICULARS 2006 2005 % CHANGE SALES 312427 285222 9.538184292 OPERATING INCOME/OPERATING PROFIT 18530 17091 8.419636066 INTEREST 1172 986 18.86409736 NET INCOME/ NET PROFIT 11231 10267 9.389305542 OPERATING EXPENSES 56733 51248 10.7028567 SHARE HOLDERS EQUITY 53171 49396 7.642319216 TOTAL ASSETS 138187 120154 15.00823943 COST OF GOODS SOLD 240391 219793 9.371545045 GROSS PROFIT= SALES- COST OF GOODS SOLD 72036 65429 10.09796879 PRETAXPROFIT=OPERATING PROFIT-INTEREST 17358 16105 7.780192487 Profitability Ratios PARTICULARS 2006 2005 % CHANGE GROSS PROFIT RATIO=(GROSSPROFIT/SALES)*100 23.05690609 22.93967506 0.511040513 NET INCOME RATIO=(NETPROFIT/SALES)*100 3.594759736 3.599652201 -0.135914933 OPERATING PROFIT RATIO= (OPERATING PROFIT/SALES)*100 5.930985478 5.992174517 -1.021149139 PRETAX PROFIT RATIO=(PRETAXPROFIT/SALES)*100 5.555857848 5.646478883 -1.604912311 OPERATING EXPENSE RATIO=(OPERATING EXPENSES/SALES)*100 18.1588019 17.96775845 1.063256994 FINANCIAL EXPENSES RATIO=(INTEREST/SALES)*100 0.37512763 0.345695634 8.513846684 RETURN ON SALES=(NETINCOME/SALES)*100 3.594759736 3.599652201 -0.135914933 RETURN ON ASSETS=(NETINCOME/ ASSETS)*100 8.127392591 8.54486742 -4.885679419 RETURN ON EQUITY=(NET INCOME/SH.HLDRS EQUITY)*100 21.12241635 20.78508381 1.622954929 PROFITABILITY=(NETINCOME/SALES)*100 3.594759736 3.599652201 -0.135914933 EFFICIENCY=(SALES/ASSETS) 2.260900085 2.373803619 -4.756228912 LEVERAGE=(ASSETS/SHAREHOLDERS EQUITY) 2.598916703 2.432464167 6.842959408 DUPONT ANALYSIS 21.12241635 20.78508381 1.622954929
  • 11. PARTICULARS 2006 2005 % CHANGE INVENTORY(AVG) 32191 29762 8.161413883 COST OF GOODS SOLD 240391 219793 9.371545045 NET CREDIT SALES( NET SALES) 312427 285222 9.538184292 AVERAGE DEBTORS( RECIEVABLES) 2662 1715 55.21865889 CASH AND CASH EQUIVALENTS 6414 5488 16.87317784 CURRENT LIABILITIES 48826 43182 13.07026076 TOTAL ASSETS 138187 120154 15.00823943 CURRENT ASSETS 43824 38854 12.79147578 AVERAGE CREDITORS(PAYABLES) 25373 21987 15.4000091 OPENING STOCK 29762 0 CLOSING STOCK 32191 29762 8.161413883 FIXED ASSETS = TOTAL ASSETS-CURRENT ASSETS 94363 81300 16.06765068 PURCHASES= COST OF GOODS SOLD- OPENING STOCK+ CLOSING STOCK 242820 249555 -2.698803871 NETWORKING CAPITAL= CURRENT ASSETS- CURRENT LIABILITIES -5002 -4328 15.57301294 Asset Utilization Ratios PARTICULARS 2006 2005 % CHANGE STOCK TURNOVER RATIO= COST OF GOODS SOLD/AVG INVENTORY 7.467646237 7.385021168 1.118819658 NUMBER OF DAYS TO INVENTORY=365/STOCK TURNOVER RATIO 48.87751621 49.42436747 -1.106440584 DEBTORS TURNOVER RATIO= NET CREDIT SALES/ AVG DEBTORS 117.3655147 166.3102041 -29.4297573 AVERAGE COLLECTION PERIOD= 365/DEBTORS TURNOVER RATIO 3.109942483 2.194693958 41.70278602 CREDITOR TURNOVER RATIO= NET CREDIT PURCHASES/AVG CREDITORS 9.570015371 11.35011598 -15.68354553 AVG PAYMENT PERIOD=365/ CREDITOR TURNOVER PERIOD 38.13995964 32.15826171 18.60081241 CASH TURNOVER RATIO=SALES/CASH AND CASH EQUIVALENTS 48.71016526 51.97193878 -6.276028158 CURRENT LIABILITIES TURNOVER RATIO=SALES/CURRENT LIABILITIES 6.398783435 6.605113242 -3.123789086 WORKING CAPITAL TURNOVER RATIO= SALES/ NET WORKING CAPITAL -62.46041583 -65.90157116 -5.221659014 TOTAL ASSETS TURNOVER RATIO=SALES/TOTAL ASSETS 2.260900085 2.373803619 -4.756228912 FIXED ASSETS TURNOVER RATIO=SALES/FIXED ASSETS 3.310905758 3.508265683 -5.625569525
  • 12. Asset Utilization Ratios Interpretation:
  • 13. PARTICULARS 2006 2005 % CHANGE TOTAL ASSETS 138187 120154 15.0082394 SH.HLDRS EQUITY 53171 49396 7.64231922 TOTAL LIABILITIES 85016 70758 20.1503717 EBIT 18530 17091 8.41963607 INTEREST 1172 986 18.8640974 EBT=EBIT-INTEREST 17358 16105 7.78019249 Leverage ratios PARTICULARS 2006 2005 % CHANGE ASSETS TO EQUITY RATIO= ASSETS/EQUITY 2.598917 2.432464 6.84295941 DEBT RATIO= TOTAL LIABILITIES/TOTAL ASSETS 0.615224 0.588894 4.47109902 DEBT EQUITY RATIO= TOTAL LIABILITIES/ EQUITY 1.598917 1.432464 11.6200139 INTERESTCOVERAGE RATIO= EBIT/ INTEREST 15.81058 17.33367 -8.7868932 FINANCIAL LEVERAGE=EBIT/EBT 1.067519 1.061223 0.59328487 Leverage ratios interpretation:
  • 14. PARTICULARS 2006 2005 % CHANGE CURRENT ASSETS 43824 38854 12.7914758 CURRENT LIABILITIES 48826 43182 13.0702608 QUICK ASSETS(CA-STOCK-PREPAID EXPENSES) 9076 7203 26.0030543 LIQUID ASSETS(CASH,BAN,MARKETABLE SECURITIES) 6414 5488 16.8731778 Liquidity Ratios PARTICULARS 2006 2005 % CHANGE CURRENT RATIO=CURRENT ASSETS/CURRENT LIABILITIES 0.897555 0.899773 -0.2465591 QUICK RATIO= QUICK ASSETS/CURRENT LIABILITIES 0.185885 0.166806 11.4378382 ABSOLUTE LIQUID RATIO= LIQUID ASSETS/CURRENT LIABILTIES 0.131364 0.12709 3.36332212 Liquidity Ratios Interpretation:
  • 15. Strength and Weakness of Wal-mart To conclude about the overall impression of the wal-mart’s performance over this period we can say that the it is maintaining a good profitability and efficiency as we can observe that gross profit ,net profit has increased over this period and even company has reduced its operating expenses to get more operating profits in the 2004 it has ability to reduce operating expenses . The company is able to generate the good net income over the sales and even the ROE of the company is above 15 during years 2005 and 2006 so that we can say that company is in very good position which also shows the company is able to generate the good income out of the shares holders equity .THE ROE is mainly increased due to the assets to equity which is observed by the investors. This ROE very importantly is considered by many investors to take decision in investing in a company rather than considering the EPS as it misguides the investors. Asset utilization is not that much good but it is not too bad .here it has used the fixed assets very well in the 2005 to generate more sales and the inventory is replenished very well in this year only. Then coming to collection period it is really good and even the they were able convince the creditors very well in having credit sales in the 2005.the company is also able to acquire more assets with the available equity in the year 2006.it has also increased its shares holders equity from 2005 to 2006.It is able to attract the investors But the company has to improve a lot in its liquidity position because it has been far below the ideal situation if it has to meet any short obligations it very much unable. The very important problem the company facing is that it not able to maintain the balance between the liquidity and the profitability. It is much concentrating on the profitability and not at all bothered about the liquidity where it has to be careful. Even it has to improve in the inventory management .it has to give more assurance to the creditors in interest payment .the company also has to be watchful in reducing financial leverage aspect so that more risk is not provided to the share holders .the company has to reduce the operating expenses to get more net margins. Finally as a whole it is having good profitability efficiency and good ROE which is good sigh for investors. So I advice fund manager to invest in this company