Examples price to sales ratios per p bv p cf
•Télécharger en tant que PPTX, PDF•
2 j'aime•969 vues


Recommandé
Recommandé
Contenu connexe
En vedette
En vedette (8)
Similaire à Examples price to sales ratios per p bv p cf
Similaire à Examples price to sales ratios per p bv p cf (12)
Plus de alexander N. N. Gilles
Plus de alexander N. N. Gilles (11)
Examples price to sales ratios per p bv p cf
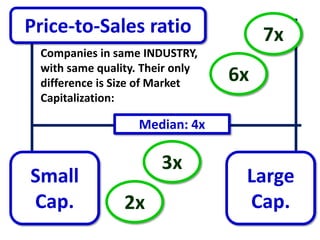
- 1. Price-to-Sales ratio 7x Companies in same INDUSTRY, with same quality. Their only difference is Size of Market 6x Capitalization: Median: 4x 3x Small Large Cap. 2x Cap.
- 2. Price-to-Sales ratio 7x Companies in same INDUSTRY, with same SIZE. Their only difference is QUALITY OF 6x EARNINGS: Median: 4x High- 3x LOW- quality quality earnings 2x earnings
- 3. Price-to-Sales ratio 7x Companies in same INDUSTRY, with same SIZE. Their only difference is QUALITY OF 6x EARNINGS: Median: 4x LOW- 3x HIGH- quality quality earnings 2x earnings
- 4. Price-to-Earnings ratio 17x Companies in same INDUSTRY, with same quality. Their only difference is Size of Market 12x Capitalization: Median: 10x 7x Small Large Cap. 5x Cap.
- 5. Price-to-Earnings ratio 17x Companies in same INDUSTRY, with same SIZE. Their only difference is QUALITY OF 12x EARNINGS: Median: 10x High- 7x LOW- quality quality earnings 5x earnings
- 6. Price-to-Earnings ratio 17x Companies in same INDUSTRY, with same SIZE. Their only difference is QUALITY OF 12x EARNINGS: Median: 10x LOW- 7x HIGH- quality quality earnings 5x earnings
- 7. Price-to-Cash Flow 15x Companies in same INDUSTRY, with same quality. Their only difference is Size of Market 11x Capitalization: Median: 8x 5x Small Large Cap. 2x Cap.
- 8. Price-to-Cash Flow 15x Companies in same INDUSTRY, with same SIZE. Their only difference is QUALITY OF 11x EARNINGS: Median: 8x High- 5x LOW- quality quality earnings 2x earnings
- 9. Price-to-Cash Flow 15x Companies in same INDUSTRY, with same SIZE. Their only difference is QUALITY OF 11x EARNINGS: Median: 8x LOW- 5x HIGH- quality quality earnings 2x earnings
- 10. Business Cycle Peak LOW-quality earnings HIGH- quality Trough Trough earnings
- 11. Price-to-Earnings ratio 17x + 2 St.dev: 17x RELATIVELY + 1 St.dev: 15x EXPENSIVE Median: 13x Below-Average PER KEY This area: Relatively CHEAP
- 12. Price-to-Sales ratio Price-to-Earnings ratio Expen- Price-to-Cash Flow ratio Price-to-Book Value sive EV / EBITDA Stock B Approach Industry Average #1 Stock A “Same- Quality Bargain Earnings & F.Conditions”
- 13. Price-to-Sales ratio Price-to-Earnings ratio Expen- Price-to-Cash Flow ratio Price-to-Book Value sive EV / EBITDA This week Approach Historical Average #2 of one and the same stock Last Year “Same- Quality Bargain Earnings & F.Conditions”
- 14. Capital to Raise? __bn / Sales Assets 50bn? 2bn / 200m / 1bn __bn? Guide to 20% Estimate