SlideShare une entreprise Scribd logo
1  sur  6
Télécharger pour lire hors ligne
Sarasota MLSSM Statistics - January 2011
                                                                                                               Single Family
                                                                         Unit Sales                            Condo

700
600
500
400
300
200
100
  0
          Jan‐10          Feb‐10       Mar‐10      Apr‐10 May‐10      Jun‐10     Jul‐10   Aug‐10        Sep‐10      Oct‐10     Nov‐10     Dec‐10   Jan‐11


                                                                                                              Single Family
                                                                 Median Sale Price
                                                                                                              Condo
$250,000

$200,000

$150,000

$100,000

 $50,000

          $0
                   Jan‐10       Feb‐10     Mar‐10         Apr‐10 May‐10     Jun‐10    Jul‐10     Aug‐10       Sep‐10    Oct‐10    Nov‐10     Dec‐10      Jan‐11


                                                                       Single Family 
                                                      Average     Median        Median Last       Months         Pending                      # New       # Off 
               #Active          #Sold      %Sold                                                                                %Pending 
                                                       DOM       Sale Prices    12 Months        Inventory       Reported                    Listings    Market 
   This 
  Month 
               3,920            384         9.8           179    $138,700       $161,000           10.2             749           19.1         726          146 
   This 
  Month        4,042            350         8.6           169    $156,250       $160,000           11.5             573           14.2        1,004         185 
 Last Year 
   Last 
  Month 
               3,920            500        12.8           178    $165,000       $163,000           7.8              567           14.5         715          156 
   YTD               ‐          384          ‐            179    $138,700            ‐                 ‐            749            ‐           726           ‐ 
                             
                                                  Single Family – Sale Price Vs. List Price % Rates
                    Jan            Feb            Mar        Apr       May        Jun           Jul         Aug        Sept        Oct        Nov         Dec 
  2010              94.4           92.8           95.2       94.8      95.2       95.3         94.7         95.2       94.6        95.2       94.8        94.1 
  2011              94.5            ‐              ‐          ‐         ‐          ‐             ‐           ‐           ‐          ‐          ‐           ‐ 
                
Statistics were compiled on properties listed in the MLS by members of the Sarasota Association of Realtors® as of Feb. 10th, 2011,
including some listings in Manatee, Englewood, Venice, and other areas. Single-family statistics are tabulated using property styles of
single-family and villa. Condo statistics include condo, co-op, and townhouse.

                                                                                                       Source: Sarasota Association of Realtors®
Sarasota MLSSM Statistics - January 2011
                                                                                                            Single Family
                                                                         Inventory                          Condo
5,000

4,000

3,000

2,000

1,000

      0
           Jan‐10          Feb‐10 Mar‐10 Apr‐10 May‐10 Jun‐10                     Jul‐10   Aug‐10 Sep‐10          Oct‐10 Nov‐10 Dec‐10            Jan‐11


                                                                                                             Single Family
                                                                      Pending Sales                          Condo
900
800
700
600
500
400
300
200
100
  0
          Jan‐10          Feb‐10     Mar‐10       Apr‐10 May‐10        Jun‐10     Jul‐10   Aug‐10     Sep‐10       Oct‐10     Nov‐10     Dec‐10    Jan‐11


                                                                                 Condo 
                                                      Average     Median Sale    Median Last    Months of         Pending                     # New         # Off 
                  #Active     #Sold        %Sold                                                                               %Pending 
                                                       DOM          Prices       12 Months      Inventory         Reported                   Listings      Market 
   This 
  Month 
                  2,152        153          7.1        204        $142,500        $162,500          14.1            264          12.3         334           118 
   This 
  Month           2,300        156          6.8        207        $165,000        $189,900          14.7            242          10.5         385           205 
 Last Year 
   Last 
  Month 
                  2,127        181          8.5        211        $160,000        $163,000          11.7            222          10.4         302           139 
   YTD               ‐         153           ‐         204        $142,500            ‐              ‐              264           ‐           334            ‐ 
                      
                                                    Condo – Sale Price Vs. List Price % Rates
                   Jan             Feb        Mar         Apr          May        Jun        Jul          Aug         Sept       Oct         Nov           Dec 
  2010             92.5            92.4       92.5        93.2         94.2       93.7      94.2          93.5        93.2       94.3        94.5          92.9 
  2011             93.4             ‐          ‐           ‐            ‐          ‐          ‐            ‐            ‐         ‐           ‐             ‐ 
               
Median sales price is the middle value, where half of the homes sold for more, and half sold for less. Listings sold were closed transac-
tions during the month. Pending sales are sales where an offer has been accepted during the month, but the sale has not yet closed. Even
though some pending sales never close, pending sales are an indicator of current buyer activity. DOM indicates the average number of
days that sold properties were on the market before a contract was executed.
                                                                                                          Sarasota Association of Realtors® MLS
Single Family
                                               Days on Market


                                                                                                                                      The Xtra Pages - Digital Version Only
                                                                                     Condo
250

200

150

100

 50

  0
        Jan‐10    Feb‐10   Mar‐10   Apr‐10 May‐10   Jun‐10   Jul‐10   Aug‐10   Sep‐10    Oct‐10      Nov‐10   Dec‐10     Jan‐11

                                              New Listings                                               Single Family

                                                                                                         Condo
1,200

1,000

 800

 600

 400

 200

   0
         Jan‐10    Feb‐10 Mar‐10     Apr‐10 May‐10 Jun‐10       Jul‐10   Aug‐10    Sep‐10    Oct‐10 Nov‐10 Dec‐10            Jan‐11

                                              Months of Inventory                                Single Family
                                                                                                     Condo
 18.0
 16.0
 14.0
 12.0
 10.0
  8.0
  6.0
  4.0
  2.0
  0.0
         Jan‐10    Feb‐10 Mar‐10 Apr‐10 May‐10 Jun‐10           Jul‐10   Aug‐10     Sep‐10   Oct‐10 Nov‐10 Dec‐10            Jan‐11
                                                                                                  Single Family
                                                      Sales Volume                                    Condo
  $200,000,000 
  $180,000,000 
  $160,000,000 
  $140,000,000 
  $120,000,000 
  $100,000,000                                                                    Sarasota Association of Realtors® MLS
   $80,000,000 
   $60,000,000 
   $40,000,000 
   $20,000,000 
            $0 
                    Jan‐10 Feb‐10 Mar‐10 Apr‐10 May‐10 Jun‐10         Jul‐10 Aug‐10 Sep‐10 Oct‐10 Nov‐10 Dec‐10 Jan‐11
Fourth Quarter 2010 Report
                                Single Family Sales ‐ By Quarter                                       REO          Short    Arm's Length
1200
1000
800
600
400
200
   0
        2007‐Q4 2008‐Q1 2008‐Q2 2008‐Q3 2008‐Q4 2009‐Q1 2009‐Q2 2009‐Q3 2009‐Q4 2010‐Q1 2010‐Q2 2010‐Q3 2010‐Q4


                                 Condo Sales ‐ By Quarter                                              REO          Short     Arm's Length
500

400

300

200

100

  0
       2007‐Q4 2008‐Q1 2008‐Q2 2008‐Q3 2008‐Q4 2009‐Q1 2009‐Q2 2009‐Q3 2009‐Q4 2010‐Q1 2010‐Q2 2010‐Q3 2010‐Q4


                     Single Family Median Sale Price                                             REO        Short       Arm's Length
$300,000 

$250,000 

$200,000 

$150,000 

$100,000 

 $50,000 

       $0 
             2008‐2ndQ   2008‐3rdQ   2008‐4thQ   2009‐1stQ   2009‐2ndQ   2009‐3rdQ   2009‐4thQ    2010‐Q1      2010‐Q2      2010‐Q3     2010‐Q4


                               Condo Median Sale Price                                           REO        Short        Arm's Length
$450,000 
$400,000 
$350,000 
$300,000 
$250,000 
$200,000 
$150,000                                                                               Source: Sarasota Association of Realtors®
$100,000 
 $50,000 
       $0 
             2008‐2ndQ   2008‐3rdQ   2008‐4thQ   2009‐1stQ   2009‐2ndQ   2009‐3rdQ   2009‐4thQ    2010‐Q1      2010‐Q2      2010‐Q3     2010‐Q4
Single Family
                             REO Sales ‐ By Quarter                        Condo
600
500
400
300
200
100
 0
       2007‐Q4 2008‐Q1 2008‐Q2 2008‐Q3 2008‐Q4 2009‐Q1 2009‐Q2 2009‐Q3 2009‐Q4 2010‐Q1 2010‐Q2 2010‐Q3 2010‐Q4

                                                                          Single Family
                         Short Sales ‐ By Quarter                         Condo
400
350
300
250
200
150
100
 50
  0
       2008‐Q1 2008‐Q2 2008‐Q3 2008‐Q4 2009‐Q1 2009‐Q2 2009‐Q3 2009‐Q4 2010‐Q1 2010‐Q2 2010‐Q3 2010‐Q4


                                                                           Single Family
                       Arm's Length Sales ‐ By Quarter                     Condo
1200
1000
800
600
400
200
  0
        2008‐Q1 2008‐Q2 2008‐Q3 2008‐Q4 2009‐Q1 2009‐Q2 2009‐Q3 2009‐Q4 2010‐Q1 2010‐Q2 2010‐Q3 2010‐Q4


                                                                     Source: Sarasota Association of Realtors®
Annual Sales ‐ 2000 to 2010
                                                                                      Single Family              Condo                Total
                                                          11267
                                                                        10562
                                              9697


                               8167
                                                          7,596                                                                              7603
                   7036                                                  6,841
    6533                                                                                                                    6739
                                              6,504                                   6358
                                                                                                  6042          5820
                               5,603                                                                                                         5,466
                                                                                                                            5,183
                 4,940
                                                                                                                4,626
    4,349                                                                             4,353
                                                                         3,721                    3,922
                                                          3,671
                                              3,193
                               2,564
    2,184        2,096                                                                2,005       2,120                                      2,137
                                                                                                                            1,556
                                                                                                                1,194


    2000           2001        2002           2003        2004           2005         2006        2007          2008        2009             2010


Annual Median Sale Price ‐ 2000 to 2010 
           Condo          Single Family                                        $351,000
                                                                                             $342,000     $336,250
                                                                                                                       $320,000

                                                              $272,500
                                                                                              $301,225
                                                                                  $305,000
                                                  $226,000
                                                                    $225,000                              $303,000
                                    $191,000                                                                                         $210,000
                    $172,500
                                                      $191,000                                                       $230,000                        $163,000
$142,000
                                   $173,000
                    $145,000                                                                                                      $160,000           $163,000
      $132,300


   2000          2001          2002            2003          2004          2005           2006           2007        2008           2009            2010

Contenu connexe

En vedette (9)

May2011 stats 3 to8
May2011 stats 3 to8May2011 stats 3 to8
May2011 stats 3 to8
 
SAR Monthly Statistics Released for June 2011
SAR Monthly Statistics Released for June 2011SAR Monthly Statistics Released for June 2011
SAR Monthly Statistics Released for June 2011
 
e2e Projects
e2e Projectse2e Projects
e2e Projects
 
May2011 stats
May2011 statsMay2011 stats
May2011 stats
 
Sr mag mar2013stats13022194344.2-6
Sr mag mar2013stats13022194344.2-6Sr mag mar2013stats13022194344.2-6
Sr mag mar2013stats13022194344.2-6
 
Aug2012 stats 3_8
Aug2012 stats 3_8Aug2012 stats 3_8
Aug2012 stats 3_8
 
Sarasota Market Stats December
Sarasota Market Stats DecemberSarasota Market Stats December
Sarasota Market Stats December
 
Srmag june2011 stats
Srmag june2011 statsSrmag june2011 stats
Srmag june2011 stats
 
Buying a home in sarasota florida
Buying a home in sarasota floridaBuying a home in sarasota florida
Buying a home in sarasota florida
 

Plus de Sarasota Real Estate (16)

Sr mag june2013stats.3-8
Sr mag june2013stats.3-8Sr mag june2013stats.3-8
Sr mag june2013stats.3-8
 
Sarasota Market Stats May
Sarasota Market Stats MaySarasota Market Stats May
Sarasota Market Stats May
 
Sar statsemail13052285100.2 7
Sar statsemail13052285100.2 7Sar statsemail13052285100.2 7
Sar statsemail13052285100.2 7
 
March2013 stats.3 6
March2013 stats.3 6March2013 stats.3 6
March2013 stats.3 6
 
Feb2013 stats.3 8
Feb2013 stats.3 8Feb2013 stats.3 8
Feb2013 stats.3 8
 
Sarasota Market Statistics - October
Sarasota Market Statistics - OctoberSarasota Market Statistics - October
Sarasota Market Statistics - October
 
June2012 stats.3 8
June2012 stats.3 8June2012 stats.3 8
June2012 stats.3 8
 
Sarasota Market stats for March
Sarasota Market stats for MarchSarasota Market stats for March
Sarasota Market stats for March
 
Sr march2012 stats12041822817_2_3
Sr march2012 stats12041822817_2_3Sr march2012 stats12041822817_2_3
Sr march2012 stats12041822817_2_3
 
Sar stats july2011
Sar stats july2011Sar stats july2011
Sar stats july2011
 
Sarasota Market Stats Feb 2011
Sarasota Market Stats Feb 2011Sarasota Market Stats Feb 2011
Sarasota Market Stats Feb 2011
 
Dec2010stats
Dec2010statsDec2010stats
Dec2010stats
 
Home buyers guide
Home buyers guideHome buyers guide
Home buyers guide
 
Sarasota Market Stats - October 2010
Sarasota Market Stats - October 2010Sarasota Market Stats - October 2010
Sarasota Market Stats - October 2010
 
Online Sarasota Visitors Guide
Online Sarasota Visitors GuideOnline Sarasota Visitors Guide
Online Sarasota Visitors Guide
 
August2010 stats
August2010 statsAugust2010 stats
August2010 stats
 

Dernier

Managed Farmland Brochures to get more in
Managed Farmland Brochures to get more inManaged Farmland Brochures to get more in
Managed Farmland Brochures to get more inknoxdigital1
 
Experion Elements Sector 45 Noida_Brochure.pdf.pdf
Experion Elements Sector 45 Noida_Brochure.pdf.pdfExperion Elements Sector 45 Noida_Brochure.pdf.pdf
Experion Elements Sector 45 Noida_Brochure.pdf.pdfkratirudram
 
Eco-Efficient Living: Redefining Sustainability through Leech's Green Design ...
Eco-Efficient Living: Redefining Sustainability through Leech's Green Design ...Eco-Efficient Living: Redefining Sustainability through Leech's Green Design ...
Eco-Efficient Living: Redefining Sustainability through Leech's Green Design ...Newman George Leech
 
Call Girls In Sahibabad Ghaziabad ❤️8860477959 Low Rate Escorts Service In 24...
Call Girls In Sahibabad Ghaziabad ❤️8860477959 Low Rate Escorts Service In 24...Call Girls In Sahibabad Ghaziabad ❤️8860477959 Low Rate Escorts Service In 24...
Call Girls In Sahibabad Ghaziabad ❤️8860477959 Low Rate Escorts Service In 24...lizamodels9
 
Prestige Sector 94 at Noida E Brochure.pdf
Prestige Sector 94 at Noida E Brochure.pdfPrestige Sector 94 at Noida E Brochure.pdf
Prestige Sector 94 at Noida E Brochure.pdfsarak0han45400
 
Call Girls in Inderpuri Delhi 💯Call Us 🔝8264348440🔝
Call Girls in Inderpuri Delhi 💯Call Us 🔝8264348440🔝Call Girls in Inderpuri Delhi 💯Call Us 🔝8264348440🔝
Call Girls in Inderpuri Delhi 💯Call Us 🔝8264348440🔝soniya singh
 
Ebullient Investments Limited specializes in Building contractor
Ebullient Investments Limited specializes in Building contractorEbullient Investments Limited specializes in Building contractor
Ebullient Investments Limited specializes in Building contractorEbullient Investments Limited
 
Prestige Rainbow Waters Raidurgam, Gachibowli Hyderabad E- Brochure.pdf
Prestige Rainbow Waters Raidurgam, Gachibowli Hyderabad E- Brochure.pdfPrestige Rainbow Waters Raidurgam, Gachibowli Hyderabad E- Brochure.pdf
Prestige Rainbow Waters Raidurgam, Gachibowli Hyderabad E- Brochure.pdffaheemali990101
 
Choose Noida's Leading Architect
Choose    Noida's    Leading   ArchitectChoose    Noida's    Leading   Architect
Choose Noida's Leading ArchitectMM Design Studio
 
Pride Wonderland Dhanori Pune Brochure.pdf
Pride Wonderland Dhanori Pune Brochure.pdfPride Wonderland Dhanori Pune Brochure.pdf
Pride Wonderland Dhanori Pune Brochure.pdfabbu831446
 
Low Rate Call Girls in Triveni Complex Delhi Call 9990771857
Low Rate Call Girls in Triveni Complex Delhi Call 9990771857Low Rate Call Girls in Triveni Complex Delhi Call 9990771857
Low Rate Call Girls in Triveni Complex Delhi Call 9990771857delhimodel235
 
Everything you ever Wanted to Know about Florida Property Tax Exemptions.pdf
Everything you ever Wanted to Know about Florida Property Tax Exemptions.pdfEverything you ever Wanted to Know about Florida Property Tax Exemptions.pdf
Everything you ever Wanted to Know about Florida Property Tax Exemptions.pdfTim Wilmath
 
How to Navigate the Eviction Process in Pennsylvania: A Landlord's Guide
How to Navigate the Eviction Process in Pennsylvania: A Landlord's GuideHow to Navigate the Eviction Process in Pennsylvania: A Landlord's Guide
How to Navigate the Eviction Process in Pennsylvania: A Landlord's GuideezLandlordForms
 
Sobha Aranya Sector 80 Gurgaon E- Brochure.pdf
Sobha Aranya Sector 80 Gurgaon E- Brochure.pdfSobha Aranya Sector 80 Gurgaon E- Brochure.pdf
Sobha Aranya Sector 80 Gurgaon E- Brochure.pdffaheemali990101
 
What Is Biophilic Design .pdf
What Is Biophilic Design            .pdfWhat Is Biophilic Design            .pdf
What Is Biophilic Design .pdfyamunaNMH
 
Call Girls In Mayur Vihar-1 Delhi ❤️8860477959 Good Looking Escorts In 24/7 D...
Call Girls In Mayur Vihar-1 Delhi ❤️8860477959 Good Looking Escorts In 24/7 D...Call Girls In Mayur Vihar-1 Delhi ❤️8860477959 Good Looking Escorts In 24/7 D...
Call Girls In Mayur Vihar-1 Delhi ❤️8860477959 Good Looking Escorts In 24/7 D...lizamodels9
 
Provident Solitaire Park Square Kanakapura Road, Bangalore E- Brochure.pdf
Provident Solitaire Park Square Kanakapura Road, Bangalore E- Brochure.pdfProvident Solitaire Park Square Kanakapura Road, Bangalore E- Brochure.pdf
Provident Solitaire Park Square Kanakapura Road, Bangalore E- Brochure.pdffaheemali990101
 
SVN Live 4.22.24 Weekly Property Broadcast
SVN Live 4.22.24 Weekly Property BroadcastSVN Live 4.22.24 Weekly Property Broadcast
SVN Live 4.22.24 Weekly Property BroadcastSVN International Corp.
 

Dernier (20)

Managed Farmland Brochures to get more in
Managed Farmland Brochures to get more inManaged Farmland Brochures to get more in
Managed Farmland Brochures to get more in
 
Experion Elements Sector 45 Noida_Brochure.pdf.pdf
Experion Elements Sector 45 Noida_Brochure.pdf.pdfExperion Elements Sector 45 Noida_Brochure.pdf.pdf
Experion Elements Sector 45 Noida_Brochure.pdf.pdf
 
Eco-Efficient Living: Redefining Sustainability through Leech's Green Design ...
Eco-Efficient Living: Redefining Sustainability through Leech's Green Design ...Eco-Efficient Living: Redefining Sustainability through Leech's Green Design ...
Eco-Efficient Living: Redefining Sustainability through Leech's Green Design ...
 
Call Girls In Sahibabad Ghaziabad ❤️8860477959 Low Rate Escorts Service In 24...
Call Girls In Sahibabad Ghaziabad ❤️8860477959 Low Rate Escorts Service In 24...Call Girls In Sahibabad Ghaziabad ❤️8860477959 Low Rate Escorts Service In 24...
Call Girls In Sahibabad Ghaziabad ❤️8860477959 Low Rate Escorts Service In 24...
 
Prestige Sector 94 at Noida E Brochure.pdf
Prestige Sector 94 at Noida E Brochure.pdfPrestige Sector 94 at Noida E Brochure.pdf
Prestige Sector 94 at Noida E Brochure.pdf
 
Call Girls in Inderpuri Delhi 💯Call Us 🔝8264348440🔝
Call Girls in Inderpuri Delhi 💯Call Us 🔝8264348440🔝Call Girls in Inderpuri Delhi 💯Call Us 🔝8264348440🔝
Call Girls in Inderpuri Delhi 💯Call Us 🔝8264348440🔝
 
young call girls in Lajpat Nagar,🔝 9953056974 🔝 escort Service
young call girls in Lajpat Nagar,🔝 9953056974 🔝 escort Serviceyoung call girls in Lajpat Nagar,🔝 9953056974 🔝 escort Service
young call girls in Lajpat Nagar,🔝 9953056974 🔝 escort Service
 
Ebullient Investments Limited specializes in Building contractor
Ebullient Investments Limited specializes in Building contractorEbullient Investments Limited specializes in Building contractor
Ebullient Investments Limited specializes in Building contractor
 
Prestige Rainbow Waters Raidurgam, Gachibowli Hyderabad E- Brochure.pdf
Prestige Rainbow Waters Raidurgam, Gachibowli Hyderabad E- Brochure.pdfPrestige Rainbow Waters Raidurgam, Gachibowli Hyderabad E- Brochure.pdf
Prestige Rainbow Waters Raidurgam, Gachibowli Hyderabad E- Brochure.pdf
 
Hot call girls in Moti Bagh🔝 9953056974 🔝 escort Service
Hot call girls in Moti Bagh🔝 9953056974 🔝 escort ServiceHot call girls in Moti Bagh🔝 9953056974 🔝 escort Service
Hot call girls in Moti Bagh🔝 9953056974 🔝 escort Service
 
Choose Noida's Leading Architect
Choose    Noida's    Leading   ArchitectChoose    Noida's    Leading   Architect
Choose Noida's Leading Architect
 
Pride Wonderland Dhanori Pune Brochure.pdf
Pride Wonderland Dhanori Pune Brochure.pdfPride Wonderland Dhanori Pune Brochure.pdf
Pride Wonderland Dhanori Pune Brochure.pdf
 
Low Rate Call Girls in Triveni Complex Delhi Call 9990771857
Low Rate Call Girls in Triveni Complex Delhi Call 9990771857Low Rate Call Girls in Triveni Complex Delhi Call 9990771857
Low Rate Call Girls in Triveni Complex Delhi Call 9990771857
 
Everything you ever Wanted to Know about Florida Property Tax Exemptions.pdf
Everything you ever Wanted to Know about Florida Property Tax Exemptions.pdfEverything you ever Wanted to Know about Florida Property Tax Exemptions.pdf
Everything you ever Wanted to Know about Florida Property Tax Exemptions.pdf
 
How to Navigate the Eviction Process in Pennsylvania: A Landlord's Guide
How to Navigate the Eviction Process in Pennsylvania: A Landlord's GuideHow to Navigate the Eviction Process in Pennsylvania: A Landlord's Guide
How to Navigate the Eviction Process in Pennsylvania: A Landlord's Guide
 
Sobha Aranya Sector 80 Gurgaon E- Brochure.pdf
Sobha Aranya Sector 80 Gurgaon E- Brochure.pdfSobha Aranya Sector 80 Gurgaon E- Brochure.pdf
Sobha Aranya Sector 80 Gurgaon E- Brochure.pdf
 
What Is Biophilic Design .pdf
What Is Biophilic Design            .pdfWhat Is Biophilic Design            .pdf
What Is Biophilic Design .pdf
 
Call Girls In Mayur Vihar-1 Delhi ❤️8860477959 Good Looking Escorts In 24/7 D...
Call Girls In Mayur Vihar-1 Delhi ❤️8860477959 Good Looking Escorts In 24/7 D...Call Girls In Mayur Vihar-1 Delhi ❤️8860477959 Good Looking Escorts In 24/7 D...
Call Girls In Mayur Vihar-1 Delhi ❤️8860477959 Good Looking Escorts In 24/7 D...
 
Provident Solitaire Park Square Kanakapura Road, Bangalore E- Brochure.pdf
Provident Solitaire Park Square Kanakapura Road, Bangalore E- Brochure.pdfProvident Solitaire Park Square Kanakapura Road, Bangalore E- Brochure.pdf
Provident Solitaire Park Square Kanakapura Road, Bangalore E- Brochure.pdf
 
SVN Live 4.22.24 Weekly Property Broadcast
SVN Live 4.22.24 Weekly Property BroadcastSVN Live 4.22.24 Weekly Property Broadcast
SVN Live 4.22.24 Weekly Property Broadcast
 

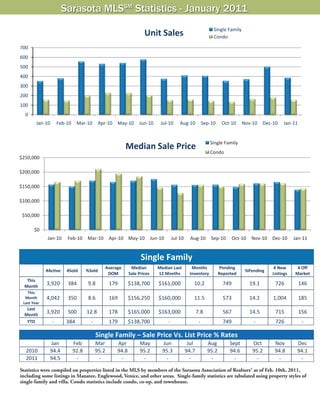
Sarsota Market Statistics for January 2011

  • 1. Sarasota MLSSM Statistics - January 2011 Single Family Unit Sales Condo 700 600 500 400 300 200 100 0 Jan‐10 Feb‐10 Mar‐10 Apr‐10 May‐10 Jun‐10 Jul‐10 Aug‐10 Sep‐10 Oct‐10 Nov‐10 Dec‐10 Jan‐11 Single Family Median Sale Price Condo $250,000 $200,000 $150,000 $100,000 $50,000 $0 Jan‐10 Feb‐10 Mar‐10 Apr‐10 May‐10 Jun‐10 Jul‐10 Aug‐10 Sep‐10 Oct‐10 Nov‐10 Dec‐10 Jan‐11 Single Family    Average  Median  Median Last  Months  Pending  # New  # Off  #Active  #Sold  %Sold  %Pending  DOM  Sale Prices  12 Months  Inventory  Reported  Listings  Market  This  Month  3,920  384  9.8  179  $138,700  $161,000  10.2  749  19.1  726  146  This  Month  4,042  350  8.6  169  $156,250  $160,000  11.5  573  14.2  1,004  185  Last Year  Last  Month  3,920  500  12.8  178  $165,000  $163,000  7.8  567  14.5  715  156  YTD  ‐  384  ‐  179  $138,700  ‐  ‐  749  ‐  726  ‐      Single Family – Sale Price Vs. List Price % Rates   Jan  Feb  Mar  Apr  May  Jun  Jul  Aug  Sept  Oct  Nov  Dec  2010  94.4  92.8  95.2  94.8  95.2  95.3  94.7  95.2  94.6  95.2  94.8  94.1  2011  94.5  ‐  ‐  ‐  ‐  ‐  ‐  ‐  ‐  ‐  ‐  ‐    Statistics were compiled on properties listed in the MLS by members of the Sarasota Association of Realtors® as of Feb. 10th, 2011, including some listings in Manatee, Englewood, Venice, and other areas. Single-family statistics are tabulated using property styles of single-family and villa. Condo statistics include condo, co-op, and townhouse. Source: Sarasota Association of Realtors®
  • 2. Sarasota MLSSM Statistics - January 2011 Single Family Inventory Condo 5,000 4,000 3,000 2,000 1,000 0 Jan‐10 Feb‐10 Mar‐10 Apr‐10 May‐10 Jun‐10 Jul‐10 Aug‐10 Sep‐10 Oct‐10 Nov‐10 Dec‐10 Jan‐11 Single Family Pending Sales Condo 900 800 700 600 500 400 300 200 100 0 Jan‐10 Feb‐10 Mar‐10 Apr‐10 May‐10 Jun‐10 Jul‐10 Aug‐10 Sep‐10 Oct‐10 Nov‐10 Dec‐10 Jan‐11 Condo    Average  Median Sale  Median Last  Months of Pending  # New  # Off  #Active  #Sold  %Sold  %Pending  DOM  Prices  12 Months  Inventory  Reported  Listings  Market  This  Month  2,152  153  7.1  204  $142,500  $162,500  14.1  264  12.3  334  118  This  Month  2,300  156  6.8  207  $165,000  $189,900  14.7  242  10.5  385  205  Last Year  Last  Month  2,127  181  8.5  211  $160,000  $163,000  11.7  222  10.4  302  139  YTD  ‐  153  ‐  204  $142,500  ‐  ‐  264  ‐  334  ‐    Condo – Sale Price Vs. List Price % Rates   Jan  Feb  Mar  Apr  May  Jun  Jul  Aug  Sept  Oct  Nov  Dec  2010  92.5  92.4  92.5  93.2  94.2  93.7  94.2  93.5  93.2  94.3  94.5  92.9  2011  93.4  ‐  ‐  ‐  ‐  ‐  ‐  ‐  ‐  ‐  ‐  ‐    Median sales price is the middle value, where half of the homes sold for more, and half sold for less. Listings sold were closed transac- tions during the month. Pending sales are sales where an offer has been accepted during the month, but the sale has not yet closed. Even though some pending sales never close, pending sales are an indicator of current buyer activity. DOM indicates the average number of days that sold properties were on the market before a contract was executed. Sarasota Association of Realtors® MLS
  • 3. Single Family Days on Market The Xtra Pages - Digital Version Only Condo 250 200 150 100 50 0 Jan‐10 Feb‐10 Mar‐10 Apr‐10 May‐10 Jun‐10 Jul‐10 Aug‐10 Sep‐10 Oct‐10 Nov‐10 Dec‐10 Jan‐11 New Listings Single Family Condo 1,200 1,000 800 600 400 200 0 Jan‐10 Feb‐10 Mar‐10 Apr‐10 May‐10 Jun‐10 Jul‐10 Aug‐10 Sep‐10 Oct‐10 Nov‐10 Dec‐10 Jan‐11 Months of Inventory Single Family Condo 18.0 16.0 14.0 12.0 10.0 8.0 6.0 4.0 2.0 0.0 Jan‐10 Feb‐10 Mar‐10 Apr‐10 May‐10 Jun‐10 Jul‐10 Aug‐10 Sep‐10 Oct‐10 Nov‐10 Dec‐10 Jan‐11 Single Family Sales Volume Condo $200,000,000  $180,000,000  $160,000,000  $140,000,000  $120,000,000  $100,000,000  Sarasota Association of Realtors® MLS $80,000,000  $60,000,000  $40,000,000  $20,000,000  $0  Jan‐10 Feb‐10 Mar‐10 Apr‐10 May‐10 Jun‐10 Jul‐10 Aug‐10 Sep‐10 Oct‐10 Nov‐10 Dec‐10 Jan‐11
  • 4. Fourth Quarter 2010 Report Single Family Sales ‐ By Quarter REO Short Arm's Length 1200 1000 800 600 400 200 0 2007‐Q4 2008‐Q1 2008‐Q2 2008‐Q3 2008‐Q4 2009‐Q1 2009‐Q2 2009‐Q3 2009‐Q4 2010‐Q1 2010‐Q2 2010‐Q3 2010‐Q4 Condo Sales ‐ By Quarter REO Short Arm's Length 500 400 300 200 100 0 2007‐Q4 2008‐Q1 2008‐Q2 2008‐Q3 2008‐Q4 2009‐Q1 2009‐Q2 2009‐Q3 2009‐Q4 2010‐Q1 2010‐Q2 2010‐Q3 2010‐Q4 Single Family Median Sale Price REO Short Arm's Length $300,000  $250,000  $200,000  $150,000  $100,000  $50,000  $0  2008‐2ndQ 2008‐3rdQ 2008‐4thQ 2009‐1stQ 2009‐2ndQ 2009‐3rdQ 2009‐4thQ 2010‐Q1 2010‐Q2 2010‐Q3 2010‐Q4 Condo Median Sale Price REO Short Arm's Length $450,000  $400,000  $350,000  $300,000  $250,000  $200,000  $150,000  Source: Sarasota Association of Realtors® $100,000  $50,000  $0  2008‐2ndQ 2008‐3rdQ 2008‐4thQ 2009‐1stQ 2009‐2ndQ 2009‐3rdQ 2009‐4thQ 2010‐Q1 2010‐Q2 2010‐Q3 2010‐Q4
  • 5. Single Family REO Sales ‐ By Quarter Condo 600 500 400 300 200 100 0 2007‐Q4 2008‐Q1 2008‐Q2 2008‐Q3 2008‐Q4 2009‐Q1 2009‐Q2 2009‐Q3 2009‐Q4 2010‐Q1 2010‐Q2 2010‐Q3 2010‐Q4 Single Family Short Sales ‐ By Quarter Condo 400 350 300 250 200 150 100 50 0 2008‐Q1 2008‐Q2 2008‐Q3 2008‐Q4 2009‐Q1 2009‐Q2 2009‐Q3 2009‐Q4 2010‐Q1 2010‐Q2 2010‐Q3 2010‐Q4 Single Family Arm's Length Sales ‐ By Quarter Condo 1200 1000 800 600 400 200 0 2008‐Q1 2008‐Q2 2008‐Q3 2008‐Q4 2009‐Q1 2009‐Q2 2009‐Q3 2009‐Q4 2010‐Q1 2010‐Q2 2010‐Q3 2010‐Q4 Source: Sarasota Association of Realtors®
  • 6. Annual Sales ‐ 2000 to 2010 Single Family Condo Total 11267 10562 9697 8167 7,596 7603 7036 6,841 6533 6739 6,504 6358 6042 5820 5,603 5,466 5,183 4,940 4,626 4,349 4,353 3,721 3,922 3,671 3,193 2,564 2,184 2,096 2,005 2,120 2,137 1,556 1,194 2000 2001 2002 2003 2004 2005 2006 2007 2008 2009 2010 Annual Median Sale Price ‐ 2000 to 2010  Condo Single Family $351,000 $342,000 $336,250 $320,000 $272,500 $301,225 $305,000 $226,000 $225,000 $303,000 $191,000 $210,000 $172,500 $191,000 $230,000 $163,000 $142,000 $173,000 $145,000 $160,000 $163,000 $132,300 2000 2001 2002 2003 2004 2005 2006 2007 2008 2009 2010