Polar ice melt due to rising global temperatures will have widespread implications. As ice sheets and glaciers melt, sea levels will rise due to thermal expansion of warming oceans and the addition of fresh water. Approximately 400 million people live within 20 meters of coastlines and will be impacted by sea level rise. Changes in ocean temperatures and currents due to melting ice will also affect global and local climate patterns and temperatures. Students are tasked with researching these issues to better understand the causes and effects of polar ice melt and sea level rise, and to communicate their findings to the United Nations.
Connector Corner: Accelerate revenue generation using UiPath API-centric busi...
Ice Sheet Sbrumberg Pbl
1. Ice sheet sbrumberg PBL
Our Oceans connect us:
www.un.org/
How do we handle the Global Implications of Polar Ice melt
and the local impacts of sea level rise?
You may have heard that
Eskimos have many words for
snow. Whether or not that is
true, it can serve as a reminder
that snow and ice are
important to all life in the
polar regions. Our
understanding that all our
cultures share one planet and
its connected global systems is
as important as understanding
other cultures. It is important
that we all understanding the
cycles of snow and ice and
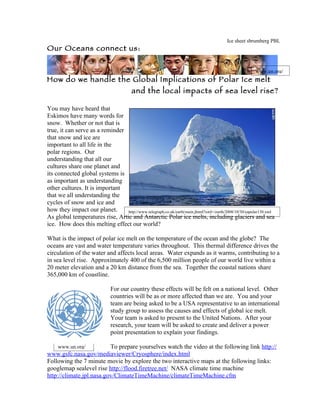
how they impact our planet. http://www.telegraph.co.uk/earth/main.jhtml?xml=/earth/2008/10/30/eapolar130.xml
As global temperatures rise, Artic and Antarctic Polar ice melts, including glaciers and sea
ice. How does this melting effect our world?
What is the impact of polar ice melt on the temperature of the ocean and the globe? The
oceans are vast and water temperature varies throughout. This thermal difference drives the
circulation of the water and affects local areas. Water expands as it warms, contributing to a
in sea level rise. Approximately 400 of the 6,500 million people of our world live within a
20 meter elevation and a 20 km distance from the sea. Together the coastal nations share
365,000 km of coastline.
For our country these effects will be felt on a national level. Other
countries will be as or more affected than we are. You and your
team are being asked to be a USA representative to an international
study group to assess the causes and effects of global ice melt.
Your team is asked to present to the United Nations. After your
research, your team will be asked to create and deliver a power
point presentation to explain your findings.
www.un.org/ To prepare yourselves watch the video at the following link http://
www.gsfc.nasa.gov/mediaviewer/Cryosphere/index.html
Following the 7 minute movie by explore the two interactive maps at the following links:
googlemap sealevel rise http://flood.firetree.net/ NASA climate time machine
http://climate.jpl.nasa.gov/ClimateTimeMachine/climateTimeMachine.cfm
2. Consider the global causes
and effects of the ice melt
then consider the local
impacts of the effects.
1st Keeping a world view-
• How much will melt
and what will be water
temperature change in
the next 100 years?
• What kinds of
conditions change this
prediction?
• What effect will this
have on the sea level
and the circulation of
the water in the
oceans?
2nd Focusing on impact of
• How will our land
around the world be
affected?
• What will be the
impact be to the
http://www.nasa.gov/mission_pages/IPY/multimedia/ipyimg_20081031.html
citizens?
• What will be the
impact land and the
ecology of the land?
Here are the 6 steps to follow:
Read the entire description of the project including the rubric before beginning
One: Brainstorm. Every person should first write what s/he knows about the following list
of questions. Write all the sphere to sphere connections, event to sphere connections and
causal chains. As you go, create a list of things you need to know or questions that you
have.
• How much will melt and what will be water temperature change in the next 100
years?
• What kinds of conditions change this prediction?
• What effect will this have on the sea level and the circulation of the water in the
oceans
• How will our land around the world be affected?
• What will be the impacts be to the citizens
• What will be the impact land and the ecology of the land?
Two: Collaborate by brainstorming with your teammates. Do this by sharing your lists with
each other. Choose a note-taker and a question-writer. Give a written version of your
3. brainstorm to the note-taker and keep one for yourself. Share you understanding through
discussion. How does your ESS analysis compare to others? Try to answer others questions
as a group. As you go have the question-writer keep a list of questions the group needs to
research. (Hand a copy of this in.)
Three: Research by dividing up the research questions between teammates. Research using
from the list given or from trusted sites. Answer the questions as fully as you can.
Four: Collaborate more by sharing your research and deciding what points and information
need to be included in your PowerPoint. Create a list of questions that the group still has
that may be extension questions. Reevaluate your group list of connections and chains.
Add our new understanding.
Five: Create a PowerPoint that describes your scientific understanding of polar ice melt, sea
level rise and the effect of interconnectedness of the ES systems. Include what you have
learned about thermal expansion, ocean circulation and effects of sea level rise on
community and ecology. Make sure that you use images, charts and /or graphs to help your
explanation and hold interest. Also, create a bulleted list of the important information you
are including. Share this list with your instructor and the other groups to get feedback to
prepare yourselves for the presentation. Give feedback to other groups on their lists. Revise
your PowerPoint if needed.
Six: Present it to the “United Nations” (This may include parents, school staff and students.)
Ask your Audience for feedback. Do they understand how polar ice melt is likely to affect
our ocean and our communities? Do they understand what is causing the melt? Do they
understand that this is a global problem with global solutions? What are some of the action
steps they think their governments might take to contribute to the solution of this problem?
Rubric follows
Resources:
There are several books in our library on climate on reserve.
Websites that you can type in or find as links on our blackboard page:
A web space devoted to the current state of our cryosphere. Great site including historic and
present information about polar ice. -Animation showing changes through time for months,
seasons and years. Graphs organize the information in a comprehensible way.
http://arctic.atmos.uiuc.edu/cryosphere/
NASA video on ice melt, feedback mechanisms and climate nice clear framing of the
problem.
http://www.nasa.gov/multimedia/nasatv/on_demand_video.html?param=http://anon.nasa-
global.edgesuite.net/anon.nasa-
global/ccvideos/GSFC_20080922_SeaIce.asx&_id=164871&_title=Sea%20Ice
%202008&_tnimage=279438main_sea_ice_videoSS_100.jpg
4. USGS information sites:
Overview of glacier information.
http://ga.water.usgs.gov/edu/earthglacier.html
World view of distribution of water by types
http://ga.water.usgs.gov/edu/waterdistribution.html
This USGS site gives Mean High Water Datum for determination of shoreline position from
topographic Lidar Data. It is useful survey on tide data around the coastal USofA.
http://pubs.usgs.gov/of/2005/1027/html/results.html
This site includes maps that show US land vulnerable to sea level rise. The US is broken
into 4 coastal regions and maps show land in danger at a 1.3 m rise and at a 3.3m rise.
http://yosemite.epa.gov/oar/GlobalWarming.nsf/content/ResourceCenterPublicationsSLRM
aps.html
The Netherlands is a country which is already partially below sealevel. This website tells a
little of the history of that decision. It would be a good place to begin an investigation on
the effects of sea level rise of that country.
http://geography.about.com/od/specificplacesofinterest/a/dykes.htm
National Oceanic and Atmospheric Administration -Greenhouse Gases- Frequently
Asked Questions. His is a good sight for quick general information about greenhouse gases.
http://lwf.ncdc.noaa.gov/oa/climate/gases.html
Woods Hole Oceanographic Institute study “New Study Reports Large-scale Salinity
Changes in the Oceans Saltier tropical oceans and fresher ocean waters near the poles”
Describe the changing salinity of our oceans, possible causes and effects.
http://www.whoi.edu/page.do?cid=897&pid=12455&tid=282
Woods Hole Oceanographic Institute article “Rising Sea Levels and Moving Shorelines
New tools and techniques show promise for better predictions and decisions about coastline
change” A discussion of the impacts on communities and land from rising sea levels.
Focused on the eastern shorelines of the USA.
http://www.whoi.edu/oceanus/viewArticle.do?id=2484
Snow and Ice Data Center page on State of the cryosphere discuss trends and links melt to
change in climate. There is particular attention paid to sea level rise.
http://nsidc.org/sotc/sea_level.html
Snow and Ice Data Center page on Data Global Land Ice Measurements from Space
(GLIMS) (an international project with the goal of surveying a majority of the world's
5. estimated 160000 glaciers.) Great graphs and images. http://nsidc.org/glims/glaciermelt/
A primary source paper on the possibility of sequestrating carbon by stabilizing CO2
underground.
http://carbonsequestration.us/Papers-presentations/htm/Pacala-Socolow-ScienceMag-
Aug2004.pdf
Intergovernmental panel on climate change. Climate change 2001 Working group
publication on general information on climate change during the last glacial period.
http://www.grida.no/publications/other/ipcc_tar/?src=/climate/ipcc_tar/wg1/074.htm
Good information on coastal populations, Topography, and Sea Level Rise and people
around the world who will be affected by sea level rise
http://www.giss.nasa.gov/research/briefs/gornitz_04/
Information of vulnerability of NY coast to storms under the conditions of sea level rise.
http://www.ccsr.columbia.edu/information/hurricanes/
Visit this great GIS site to see some of the land flood areas. Many click and map
information. https://www.cresis.ku.edu/research/data/sea_level_rise/index.html
6. Ice Melt- Student Lesson Rubric Sarah Brumberg
How do we handle the Global Implications of Polar Ice melt and the local impacts of sea level rise?
4Understanding content 3Understanding content 2Understanding content 1Understanding content 0Understanding content
PP demonstrated excellent PP offers excellent explanations PP offers some excellent PP has explanation for only a PP has many inaccuracy and does
understanding of the topic. of some topic parts or offers explanations but leaves many parts few parts of the topic and divide the topic into parts.
Explanations cover all topic parts reasonable and accurate out. PP offer brief incomplete or explanations are incomplete or
thoroughly and accurately explanations of all parts of topic. inaccurate explanations of topic inaccurate.
parts.
4Research 3Research 2Research 1Research 0Research
All question answers have citations Most question answers have Some question answers have Only a few sources are given Work is not cited.
to support the answers offered. citations to support the answers citations to support the answers and they are not credible.
Sources are all credible. (non- offered. Sources are all credible. offered. Many sources are missing
student .edu sites, or Paper or Or some sources are not credible. not credible.
electronic peer reviewed sources )
4Collaborate 3Collaborate 2Collaborate 1Collaborate 0Collaborate
Team members divided the work Most team members divided the A few team members did the work Most team members did not do Team members were not committe
equally and shared in the work equally and shared in the and shared in the responsibility of the work or share in the completing their task. Discussion
responsibility of completing high responsibility of completing high completing the work. No real responsibility of completing missing.
quality work. Discussion was rich quality work. Discussion was discussion of ideas took place. the work.
with ideas. brief. No real discussion of ideas
took place.
4Presentation & writing 3Presentation & writing 2Presentation & writing 1Presentation & writing 0Presentation & writing
Ideas are expressed clearly. Written Ideas are expressed clearly. Ideas may be difficult to follow. Ideas may be difficult to Ideas cannot be understood, All
information is free of spelling or Written information is may have Flow of PP is awkward and hiders follow. Flow of PP is awkward Charts and images are missing or
grammatical errors. Charts and some spelling or grammatical understanding. Or Images and charts and hiders understanding. And related to ideas..
images are included often to add to errors. Or only some charts and are missing or not related to ideas.. Most Images and charts are
audience understanding. images are included to add to missing or not related to ideas..
Audience members understand that audience understanding.
evacuation warning come from a
compelling risk.
Growth in Personal Understanding.
My thinking has definitely changed through this exploration. In terms of system thinking; I
think I did a little better this time round than I did in the first Unit. It’s interesting as I
practice system thinking more and more, it feels more automatic or natural. I was surprised
in this lesson how different scales seemed to collide. By that I mean, how much the tiny
amount of thermal expansion in a small amount of water can amount to when you take an
ocean of tiny amounts. How the 3% of all the water in the world is fresh and 2% is in ice.
2% is a small percent and yet it can lead to significant rise in the oceans. The cause comes
back to global warming. The inescapable global warming works it tendrils into the planet
while it elbows its way in as well. Addressing global warming has to be a pressing concern
of every science teacher.
Still I wish I knew more. Is it likely that the ocean circulation will stop? Will this cause an
ice age for a warmed planet? I think in terms of our national dialogue, it is difficult to
convey the pressing need for action when we don’t have all the predictive answers that some
seek. However, we need to be able to have these important discussions and still have
questions.