Enel SpA company analysis overview and key metrics
•
1 j'aime•697 vues

Enel SpA is an Italian electric utility company headquartered in Rome. It generates, transmits, distributes, and trades electricity across Europe, South America, and other international markets. Enel reported revenues of €75 billion in 2012 with over 82,000 employees worldwide. The majority of Enel's revenue comes from its operations in Europe, particularly Italy, where it generates and distributes electricity. Enel is majority owned by the Italian government and trades on the Milan stock exchange.

Recommandé
Recommandé
Contenu connexe
Tendances
Tendances (20)
En vedette
En vedette (14)
Similaire à Enel SpA company analysis overview and key metrics
Similaire à Enel SpA company analysis overview and key metrics (20)
Plus de BCV
Plus de BCV (20)
Dernier
Dernier (20)
Enel SpA company analysis overview and key metrics
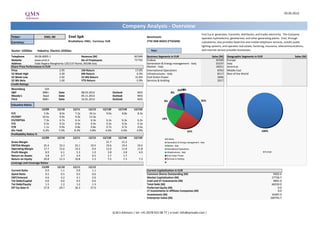
- 1. 03.05.2013 Ticker: Enel SpA Benchmark: Currency: BrsaItaliana: ENEL, Currency: EUR FTSE MIB INDEX (FTSEMIB) Sector: Utilities Industry: Electric Utilities Year: Telephone 39-06-8305-1 Revenue (M) Business Segments in EUR Sales (M) Geographic Segments in EUR Sales (M) Website www.enel.it No of Employees Endesa 34169 Europe 1 Address Viale Regina Margherita 125/137 Rome, 00198 Italy Generation & Energy management - Italy 25237 Italy Share Price Performance in EUR Market - Italy 18351 Americas Price 2.95 1M Return 17.0% International Operations 8703 Middle East 52 Week High 3.30 6M Return 0.3% Infrastructures - Italy 8117 Rest of the World 52 Week Low 2.02 52 Wk Return 31.6% Enel Green Power 2696 52 Wk Beta 1.00 YTD Return -5.9% Services & Holding 2017 Credit Ratings Bloomberg IG9 S&P BBB+ Date 08.03.2012 Outlook NEG Moody's Baa2 Date 05.11.2012 Outlook NEG Fitch BBB+ Date 16.01.2013 Outlook NEG Valuation Ratios 12/09 12/10 12/11 12/12 12/13E 12/14E 12/15E P/E 5.9x 8.0x 7.2x 34.1x 9.0x 8.8x 8.3x EV/EBIT 10.5x 9.9x 9.2x 13.3x - - - EV/EBITDA 7.3x 6.7x 6.1x 6.3x 6.3x 6.3x 6.2x P/S 0.5x 0.5x 0.4x 0.4x 0.3x 0.3x 0.3x P/B 1.1x 0.9x 0.8x 0.8x 0.7x 0.7x 0.6x Div Yield 6.2% 7.5% 8.3% 4.8% 4.6% 4.6% 4.9% Profitability Ratios % 12/09 12/10 12/11 12/12 12/13E 12/14E 12/15E Gross Margin - - - - 21.7 21.2 - EBITDA Margin 25.4 23.3 22.1 19.5 19.6 19.4 19.4 Operating Margin 17.7 15.6 14.5 9.4 12.0 11.8 11.8 Profit Margin 8.9 6.1 5.3 1.0 3.8 3.8 4.0 Return on Assets 3.8 2.7 2.4 0.5 1.7 1.7 - Return on Equity 20.8 12.3 10.8 2.3 7.5 7.3 7.3 Leverage and Coverage Ratios 12/09 12/10 12/11 12/12 Current Ratio 0.9 1.1 0.9 1.1 Current Capitalization in EUR Quick Ratio 0.5 0.5 0.5 0.6 Common Shares Outstanding (M) 9403.4 EBIT/Interest 4.6 4.2 4.1 2.6 Market Capitalization (M) 27758.7 Tot Debt/Capital 0.6 0.6 0.5 0.6 Cash and ST Investments (M) 9891.0 Tot Debt/Equity 1.5 1.2 1.2 1.3 Total Debt (M) 66539.0 Eff Tax Rate % 27.8 29.7 36.3 57.0 Preferred Equity (M) 0.0 LT Investments in Affiliate Companies (M) 0.0 Investments (M) 16387.0 Enterprise Value (M) 100793.7 Enel S.p.A. generates, transmits, distributes, and trades electricity. The Company operates hydroelectric, geothermal, and other generating plants. Enel, through subsidiaries, also provides fixed-line and mobile telephone services, installs public lighting systems, and operates real estate, factoring, insurance, telecommunications, and Internet service provider businesses. ENEL IM 82'699 73'702 Company Analysis - Overview 35% 25% 18% 9% 8% 3%2%0% Endesa Generation & Energy management - Italy Market - Italy International Operations Infrastructures - Italy Enel Green Power Services & Holding 100% Europe Q.M.S Advisors | tel: +41 (0)78 922 08 77 | e-mail: info@qmsadv.com |
- 2. Enel SpA Target price in EUR Date Buy Hold Sell Date Price Target Price Broker Analyst Recommendation Target Date 30-Apr-13 23% 65% 13% 3-May-13 2.95 2.92 Grupo Santander OSCAR NAJAR RIOS buy 3.87 3-May-13 29-Mar-13 24% 61% 15% 2-May-13 2.94 2.92 ICBPI SIMONA PEDRAZZINI neutral 2.84 2-May-13 28-Feb-13 27% 55% 18% 1-May-13 2.94 2.92 AlphaValue MYRIAM COHEN add 3.32 2-May-13 31-Jan-13 27% 52% 21% 30-Apr-13 2.94 2.92 Exane BNP Paribas PHILIP GOTTSCHALK underperform 2.50 30-Apr-13 31-Dec-12 24% 58% 18% 29-Apr-13 2.99 2.92 Goldman Sachs DARIO CARRADORI neutral/neutral 3.00 26-Apr-13 30-Nov-12 21% 61% 18% 26-Apr-13 2.89 2.92 Raymond James EMMANUEL RETIF market perform 17-Apr-13 31-Oct-12 24% 61% 15% 25-Apr-13 2.93 2.95 Banca IMI ROBERTO RANIERI hold 2.70 11-Apr-13 28-Sep-12 23% 60% 17% 24-Apr-13 2.90 2.95 Morgan Stanley EMMANUEL TURPIN Equalwt/In-Line 2.90 9-Apr-13 31-Aug-12 17% 64% 19% 23-Apr-13 2.86 2.97 Credit Suisse STEFANO BEZZATO neutral 2.85 9-Apr-13 31-Jul-12 17% 63% 20% 22-Apr-13 2.74 2.97 Banca Akros(ESN) DARIO MICHI hold 2.80 9-Apr-13 29-Jun-12 17% 63% 20% 19-Apr-13 2.67 2.98 Societe Generale ALBERTO PONTI buy 3.20 8-Apr-13 31-May-12 17% 58% 25% 18-Apr-13 2.65 2.98 Centrobanca EDOARDO MONTALBANO hold 2.70 3-Apr-13 17-Apr-13 2.60 2.98 JPMorgan JAVIER GARRIDO underweight 2.60 25-Mar-13 16-Apr-13 2.62 2.98 HSBC ADAM DICKENS underweight 2.40 21-Mar-13 15-Apr-13 2.64 2.98 S&P Capital IQ CLIVE ROBERTS buy 2.93 18-Mar-13 12-Apr-13 2.65 2.98 Day by Day VALERIE GASTALDY hold 18-Mar-13 11-Apr-13 2.70 2.98 Deutsche Bank VIRGINIA SANZ DE MADRID hold 2.80 15-Mar-13 10-Apr-13 2.70 2.98 Independent Research GmbH SVEN DIERMEIER hold 2.70 14-Mar-13 9-Apr-13 2.61 3.03 Espirito Santo Investment Bank Research FERNANDO GARCIA GARCIA neutral 3.10 14-Mar-13 8-Apr-13 2.58 3.04 Natixis PHILIPPE OURPATIAN neutral 2.64 14-Mar-13 5-Apr-13 2.58 3.04 Kepler Capital Markets CLAUDIA INTROVIGNE hold 2.60 13-Mar-13 4-Apr-13 2.53 3.04 Landesbank Baden-Wuerttemberg ERKAN AYCICEK hold 3.00 6-Feb-13 3-Apr-13 2.52 3.04 Berenberg Bank TEAM COVERAGE hold 3.30 5-Feb-13 2-Apr-13 2.60 3.04 Barclays SUSANNA INVERNIZZI equalweight 3.50 25-Jan-13 1-Apr-13 2.55 3.04 EVA Dimensions AUSTIN BURKETT overweight 17-Jan-13 29-Mar-13 2.55 3.04 Equita SIM SpA ROBERTO LETIZIA hold 3.30 30-Nov-12 28-Mar-13 2.55 3.04 Banco Sabadell JORGE GONZALEZ SADORNIL sell 3-Aug-12 27-Mar-13 2.54 3.06 Nord/LB HEINO HAMMANN hold 5-Jun-12 26-Mar-13 2.57 3.06 Hammer Partners SA CHRIS MOORE sell 8-Mar-12 25-Mar-13 2.61 3.06 DZ Bank AG HASIM SENGUEL hold 3.20 18-Nov-11 Company Analysis - Analysts Ratings Buy and Sell Recommendations vs Price and Target Price 17% 17% 17% 17% 23% 24% 21% 24% 27% 27% 24% 23% 58% 63% 63% 64% 60% 61% 61% 58% 52% 55% 61% 65% 25% 20% 20% 19% 17% 15% 18% 18% 21% 18% 15% 13% 0% 20% 40% 60% 80% 100% mai.12 juin.12 juil.12 août.12 sept.12 oct.12 nov.12 déc.12 janv.13 févr.13 mars.13 avr.13 BrokerRecommendation 0 1 1 2 2 3 3 4 4 5 5 Price Buy Hold Sell Price Target Price Brokers' Target Price 0 1 1 2 2 3 3 4 4 5 GrupoSantander ICBPI AlphaValue ExaneBNPParibas GoldmanSachs RaymondJames BancaIMI MorganStanley CreditSuisse BancaAkros(ESN) SocieteGenerale Centrobanca JPMorgan HSBC S&PCapitalIQ DaybyDay DeutscheBank IndependentResearchGmbH EspiritoSantoInvestmentBank Research Natixis KeplerCapitalMarkets LandesbankBaden- Wuerttemberg BerenbergBank Barclays EVADimensions EquitaSIMSpA BancoSabadell Nord/LB HammerPartnersSA DZBankAG Q.M.S Advisors | tel: +41 (0)78 922 08 77 | e-mail: info@qmsadv.com |
- 3. 03.05.2013 Enel SpA Ownership Statistics Geographic Ownership Distribution Shares Outstanding (M) 9403.4 Italy 81.69% Float 68.8% United States 5.98% Short Interest (M) Luxembourg 4.24% Short Interest as % of Float France 1.91% Days to Cover Shorts Ireland 1.50% Institutional Ownership 38.70% Germany 1.35% Retail Ownership 61.30% Britain 0.81% Insider Ownership 0.00% Others 2.53% Institutional Ownership Distribution Government 80.73% Investment Advisor 19.16% Insurance Company 0.06% Hedge Fund Manager 0.05% Pricing data is in EUR Others 0.00% Top 20 Owners: Holder Name Position Position Change Market Value % of Ownership Report Date Source Country MINISTERO DELL'ECONO 2'937'984'993 0 8'672'931'699 31.24% 20.11.2012 EXCH ITALY BLACKROCK 100'480'950 230'633 296'619'764 1.07% 01.05.2013 ULT-AGG UNITED STATES VANGUARD GROUP INC 68'741'014 2'459'753 202'923'473 0.73% 31.03.2013 MF-AGG UNITED STATES PICTET ASSET MANAGEM 52'151'916 -26'014'603 153'952'456 0.55% 31.01.2013 MF-AGG BRITAIN FMR LLC 31'343'024 6'530'806 92'524'607 0.33% 31.03.2013 ULT-AGG UNITED STATES AMUNDI 22'887'035 8'411'425 67'562'527 0.24% 31.12.2012 MF-AGG FRANCE MERCURY ASSET MANAGE 16'888'699 0 49'855'439 0.18% 01.05.2013 MF-AGG IRELAND STATE STREET 15'692'915 1'496'958 46'325'485 0.17% 02.05.2013 ULT-AGG UNITED STATES BNP PARIBAS INV PART 13'158'176 -1'671'692 38'842'936 0.14% 28.02.2013 ULT-AGG FRANCE ARCA SGR SPA 12'811'686 -50'000 37'820'097 0.14% 28.03.2013 MF-AGG ITALY ALLIANZ ASSET MANAGE 12'805'557 -24'665 37'802'004 0.14% 28.03.2013 ULT-AGG GERMANY AVIVA PLC 9'331'460 317'904 27'546'470 0.10% 28.03.2013 MF-AGG BRITAIN CREDIT SUISSE ASSET 8'917'565 24'838 26'324'652 0.09% 28.02.2013 MF-AGG SWITZERLAND ING INTERNATIONAL AD 7'795'262 -260'134 23'011'613 0.08% 31.01.2013 MF-AGG LUXEMBOURG UNION INVESTMENT LUX 7'754'520 -198'780 22'891'343 0.08% 28.09.2012 MF-AGG LUXEMBOURG BANK OF NEW YORK MEL 7'092'561 21'014 20'937'240 0.08% 01.05.2013 MF-AGG UNITED STATES DEKA INVESTMENT GMBH 6'703'470 3'326'443 19'788'643 0.07% 28.02.2013 MF-AGG GERMANY JOHN HANCOCK INVESTM 6'490'913 -438'855 19'161'175 0.07% 28.02.2013 MF-AGG UNITED STATES SCHRODER INVESTMENT 6'322'995 2'679'130 18'665'481 0.07% 31.03.2013 MF-AGG BRITAIN WELLS FARGO 6'306'114 -1'854 18'615'649 0.07% 28.02.2013 ULT-AGG Top 5 Insiders: Holder Name Position Position Change Market Value % of Ownership Report Date Source Company Analysis - Ownership Ownership Type 39% 61% 0% Institutional Ownership Retail Ownership Insider Ownership Geographic Ownership 81% 3% 4% 2% 2% 1% 1% 6% Italy United States Luxembourg France Ireland Germany Britain Others Institutional Ownership 81% 0% 0% 0% 19% Government Investment Advisor Insurance Company Hedge Fund Manager Others TOP 20 ALL Q.M.S Advisors | tel: +41 (0)78 922 08 77 | e-mail: info@qmsadv.com |
- 4. Enel SpA Financial information is in EUR (M) Periodicity: 12/02 12/03 12/04 12/05 12/06 12/07 12/08 12/09 12/10 12/11 12/12 12/13E 12/14E 12/15E Income Statement Revenue 28'415 28'937 28'658 32'272 37'497 42'734 59'577 62'498 71'943 77'573 82'699 81'744 82'557 84'309 - Cost of Goods Sold Gross Income 17'738 17'502 - Selling, General & Admin Expenses 26'245 25'613 25'141 28'521 32'957 36'907 51'643 53'330 62'119 68'236 77'154 (Research & Dev Costs) 100 16 Operating Income 2'880 4'732 5'870 5'538 5'556 6'781 9'541 11'032 11'258 11'278 7'735 9'840 9'738 9'921 - Interest Expense 1'464 1'555 771 686 635 1'498 3'274 2'416 2'667 2'753 2'932 - Foreign Exchange Losses (Gains) 0 0 -22 29 -83 -319 -167 -17 509 417 -67 - Net Non-Operating Losses (Gains) -963 -216 103 29 -164 -306 55 -712 8 -242 50 Pretax Income 2'379 3'393 5'018 4'794 5'168 5'908 6'379 9'345 8'074 8'350 4'820 6'938 7'011 7'373 - Income Tax Expense 608 966 2'116 1'934 2'067 1'956 585 2'597 2'401 3'027 2'745 Income Before XO Items 1'771 2'427 2'902 2'860 3'101 3'952 5'794 6'748 5'673 5'323 2'075 - Extraordinary Loss Net of Tax 155 -1'272 0 -179 -240 158 - Minority Interests -237 -82 116 237 65 215 741 1'004 1'283 1'210 1'210 Diluted EPS Before XO Items 0.42 0.41 0.43 0.53 0.72 0.69 0.47 0.44 0.09 Net Income Adjusted* 2'008 2'509 3'419 2'623 3'036 3'433 5'053 5'553 4'380 4'148 3'455 3'074 3'114 3'343 EPS Adjusted 0.29 0.36 0.50 0.41 0.43 0.49 0.72 0.66 0.47 0.44 0.37 0.33 0.34 0.35 Dividends Per Share 0.32 0.32 0.61 0.56 0.43 0.43 0.43 0.25 0.28 0.26 0.15 0.14 0.14 0.15 Payout Ratio % 108.7 87.0 155.0 148.1 104.7 81.1 60.0 40.9 60.0 64.0 163.1 0.42 0.40 0.41 Total Shares Outstanding 6'878 6'878 6'924 6'985 7'006 7'016 7'018 9'403 9'403 9'403 9'403 Diluted Shares Outstanding 6'901 6'954 7'073 7'096 7'017 8'369 9'403 9'403 9'403 EBITDA 7'357 9'248 9'355 8'407 7'909 9'694 13'722 15'883 16'768 17'110 16'150 16'054 16'053 16'342 *Net income excludes extraordinary gains and losses and one-time charges. Equivalent Estimates Company Analysis - Financials I/IV Fiscal Year Q.M.S Advisors | tel: +41 (0)78 922 08 77 | e-mail: info@qmsadv.com |
- 5. Periodicity: 12/02 12/03 12/04 12/05 12/06 12/07 12/08 12/09 12/10 12/11 12/12 12/13E 12/14E 12/15E Balance Sheet Total Current Assets 15382 17048 13532 12746 13000 35895 32903 29462 37775 35967 38539 + Cash & Near Cash Items 364 426 331 476 547 1'234 5'106 4'170 5'164 7'015 9'891 + Short Term Investments 552 545 32 28 25 + Accounts & Notes Receivable 6'924 6'972 8'027 8'316 7'958 11'576 12'378 13'010 12'505 11'570 11'719 + Inventories 3'266 4'211 1'345 884 1'209 1'726 2'182 2'500 2'803 3'148 3'338 + Other Current Assets 4'276 4'894 3'797 3'042 3'261 21'359 13'237 9'782 17'303 14'234 13'591 Total Long-Term Assets 52'555 52'791 51'846 37'756 41'537 94'956 100'304 132'869 130'277 133'924 133'117 + Long Term Investments 282 91 68 170 481 37 462 295 299 245 197 Gross Fixed Assets 84'274 87'531 86'751 74'588 82'139 109'023 111'371 130'281 161'419 166'648 173'382 Accumulated Depreciation 46'741 49'998 50'049 44'400 47'293 48'541 49'846 53'694 83'325 86'056 90'267 + Net Fixed Assets 37'533 37'533 36'702 30'188 34'846 60'482 61'525 76'587 78'094 80'592 83'115 + Other Long Term Assets 14'740 15'167 15'076 7'398 6'210 34'437 38'317 55'987 51'884 53'087 49'805 Total Current Liabilities 22'301 23'290 18'607 13'446 13'586 29'356 33'116 33'262 34'990 40'706 35'371 + Accounts Payable 6'664 5'602 6'818 6'610 6'188 9'622 10'600 11'174 12'373 12'931 13'903 + Short Term Borrowings 8'371 8'648 6'829 2'472 1'409 8'014 8'577 10'451 11'208 14'471 8'027 + Other Short Term Liabilities 7'266 9'040 4'960 4'364 5'989 11'720 13'939 11'637 11'409 13'304 13'441 Total Long Term Liabilities 25'381 27'190 27'705 17'640 21'926 74'862 73'796 83'136 79'517 74'885 83'127 + Long Term Borrowings 18'292 20'488 20'291 10'967 12'194 53'826 53'653 58'814 55'031 51'010 58'512 + Other Long Term Borrowings 7'089 6'702 7'414 6'673 9'732 21'036 20'143 24'322 24'486 23'875 24'615 Total Liabilities 47'682 50'480 46'312 31'086 35'512 104'218 106'912 116'398 114'507 115'591 118'498 + Long Preferred Equity 0 0 0 0 0 0 0 0 0 + Minority Interest 70 191 1'113 359 565 7'080 5'897 12'665 15'684 15'650 16'387 + Share Capital & APIC 6'063 6'063 6'312 6'668 6'783 6'835 6'848 14'695 14'695 14'695 14'695 + Retained Earnings & Other Equity 14'709 15'061 11'641 12'389 11'677 12'718 13'550 18'573 23'166 23'955 22'076 Total Shareholders Equity 20'842 21'315 19'066 19'416 19'025 26'633 26'295 45'933 53'545 54'300 53'158 Total Liabilities & Equity 68'524 71'795 65'378 50'502 54'537 130'851 133'207 162'331 168'052 169'891 171'656 Book Value Per Share 3.02 3.07 2.59 2.73 2.63 2.79 2.91 3.54 4.03 4.11 3.91 4.26 4.43 4.63 Tangible Book Value Per Share 1.13 1.10 1.14 2.42 2.21 -0.74 -0.77 -0.58 -0.13 -0.04 0.09 Company Analysis - Financials II/IV Q.M.S Advisors | tel: +41 (0)78 922 08 77 | e-mail: info@qmsadv.com |
- 6. Periodicity: 12/02 12/03 12/04 12/05 12/06 12/07 12/08 12/09 12/10 12/11 12/12 12/13E 12/14E 12/15E Cash Flows Net Income 2'008 2'509 2'631 3'895 3'036 3'916 5'293 5'586 4'390 4'113 865 3'094 3'192 3'463 + Depreciation & Amortization 4'477 4'516 3'485 2'869 2'353 2'913 4'181 4'851 5'510 5'832 8'415 + Other Non-Cash Adjustments -2'135 518 253 -792 748 38 -1'427 -999 996 640 1'171 + Changes in Non-Cash Capital 443 -370 -1'534 -279 619 -797 2'463 -512 829 1'128 -36 Cash From Operating Activities 4'793 7'173 4'835 5'693 6'756 6'070 10'510 8'926 11'725 11'713 10'415 + Disposal of Fixed Assets 3'778 884 0 0 0 0 0 + Capital Expenditures -5'109 -3'623 -3'538 -3'037 -2'759 -4'882 -7'059 -6'591 -6'468 -6'957 -6'522 -5'928 -5'565 -4'929 + Increase in Investments -2'378 -1'638 -126 -524 0 0 -42 + Decrease in Investments 0 1'941 4'652 0 267 0 + Other Investing Activities -497 -318 -230 1 385 -30'738 4'961 -6'085 1'558 -443 -66 Cash From Investing Activities -4'206 -4'695 -1'953 1'092 -2'374 -35'353 -2'140 -12'676 -4'910 -7'400 -6'588 + Dividends Paid -2'183 -2'183 -4'256 -3'472 -3'959 -3'180 -3'401 -3'135 -3'147 -3'517 -2'229 + Change in Short Term Borrowings 924 -2'056 0 0 0 0 + Increase in Long Term Borrowings 1'382 2'069 1'039 0 1'524 33'356 4'788 21'990 5'497 10'486 13'739 + Decrease in Long Term Borrowings 0 0 -3'524 -1'995 0 -5'916 -24'180 -10'748 -9'427 -12'505 + Increase in Capital Stocks 0 241 339 108 50 12 7'991 + Decrease in Capital Stocks 0 0 0 0 0 0 + Other Financing Activities -897 -256 5 17 4 -52 -105 162 2'636 -125 29 Cash From Financing Activities -774 -2'426 -2'971 -6'640 -4'318 30'174 -4'622 2'828 -5'762 -2'583 -966 Net Changes in Cash -187 52 -89 145 64 891 3'748 -922 1'053 1'730 2'861 Free Cash Flow (CFO-CAPEX) -316 3'550 1'297 2'656 3'997 1'188 3'451 2'335 5'257 4'756 3'893 3'014 3'763 4'108 Free Cash Flow To Firm 774 4'662 1'743 3'065 4'378 2'190 6'425 4'080 7'131 6'511 5'155 Free Cash Flow To Equity 5'768 4'447 34'544 2'323 145 6 5'815 5'127 Free Cash Flow per Share -0.05 0.52 0.19 0.38 0.57 0.17 0.49 0.28 0.56 0.51 0.41 Company Analysis - Financials III/IV Q.M.S Advisors | tel: +41 (0)78 922 08 77 | e-mail: info@qmsadv.com |
- 7. Periodicity: 12/02 12/03 12/04 12/05 12/06 12/07 12/08 12/09 12/10 12/11 12/12 12/13E 12/14E 12/15E Ratio Analysis Valuation Ratios Price Earnings 15.0x 13.0x 15.2x 14.3x 15.9x 13.5x 5.5x 5.9x 8.0x 7.2x 34.1x 9.0x 8.8x 8.3x EV to EBIT 19.4x 12.9x 12.3x 9.8x 11.1x 17.4x 9.5x 10.5x 9.9x 9.2x 13.3x EV to EBITDA 7.6x 6.6x 7.7x 6.4x 7.8x 12.2x 6.6x 7.3x 6.7x 6.1x 6.3x 6.3x 6.3x 6.2x Price to Sales 1.1x 1.1x 1.5x 1.3x 1.3x 1.2x 0.5x 0.5x 0.5x 0.4x 0.4x 0.3x 0.3x 0.3x Price to Book 1.4x 1.5x 2.5x 2.1x 2.6x 2.6x 1.4x 1.1x 0.9x 0.8x 0.8x 0.7x 0.7x 0.6x Dividend Yield 7.3% 6.7% 9.5% 9.5% 6.3% 6.0% 10.8% 6.2% 7.5% 8.3% 4.8% 4.6% 4.6% 4.9% Profitability Ratios Gross Margin 21.7% 21.2% EBITDA Margin 25.9% 32.0% 32.6% 26.1% 21.1% 22.7% 23.0% 25.4% 23.3% 22.1% 19.5% 19.6% 19.4% 19.4% Operating Margin 10.1% 16.4% 20.5% 17.2% 14.8% 15.9% 16.0% 17.7% 15.6% 14.5% 9.4% 12.0% 11.8% 11.8% Profit Margin 7.1% 8.7% 9.2% 12.1% 8.1% 9.2% 8.9% 8.9% 6.1% 5.3% 1.0% 3.8% 3.8% 4.0% Return on Assets 3.0% 3.6% 3.9% 6.7% 5.8% 4.2% 4.0% 3.8% 2.7% 2.4% 0.5% 1.7% 1.7% Return on Equity 9.6% 12.0% 13.5% 21.0% 16.2% 20.6% 26.5% 20.8% 12.3% 10.8% 2.3% 7.5% 7.3% 7.3% Leverage & Coverage Ratios Current Ratio 0.69 0.73 0.73 0.95 0.96 1.22 0.99 0.89 1.08 0.88 1.09 Quick Ratio 0.35 0.34 0.45 0.66 0.63 0.44 0.53 0.52 0.50 0.46 0.61 Interest Coverage Ratio (EBIT/I) 1.97 3.04 7.61 8.07 8.75 4.53 2.91 4.57 4.22 4.10 2.64 Tot Debt/Capital 0.56 0.58 0.59 0.41 0.42 0.70 0.70 0.60 0.55 0.55 0.56 Tot Debt/Equity 1.28 1.37 1.42 0.69 0.72 2.32 2.37 1.51 1.24 1.21 1.25 Others Asset Turnover 0.43 0.42 0.42 0.56 0.71 0.46 0.45 0.42 0.44 0.46 0.48 Accounts Receivable Turnover 4.14 4.16 3.82 3.95 4.61 4.38 4.97 4.92 5.64 6.44 7.10 Accounts Payable Turnover Inventory Turnover Effective Tax Rate 25.6% 28.5% 42.2% 40.3% 40.0% 33.1% 9.2% 27.8% 29.7% 36.3% 57.0% Company Analysis - Financials IV/IV Q.M.S Advisors | tel: +41 (0)78 922 08 77 | e-mail: info@qmsadv.com |
- 8. ENEL SPA E.ON SE EDF IBERDROLA SA A2A SPA RWE AG ACEA SPA GDF SUEZ ENDESA TERNA SPA SNAM SPA GAS NATURAL SDG ACQUE POTABILI EDP FORTUM OYJ 12/2012 12/2012 12/2012 12/2012 12/2012 12/2012 12/2012 12/2012 12/2012 12/2012 12/2012 12/2012 12/2012 12/2012 12/2012 3.30 19.80 17.91 4.29 0.65 36.47 5.45 20.35 19.53 3.58 3.86 16.39 0.86 2.63 16.69 14.01.2013 14.09.2012 03.07.2012 02.01.2013 03.05.2013 12.09.2012 03.05.2013 21.08.2012 13.03.2013 02.05.2013 23.04.2013 03.05.2013 18.10.2012 25.04.2013 08.05.2012 2.02 12.42 13.39 2.63 0.29 25.83 3.61 14.05 11.30 2.50 3.07 8.36 0.43 1.63 12.81 24.07.2012 08.02.2013 29.11.2012 26.07.2012 25.07.2012 19.04.2013 14.06.2012 01.03.2013 25.07.2012 25.07.2012 24.07.2012 23.07.2012 31.07.2012 31.05.2012 23.07.2012 19'556'433 13'678'918 2'094'980 22'882'805 22'724'276 2'227'976 152'056 3'340'397 94'084 4'308'422 3'144'732 749'352 500 1'956'544 2'859'551 2.96 13.97 17.84 4.20 0.63 27.72 5.32 16.66 17.45 3.51 3.74 16.31 0.79 2.61 14.52 -10.2% -29.5% -0.4% -2.2% -2.9% -24.0% -2.5% -18.2% -10.6% -1.9% -3.0% -0.5% -8.2% -0.8% -13.0% 46.6% 12.4% 33.2% 59.6% 118.8% 7.3% 47.1% 18.5% 54.4% 40.3% 22.1% 95.0% 82.1% 60.3% 13.3% 9'403.4 1'906.8 1'846.7 6'053.2 3'106.0 614.7 213.0 2'357.3 1'058.8 2'010.0 3'568.3 1'000.7 36.0 3'624.6 888.4 27'853 27'944 32'975 26'368 1'961 16'991 1'132 40'186 18'475 7'055 12'661 16'316 28 9'544 12'899 66'539.0 25'944.0 64'501.0 32'884.1 5'024.0 19'946.0 3'104.4 57'552.0 10'860.0 8'978.8 12'554.0 20'201.0 31.0 20'524.0 8'777.0 - - - - - - - - - - - - - - - 16'387.0 3'862.0 4'854.0 324.8 851.0 1'613.0 77.3 11'462.0 5'716.0 - 1.0 1'618.0 - 3'239.0 616.0 9'891.0 6'097.0 22'307.0 6'575.5 553.0 5'276.0 423.7 11'383.0 7'423.0 2'510.1 15.0 5'693.0 7.7 2'123.0 963.0 100'888 51'653 80'023 54'025 7'283 33'274 3'890 97'817 27'628 13'524 24'800 32'442 60 31'184 20'999 LFY 82'699.0 132'093.0 72'729.0 34'201.2 6'281.0 50'771.0 3'526.3 97'038.0 33'933.0 1'732.8 3'730.0 24'904.0 58.6 16'339.9 6'159.0 LTM 82'699.0 132'093.0 72'729.0 34'597.8 6'281.0 50'771.0 3'526.3 97'038.0 33'781.0 1'732.8 3'751.0 24'904.0 58.6 16'048.9 6'249.0 CY+1 81'744.2 111'418.7 73'749.5 33'746.5 6'899.0 53'546.9 3'549.8 81'162.0 33'336.3 1'862.0 3'577.1 24'437.8 - 15'466.6 6'344.3 CY+2 82'556.8 112'638.7 75'979.2 34'867.6 6'957.0 53'803.9 3'597.0 81'900.2 34'224.8 1'917.0 3'660.1 25'224.7 - 16'116.3 6'470.1 LFY 1.2x 0.4x 1.0x 1.5x 1.1x 0.7x 1.1x 1.0x 0.8x 7.2x 6.5x 1.2x 0.9x 1.8x 3.6x LTM 1.2x 0.4x 1.0x 1.5x 1.1x 0.7x 1.1x 1.0x 0.8x 7.2x 6.4x 1.2x 0.9x 1.8x 3.5x CY+1 1.1x 0.5x 1.1x 1.6x 1.0x 0.6x 1.0x 1.1x 0.9x 7.3x 7.2x 1.3x - 2.0x 3.4x CY+2 1.0x 0.4x 1.1x 1.5x 1.0x 0.6x 1.0x 1.0x 0.8x 7.3x 7.3x 1.2x - 1.9x 3.3x LFY 16'150.0 8'443.0 14'342.0 7'177.7 990.0 9'055.0 695.2 18'401.0 7'005.0 1'372.7 2'813.0 4'865.0 12.8 3'612.0 2'360.0 LTM 16'150.0 8'443.0 14'342.0 7'639.5 1'098.0 9'201.0 627.4 18'401.0 7'031.0 1'372.7 2'822.0 4'885.0 12.1 3'720.6 2'413.0 CY+1 16'053.9 9'554.8 15'982.1 7'580.0 1'160.3 8'828.3 713.3 13'786.8 6'625.3 1'445.4 2'781.9 4'906.8 - 3'645.3 2'446.0 CY+2 16'053.2 9'754.7 17'030.6 7'816.1 1'157.2 8'597.0 730.3 13'928.0 6'760.7 1'498.9 2'855.7 5'024.0 - 3'860.7 2'428.7 LFY 6.3x 6.0x 5.1x 7.0x 6.7x 3.9x 5.4x 5.1x 3.9x 9.1x 8.6x 6.1x 4.1x 8.3x 9.3x LTM 6.3x 6.0x 5.1x 6.6x 6.1x 3.9x 5.9x 5.1x 3.8x 9.1x 8.6x 6.1x 4.4x 7.9x 9.1x CY+1 5.4x 5.3x 5.0x 7.2x 6.0x 3.9x 5.1x 6.2x 4.4x 9.4x 9.3x 6.6x - 8.4x 8.8x CY+2 5.2x 5.1x 4.8x 6.8x 5.8x 4.0x 5.0x 6.0x 3.9x 9.3x 9.3x 6.2x - 7.8x 8.8x LFY 0.09 1.81 2.06 0.46 0.06 1.95 0.36 1.33 1.93 0.23 0.23 1.43 0.00 0.28 - LTM 0.09 1.14 1.80 0.44 0.06 2.13 0.36 0.71 1.92 0.23 0.22 1.46 0.00 0.30 1.48 CY+1 0.33 1.32 1.74 0.40 0.06 3.89 0.54 1.36 1.72 0.23 0.27 1.35 - 0.26 1.29 CY+2 0.34 1.39 1.92 0.41 0.05 3.48 0.55 1.42 1.84 0.25 0.29 1.44 - 0.28 1.25 LFY 32.2x 12.3x 9.9x 9.6x 10.8x 13.0x 14.6x 23.4x 9.1x 15.2x 17.0x 11.2x 392.5x 8.7x 9.8x LTM - 7.7x 9.9x 9.5x 10.8x 13.0x 14.6x 12.5x 8.9x 15.2x - - 14017.9x 8.8x - CY+1 9.1x 10.6x 10.3x 10.5x 11.2x 7.1x 9.8x 12.3x 10.1x 15.1x 13.7x 12.1x - 10.1x 11.2x CY+2 8.8x 10.1x 9.3x 10.3x 12.5x 8.0x 9.6x 11.7x 9.5x 13.9x 12.9x 11.3x - 9.4x 11.7x 1 Year 6.6% 16.9% 11.4% 8.1% 3.0% 3.3% 9.6% 7.0% 3.8% 8.9% 5.4% 18.2% 3.6% 8.1% (0.0%) 5 Year 9.1% 16.4% 6.1% 8.2% - 4.1% 63.7% 7.2% 43.3% 6.9% 18.1% 19.2% (4.5%) 9.5% 7.1% 1 Year (5.6%) 97.8% 1.7% 2.5% 55.4% 9.3% 22.2% 14.5% (3.6%) 12.4% 7.3% 3.6% 4.9% (3.8%) (1.5%) 5 Year 10.7% (5.3%) (1.7%) 8.0% 14.2% 3.1% 8.2% 20.7% 1.1% 7.2% 13.2% 17.0% (3.0%) 6.1% 3.4% LTM 19.5% 6.4% 19.7% 22.1% 17.5% 18.1% 17.8% 19.0% 20.8% 79.2% 75.2% 19.6% 21.2% 23.2% 38.6% CY+1 19.6% 8.6% 21.7% 22.5% 16.8% 16.5% 20.1% 17.0% 19.9% 77.6% 77.8% 20.1% - 23.6% 38.6% CY+2 19.4% 8.7% 22.4% 22.4% 16.6% 16.0% 20.3% 17.0% 19.8% 78.2% 78.0% 19.9% - 24.0% 37.5% Total Debt / Equity % 181.0% 74.2% 249.4% 97.4% 176.5% 134.6% 247.3% 96.3% 52.6% 321.3% 211.7% 152.3% 36.9% 250.5% 86.0% Total Debt / Capital % 55.6% 40.1% 67.7% 49.1% 57.6% 54.8% 70.0% 44.7% 29.2% 76.3% 67.9% 57.6% 26.9% 64.2% 44.8% Total Debt / EBITDA 4.120x 3.073x 4.497x 4.335x 4.576x 2.168x 4.948x 3.128x 1.545x 6.541x 4.302x 4.135x 3.585x 5.549x 3.793x Net Debt / EBITDA 3.508x 2.351x 2.942x 3.586x 4.072x 1.594x 4.273x 2.509x 0.489x 4.712x 4.301x 2.970x 2.610x 4.953x 3.080x EBITDA / Int. Expense 5.508x 2.900x 5.871x 4.822x 3.944x 7.250x 5.693x 7.199x 10.317x 6.826x 7.015x 5.624x 5.398x 3.460x 7.867x S&P LT Credit Rating BBB+ A- A+ BBB BBB BBB+ BBB- A *- BBB+ A- A- BBB - BB+ A- S&P LT Credit Rating Date 08.03.2012 27.07.2012 17.01.2012 28.11.2012 05.04.2012 27.07.2012 31.10.2012 29.01.2013 08.03.2012 08.03.2012 13.06.2012 17.12.2010 - 01.02.2012 27.11.2012 Moody's LT Credit Rating Baa2 A3 Aa3 (P)Baa1 Baa3 A3 - A1 WR Baa1 Baa1 WR - Ba1 A2 Moody's LT Credit Rating Date 05.11.2012 05.10.2011 14.01.2009 05.11.2012 19.11.2012 19.07.2011 - 03.07.2012 25.02.2009 16.07.2012 27.09.2012 27.10.1999 - 16.02.2012 15.07.2005 52-Week High Date 52-Week Low Latest Fiscal Year: 52-Week High Total Debt Market Capitalization Daily Volume 52-Week Low % Change Current Price (5/dd/yy) 52-Week High % Change Cash and Equivalents EBITDA EV/EBITDA Enterprise Value Valuation Preferred Stock 52-Week Low Date Minority Interest Total Common Shares (M) P/E Revenue Growth Total Revenue EV/Total Revenue EPS EBITDA Growth EBITDA Margin Credit Ratings Leverage/Coverage Ratios Company Analysis - Peers Comparision Q.M.S Advisors | tel: +41 (0)78 922 08 77 | e-mail: info@qmsadv.com |