Fundamental Equity Analysis and Analyst Recommandations - MSCI Emerging Marke...
Financial Analysis - Veolia environnement operates utility and public tran…
1. 15.03.2013
Company Analysis - Overview
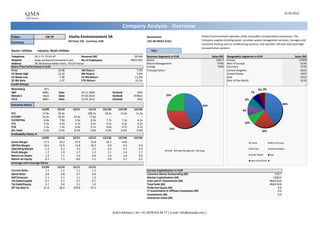
Ticker: VIE FP Veolia Environnement SA Benchmark: Veolia Environnement operates utility and public transportation businesses. The
EN Paris: VIE, Currency: EUR CAC 40 INDEX (CAC) Company supplies drinking water, provides waste management services, manages and
Currency:
maintains heating and air conditioning systems, and operates rail and road passenger
transportation systems.
Sector: Utilities Industry: Multi-Utilities Year:
Telephone 33-1-71-75-01-67 Revenue (M) 29'439 Business Segments in EUR Sales (M) Geographic Segments in EUR Sales (M)
Website www.veoliaenvironnement.com No of Employees #N/A N/A Water 12617 France 11459
Address 36-38 Avenue Kleber Paris, 75116 France Waste Management 9740 Rest of Europe 5536
Share Price Performance in EUR Energy 7290 Germany 2739
Price 10.08 1M Return 7.5% Transportation United Kingdom 2632
52 Week High 12.16 6M Return 5.6% United States 2287
52 Week Low 7.38 52 Wk Return -11.0% Asia 1912
52 Wk Beta 1.07 YTD Return 10.1% Rest of the World 1610
Credit Ratings
Bloomberg HY1 6% 0%
S&P BBB+ Date 24.11.2000 Outlook NEG 7%
Moody's Baa1 Date 07.02.2012 Outlook STABLE 25%
Fitch BBB+ Date 22.05.2012 Outlook NEG 8%
Valuation Ratios 40%
42%
12/09 12/10 12/11 12/12 12/13E 12/14E 12/15E 9%
P/E 17.8x 20.4x - 508.3x 18.3x 13.6x 11.5x
EV/EBIT 16.4x 16.3x 23.4x 17.6x - - -
EV/EBITDA 8.6x 7.9x 5.9x 6.0x 7.7x 7.2x 6.4x
P/S 0.3x 0.4x 0.1x 0.2x 0.2x 0.2x 0.2x 10%
P/B 1.5x 1.3x 0.6x 0.7x 0.6x 0.7x 0.7x
33%
Div Yield 5.2% 5.5% 8.3% 7.6% 6.6% 6.6% 6.6% 20%
Profitability Ratios %
12/09 12/10 12/11 12/12 12/13E 12/14E 12/15E
Gross Margin 17.2 19.2 15.9 15.8 16.2 16.8 - France Rest of Europe
EBITDA Margin 10.0 12.9 12.8 10.2 9.0 9.4 9.9
Operating Margin 5.3 6.2 3.2 3.5 4.3 4.7 5.3 Germany United Kingdom
Water Waste Management Energy
Profit Margin 1.7 1.9 -1.7 1.3 1.1 1.4 1.7
United States Asia
Return on Assets 1.2 1.1 -1.0 0.8 1.6 1.8 0.9
Return on Equity 8.1 7.3 -6.6 5.5 4.0 5.1 6.2 Rest of the World
Leverage and Coverage Ratios
12/09 12/10 12/11 12/12
Current Ratio 1.1 1.1 1.1 1.2 Current Capitalization in EUR
Quick Ratio 0.8 0.8 0.7 0.8 Common Shares Outstanding (M) 519.7
EBIT/Interest 2.1 2.1 1.1 1.2 Market Capitalization (M) 5260.0
Tot Debt/Capital 0.7 0.7 0.7 0.7 Cash and ST Investments (M) #N/A N/A
Tot Debt/Equity 2.1 2.0 2.1 1.9 Total Debt (M) #N/A N/A
Eff Tax Rate % 21.6 28.0 239.8 52.5 Preferred Equity (M) 0.0
LT Investments in Affiliate Companies (M) 0.0
Investments (M) 0.0
Enterprise Value (M)
Q.M.S Advisors | tel: +41 (0)78 922 08 77 | e-mail: info@qmsadv.com |
2. Company Analysis - Analysts Ratings
Veolia Environnement SA
Target price in EUR
Broker Recommendation
Buy and Sell Recommendations vs Price and Target Price
Price
Brokers' Target Price
18 16
100%
18% 18% 21% 19% 19% 22% 23%
16 14
25% 26% 24% 25% 24%
80% 14 12
22% 18% 12 10
36% 31% 21% 24%
39% 25% 34% 38%
60% 30% 33% 8
10
8 6
40%
6 4
57% 59%
50% 50% 54% 52%
46% 45% 43% 4 2
20% 43% 42% 43%
2 0
Day by Day
Brean Murray
Bryan Garnier &
Morgan Stanley
Barclays
Raymond
S&P Capital IQ
Natixis
Securities(ESN)
Kepler Capital
Partners SA
Credit Suisse
Exane BNP
JPMorgan
Macquarie
BPI
Generale
HSBC
Nomura
DZ Bank AG
Dimensions
AlphaValue
Berenberg Bank
Goldman Sachs
Deutsche Bank
Carret & Co
Societe
James
Hammer
Paribas
Markets
CM - CIC
0% 0
EVA
Cie
mars.12 avr.12 mai.12 juin.12 juil.12 août.12 sept.12 oct.12 nov.12 déc.12 janv.13 févr.13
Buy Hold Sell Price Target Price
Date Buy Hold Sell Date Price Target Price Broker Analyst Recommendation Target Date
28-Feb-13 52% 24% 24% 15-Mar-13 10.08 9.82 Credit Suisse MICHEL DEBS underperform 9.00 13-Mar-13
31-Jan-13 54% 21% 25% 14-Mar-13 10.27 9.82 EVA Dimensions AUSTIN BURKETT hold 12-Mar-13
31-Dec-12 59% 18% 23% 13-Mar-13 10.21 9.82 Goldman Sachs DARIO CARRADORI neutral/neutral 11.30 11-Mar-13
30-Nov-12 57% 22% 22% 12-Mar-13 10.30 9.83 S&P Capital IQ STEWART SCHARF hold 11.00 8-Mar-13
31-Oct-12 43% 33% 24% 11-Mar-13 10.35 9.83 AlphaValue FABRICE FARIGOULE buy 12.30 7-Mar-13
28-Sep-12 43% 30% 26% 8-Mar-13 10.63 9.83 Bryan Garnier & Cie JULIEN DESMARETZ buy 13.00 6-Mar-13
31-Aug-12 42% 38% 19% 7-Mar-13 10.54 9.87 Day by Day VALERIE GASTALDY buy 11.90 5-Mar-13
31-Jul-12 50% 31% 19% 6-Mar-13 10.52 9.87 Societe Generale VINCENT AYRAL buy 9.80 1-Mar-13
29-Jun-12 45% 34% 21% 5-Mar-13 10.42 9.87 Morgan Stanley EMMANUEL TURPIN Equalwt/In-Line 10.00 1-Mar-13
31-May-12 46% 36% 18% 4-Mar-13 10.22 9.84 Raymond James EMMANUEL RETIF outperform 11.10 1-Mar-13
30-Apr-12 50% 25% 25% 1-Mar-13 9.64 9.84 CM - CIC Securities(ESN) OLIVIER BAILS hold 9.50 1-Mar-13
30-Mar-12 43% 39% 18% 28-Feb-13 9.64 9.58 Natixis PHILIPPE OURPATIAN buy 13.50 1-Mar-13
27-Feb-13 9.51 9.58 Exane BNP Paribas OLIVIER VAN DOOSSELAERE underperform 9.00 1-Mar-13
26-Feb-13 9.04 9.58 JPMorgan NATHALIE F CASALI underweight 7.00 22-Feb-13
25-Feb-13 9.25 9.58 Macquarie ATALLAH ESTEPHAN underperform 7.50 22-Feb-13
22-Feb-13 9.15 9.58 BPI LOUIS BOUJARD buy 11.30 11-Feb-13
21-Feb-13 9.03 9.74 Berenberg Bank ANDREW FISHER buy 10.80 5-Feb-13
20-Feb-13 9.37 9.74 Barclays JULIE ARAV overweight 11.00 25-Jan-13
19-Feb-13 9.56 9.74 HSBC VERITY MITCHELL overweight 10.50 18-Jan-13
18-Feb-13 9.47 9.74 Deutsche Bank JAMES BRAND hold 8.00 7-Jan-13
15-Feb-13 9.38 9.74 Nomura MARTIN YOUNG buy 9.90 12-Dec-12
14-Feb-13 9.28 9.74 Hammer Partners SA CHRIS MOORE sell 7.00 24-Apr-12
13-Feb-13 9.72 9.74 DZ Bank AG HASIM SENGUEL buy 13.00 29-Feb-12
12-Feb-13 9.71 9.74 Kepler Capital Markets TEAM COVERAGE not rated 31-Oct-11
11-Feb-13 9.56 9.74 Brean Murray Carret & Co MICHAEL E GAUGLER hold 6-Sep-11
8-Feb-13 9.70 9.64
7-Feb-13 9.61 9.69
6-Feb-13 9.51 9.69
5-Feb-13 9.44 9.69
4-Feb-13 9.31 9.61
Q.M.S Advisors | tel: +41 (0)78 922 08 77 | e-mail: info@qmsadv.com |
3. 15.03.2013
Veolia Environnement SA
Company Analysis - Ownership
Ownership Type
Ownership Statistics Geographic Ownership Distribution Geographic Ownership
0%
Shares Outstanding (M) 519.7 France 69.26%
1% 1% 4%
Float 73.1% Norway 9.11% 3%
Short Interest (M) United States 7.24% 6%
Short Interest as % of Float Luxembourg 5.72%
43%
Days to Cover Shorts Switzerland 3.02% 7%
Institutional Ownership 42.83% Ireland 1.07%
Retail Ownership 57.12% 57% Britain 0.97%
Insider Ownership 0.05% Others 3.61% 9%
69%
Institutional Ownership Distribution
Investment Advisor 34.83%
Government 25.26%
Corporation 17.39%
Institutional Ownership Retail Ownership Insider Ownership Mutual Fund Manager 13.29%
France Norway United States Luxembourg
Pricing data is in EUR Others 9.23% Switzerland Ireland Britain Others
Top 20 Owners: TOP 20 ALL
Institutional Ownership
Holder Name Position Position Change Market Value % of Ownership Report Date Source Country
CAISSE DES DEPOTS ET 47'873'873 0 482'329'270 9.17% 31.12.2011 Co File FRANCE 9%
GROUPE INDUSTRIEL MA 32'888'732 0 331'353'975 6.30% 31.12.2011 Co File FRANCE
GROUPAMA ASSET MANAG 29'366'758 0 295'870'087 5.62% 31.12.2011 Co File FRANCE 36%
VELO INVEST 24'681'519 0 248'666'304 4.73% 31.12.2011 Co File NORWAY 13%
ELECTRICITE DE FRANC 20'577'271 0 207'316'005 3.94% 31.12.2011 Co File FRANCE
VEOLIA ENVIRONNEMENT 14'237'927 0 143'447'115 2.73% 31.12.2011 Co File FRANCE
AMUNDI 13'947'585 -16'312'801 140'521'919 2.67% 31.12.2011 13G FRANCE
VANGUARD GROUP INC 6'531'940 158'722 65'809'296 1.25% 31.12.2012 MF-AGG UNITED STATES
PICTET & CIE 6'461'052 304 65'095'099 1.24% 30.11.2012 MF-AGG SWITZERLAND 17%
25%
NATIXIS ASSET MANAGE 6'190'509 -64'740 62'369'378 1.19% 31.01.2013 MF-AGG FRANCE
PICTET ASSET MANAGEM 5'783'427 -224'399 58'268'027 1.11% 30.11.2012 MF-AGG BRITAIN
MANDARINE GESTION 5'636'031 -643'999 56'783'012 1.08% 28.02.2013 MF-AGG FRANCE
BLACKROCK 5'122'492 120'729 51'609'107 0.98% 13.03.2013 ULT-AGG UNITED STATES
ALLIANZ ASSET MANAGE 4'776'617 155'025 48'124'416 0.91% 28.02.2013 ULT-AGG GERMANY Investment Advisor Government Corporation
Mutual Fund Manager Others
AQR CAPITAL MANAGEME -3'701'595 -965'860 -37'293'570 -0.71% 25.10.2012 Short UNITED STATES
ING INTERNATIONAL AD 3'159'183 -1'040'593 31'828'769 0.61% 31.12.2012 MF-AGG LUXEMBOURG
JULIUS BAER MULTIPAR 3'065'847 92'713 30'888'409 0.59% 29.02.2012 MF-AGG LUXEMBOURG
AVIVA PLC 2'974'900 0 29'972'118 0.57% 28.02.2013 MF-AGG BRITAIN
B & G FUND PLC -2'401'599 678'713 -24'196'110 -0.46% 04.03.2013 Short
MARSHALL WACE LLP -2'140'556 678'713 -21'566'102 -0.41% 04.03.2013 Short BRITAIN
Top 5 Insiders:
Holder Name Position Position Change Market Value % of Ownership Report Date Source
PROGLIO HENRI 248'077 2'499'376 0.05% 31.12.2011 Co File
FREROT ANTOINE 10'793 108'739 0.00% 31.12.2011 Co File
SCHWEITZER LOUIS 5'828 58'717 0.00% 31.12.2011 Co File
MICHEL SERGE 3'094 31'172 0.00% 31.12.2011 Co File
BOUTON DANIEL 3'065 30'880 0.00% 31.12.2011 Co File
Q.M.S Advisors | tel: +41 (0)78 922 08 77 | e-mail: info@qmsadv.com |