Main World Equity Indices Fundamental Value - Based on Analyst Estimates
•
0 j'aime•241 vues

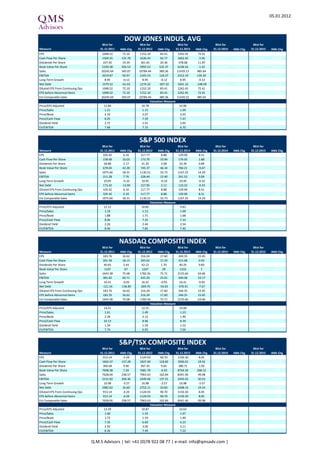
All Analyst Estimates by key financial parameters as of Dec 16th 2010: Index Level Data (Sales, EBITDA, Long Term Growth, Net Debt, Diluted EPS from Continuing Ops) and Per Share Level Data (Earnings, Cash Flows, Dividends, Book Value,..)

Recommandé
Contenu connexe
Tendances
Tendances (17)
Similaire à Main World Equity Indices Fundamental Value - Based on Analyst Estimates
Similaire à Main World Equity Indices Fundamental Value - Based on Analyst Estimates (20)
Plus de BCV
Plus de BCV (20)
Dernier
Dernier (20)
Main World Equity Indices Fundamental Value - Based on Analyst Estimates
- 1. 05.01.2012 DOW JONES INDUS. AVG BEst for BEst for BEst for BEst for BEst for Measure 31.12.2011 4Wk Chg 31.12.2012 4Wk Chg 31.12.2013 4Wk Chg 31.12.2014 4Wk Chg 31.12.2015 4Wk Chg EPS 1048.52 72.10 1152.10 83.41 1242.45 72.41 1048.52 72.10 1048.52 72.10 Cash Flow Per Share 1504.55 131.78 1636.43 92.77 1662.42 -3.95 1504.55 131.78 1504.55 131.78 Dividends Per Share 337.92 19.39 361.65 20.36 378.68 11.87 337.92 19.39 337.92 19.39 Book Value Per Share 5339.38 456.53 5993.53 532.37 6106.56 -1.42 5339.38 456.53 5339.38 456.53 Sales 10245.64 345.07 10784.44 389.36 11439.15 485.64 10245.64 345.07 10245.64 345.07 EBITDA 2019.87 92.97 2165.53 118.37 2312.19 126.20 2019.87 92.97 2019.87 92.97 Long Term Growth 8.95 -0.12 8.95 -0.12 8.95 -0.12 8.95 -0.12 8.95 -0.12 Net Debt 1579.52 -61.02 1274.32 -207.32 1041.16 -148.99 1579.52 -61.02 1579.52 -61.02 Diluted EPS From Continuing Ops 1048.52 72.10 1152.10 83.41 1242.45 72.41 1048.52 72.10 1048.52 72.10 EPS before Abnormal Items 1048.52 72.10 1152.10 83.41 1242.45 72.41 1048.52 72.10 1048.52 72.10 Est Comparable Sales 10245.64 345.07 10784.44 389.36 11439.15 485.64 10245.64 345.07 10245.64 345.07 Valuation Measure Price/EPS Adjusted 11.84 10.78 10.00 11.84 11.84 Price/Sales 1.21 1.15 1.09 1.21 1.21 Price/Book 2.33 2.07 2.03 2.33 2.33 Price/Cash Flow 8.25 7.59 7.47 8.25 8.25 Dividend Yield 2.72 2.91 3.05 2.72 2.72 EV/EBITDA 7.66 7.15 6.70 7.66 7.66 S&P 500 INDEX BEst for BEst for BEst for BEst for BEst for Measure 31.12.2011 4Wk Chg 31.12.2012 4Wk Chg 31.12.2013 4Wk Chg 31.12.2014 4Wk Chg 31.12.2015 4Wk Chg EPS 105.42 6.10 117.77 8.88 129.90 8.51 105.42 6.10 105.42 6.10 Cash Flow Per Share 158.48 10.03 173.70 10.94 179.95 2.88 158.48 10.03 158.48 10.03 Dividends Per Share 28.88 2.17 31.20 2.08 32.39 0.89 28.88 2.17 28.88 2.17 Book Value Per Share 678.04 43.28 745.37 46.34 760.21 -9.67 678.04 43.28 678.04 43.28 Sales 1075.66 18.31 1130.21 33.73 1167.25 14.29 1075.66 18.31 1075.66 18.31 EBITDA 211.28 7.76 228.44 12.40 241.52 9.04 211.28 7.76 211.28 7.76 Long Term Growth 10.95 -0.10 10.95 -0.10 10.95 -0.10 10.95 -0.10 10.95 -0.10 Net Debt 173.42 -13.90 157.95 2.11 110.32 -0.10 173.42 -13.90 173.42 -13.90 Diluted EPS From Continuing Ops 105.42 6.10 117.77 8.88 129.90 8.51 105.42 6.10 105.42 6.10 EPS before Abnormal Items 105.42 6.10 117.77 8.88 129.90 8.51 105.42 6.10 105.42 6.10 Est Comparable Sales 1075.66 18.31 1130.21 33.73 1167.25 14.29 1075.66 18.31 1075.66 18.31 Valuation Measure Price/EPS Adjusted 12.12 10.85 9.83 12.12 12.12 Price/Sales 1.19 1.13 1.09 1.19 1.19 Price/Book 1.88 1.71 1.68 1.88 1.88 Price/Cash Flow 8.06 7.35 7.10 8.06 8.06 Dividend Yield 2.26 2.44 2.54 2.26 2.26 EV/EBITDA 8.46 7.82 7.40 8.46 8.46 NASDAQ COMPOSITE INDEX BEst for BEst for BEst for BEst for BEst for Measure 31.12.2011 4Wk Chg 31.12.2012 4Wk Chg 31.12.2013 4Wk Chg 31.12.2014 4Wk Chg 31.12.2015 4Wk Chg EPS 183.76 16.62 216.24 17.60 244.35 15.45 183.76 16.62 183.76 16.62 Cash Flow Per Share 261.39 18.15 295.62 17.29 315.68 0.93 261.39 18.15 261.39 18.15 Dividends Per Share 40.65 2.44 42.12 1.70 40.25 9.83 40.65 2.44 40.65 2.44 Book Value Per Share 1107 67 1247 59 1333 7 1107 67 1107 67 Sales 1643.38 75.68 1782.56 75.71 2155.66 63.66 1643.38 75.68 1643.38 75.68 EBITDA 381.82 60.71 425.20 23.01 420.06 19.17 381.82 60.71 381.82 60.71 Long Term Growth 16.41 -0.05 16.41 -0.05 16.41 -0.05 16.41 -0.05 16.41 -0.05 Net Debt -121.54 -136.85 -269.70 -54.03 -376.41 -7.67 -121.54 -136.85 -121.54 -136.85 Diluted EPS From Continuing Ops 183.76 16.62 216.24 17.60 244.35 15.45 183.76 16.62 183.76 16.62 EPS before Abnormal Items 183.76 16.62 216.24 17.60 244.35 15.45 183.76 16.62 183.76 16.62 Est Comparable Sales 1643.38 75.68 1782.56 75.71 2155.66 63.66 1643.38 75.68 1643.38 75.68 Valuation Measure Price/EPS Adjusted 14.41 12.25 10.84 14.41 14.41 Price/Sales 1.61 1.49 1.23 1.61 1.61 Price/Book 2.39 2.12 1.99 2.39 2.39 Price/Cash Flow 10.13 8.96 8.39 10.13 10.13 Dividend Yield 1.54 1.59 1.52 1.54 1.54 EV/EBITDA 7.74 6.95 7.04 7.74 7.74 S&P/TSX COMPOSITE INDEX BEst for BEst for BEst for BEst for BEst for Measure 31.12.2011 4Wk Chg 31.12.2012 4Wk Chg 31.12.2013 4Wk Chg 31.12.2014 4Wk Chg 31.12.2015 4Wk Chg EPS 913.14 -4.29 1124.93 90.70 1150.30 8.05 913.14 -4.29 913.14 -4.29 Cash Flow Per Share 1662.47 137.28 1827.40 118.82 1956.01 18.42 1662.47 137.28 1662.47 137.28 Dividends Per Share 360.68 9.90 367.35 9.64 380.71 1.09 360.68 9.90 360.68 9.90 Book Value Per Share 7048.38 7.20 7681.70 -6.93 8764.34 268.12 7048.38 7.20 7048.38 7.20 Sales 7628.04 238.57 7963.63 162.84 8341.46 49.08 7628.04 238.57 7628.04 238.57 EBITDA 2131.02 204.36 2349.46 137.21 2435.43 50.52 2131.02 204.36 2131.02 204.36 Long Term Growth 16.98 -3.57 16.98 -3.57 16.98 -3.57 16.98 -3.57 16.98 -3.57 Net Debt 2982.62 16.60 2752.11 33.83 2408.14 19.54 2982.62 16.60 2982.62 16.60 Diluted EPS From Continuing Ops 913.14 -4.29 1124.93 90.70 1150.30 8.05 913.14 -4.29 913.14 -4.29 EPS before Abnormal Items 913.14 -4.29 1124.93 90.70 1150.30 8.05 913.14 -4.29 913.14 -4.29 Est Comparable Sales 7628.04 238.57 7963.63 162.84 8341.46 49.08 7628.04 238.57 7628.04 238.57 Valuation Measure Price/EPS Adjusted 13.39 10.87 10.63 13.39 13.39 Price/Sales 1.60 1.54 1.47 1.60 1.60 Price/Book 1.73 1.59 1.40 1.73 1.73 Price/Cash Flow 7.35 6.69 6.25 7.35 7.35 Dividend Yield 2.95 3.00 3.11 2.95 2.95 EV/EBITDA 8.26 7.49 7.22 8.26 8.26 Q.M.S Advisors | tel: +41 (0)78 922 08 77 | e-mail: info@qmsadv.com |
- 2. 05.01.2012 Euro Stoxx 50 Pr BEst for BEst for BEst for BEst for BEst for Measure 31.12.2011 4Wk Chg 31.12.2012 4Wk Chg 31.12.2013 4Wk Chg 31.12.2014 4Wk Chg 31.12.2015 4Wk Chg EPS 268.33 14.74 293.87 22.69 312.94 16.17 268.33 14.74 268.33 14.74 Cash Flow Per Share 535.63 18.30 567.56 30.67 584.91 17.18 535.63 18.30 535.63 18.30 Dividends Per Share 128.00 4.94 137.93 5.73 149.70 9.24 128.00 4.94 128.00 4.94 Book Value Per Share 2346.11 79.61 2489.26 93.46 2475.85 -70.06 2346.11 79.61 2346.11 79.61 Sales 3608.13 71.11 3744.62 156.79 3809.05 84.56 3608.13 71.11 3608.13 71.11 EBITDA 658.03 27.79 699.00 39.13 727.00 25.93 658.03 27.79 658.03 27.79 Long Term Growth 4.89 -0.86 4.89 -0.86 4.89 -0.86 4.89 -0.86 4.89 -0.86 Net Debt 787.07 -48.77 723.43 -42.12 642.41 -68.81 787.07 -48.77 787.07 -48.77 Diluted EPS From Continuing Ops 268.33 14.74 293.87 22.69 312.94 16.17 268.33 14.74 268.33 14.74 EPS before Abnormal Items 268.33 14.74 293.87 22.69 312.94 16.17 268.33 14.74 268.33 14.74 Est Comparable Sales 3608.13 71.11 3744.62 156.79 3809.05 84.56 3608.13 71.11 3608.13 71.11 Valuation Measure Price/EPS Adjusted 8.64 7.89 7.41 8.64 8.64 Price/Sales 0.64 0.62 0.61 0.64 0.64 Price/Book 0.99 0.93 0.94 0.99 0.99 Price/Cash Flow 4.33 4.08 3.96 4.33 4.33 Dividend Yield 5.52 5.95 6.46 5.52 5.52 EV/EBITDA 11.67 10.99 10.56 11.67 11.67 STXE 600 € Pr BEst for BEst for BEst for BEst for BEst for Measure 31.12.2011 4Wk Chg 31.12.2012 4Wk Chg 31.12.2013 4Wk Chg 31.12.2014 4Wk Chg 31.12.2015 4Wk Chg EPS 25.00 2.20 27.82 2.67 30.09 2.23 25.00 2.20 25.00 2.20 Cash Flow Per Share 42.22 3.02 45.44 3.16 47.11 1.83 42.22 3.02 42.22 3.02 Dividends Per Share 11.07 0.75 12.07 0.87 13.04 0.86 11.07 0.75 11.07 0.75 Book Value Per Share 193.82 11.55 208.60 13.52 217.84 6.02 193.82 11.55 193.82 11.55 Sales 304.68 13.88 317.75 18.05 321.76 9.39 304.68 13.88 304.68 13.88 EBITDA 54.97 3.30 59.09 3.81 61.49 2.80 54.97 3.30 54.97 3.30 Long Term Growth 7.81 -0.19 7.81 -0.19 7.81 -0.19 7.81 -0.19 7.81 -0.19 Net Debt 56.14 -3.84 49.28 -4.65 46.27 -3.77 56.14 -3.84 56.14 -3.84 Diluted EPS From Continuing Ops 25.00 2.20 27.82 2.67 30.09 2.23 25.00 2.20 25.00 2.20 EPS before Abnormal Items 25.00 2.20 27.82 2.67 30.09 2.23 25.00 2.20 25.00 2.20 Est Comparable Sales 304.68 13.88 317.75 18.05 321.76 9.39 304.68 13.88 304.68 13.88 Valuation Measure Price/EPS Adjusted 9.89 8.89 8.22 9.89 9.89 Price/Sales 0.81 0.78 0.77 0.81 0.81 Price/Book 1.28 1.19 1.14 1.28 1.28 Price/Cash Flow 5.86 5.44 5.25 5.86 5.86 Dividend Yield 4.48 4.88 5.27 4.48 4.48 EV/EBITDA 10.51 9.78 9.40 10.51 10.51 SWISS MARKET INDEX BEst for BEst for BEst for BEst for BEst for Measure 31.12.2011 4Wk Chg 31.12.2012 4Wk Chg 31.12.2013 4Wk Chg 31.12.2014 4Wk Chg 31.12.2015 4Wk Chg EPS 517.12 53.56 566.67 48.60 610.16 42.26 517.12 53.56 517.12 53.56 Cash Flow Per Share 627.56 70.50 698.32 70.98 728.69 31.32 627.56 70.50 627.56 70.50 Dividends Per Share 242.89 19.80 268.48 26.80 285.80 18.62 242.89 19.80 242.89 19.80 Book Value Per Share 3282 246 3553 283 3848 307 3282 246 3282 246 Sales 3695.72 172.77 3873.49 204.35 4120.04 259.02 3695.72 172.77 3695.72 172.77 EBITDA 827.37 75.77 883.62 61.99 942.88 65.11 827.37 75.77 827.37 75.77 Long Term Growth 7.92 0.02 7.92 0.02 7.92 0.02 7.92 0.02 7.92 0.02 Net Debt 576.98 7.07 419.27 8.32 251.35 10.41 576.98 7.07 576.98 7.07 Diluted EPS From Continuing Ops 517.12 53.56 566.67 48.60 610.16 42.26 517.12 53.56 517.12 53.56 EPS before Abnormal Items 517.12 53.56 566.67 48.60 610.16 42.26 517.12 53.56 517.12 53.56 Est Comparable Sales 3695.72 172.77 3873.49 204.35 4120.04 259.02 3695.72 172.77 3695.72 172.77 Valuation Measure Price/EPS Adjusted 11.65 10.63 9.87 11.65 11.65 Price/Sales 1.63 1.55 1.46 1.63 1.63 Price/Book 1.84 1.69 1.56 1.84 1.84 Price/Cash Flow 9.60 8.62 8.26 9.60 9.60 Dividend Yield 4.03 4.46 4.75 4.03 4.03 EV/EBITDA 11.77 11.02 10.33 11.77 11.77 DAX INDEX BEst for BEst for BEst for BEst for BEst for Measure 31.12.2011 4Wk Chg 31.12.2012 4Wk Chg 31.12.2013 4Wk Chg 31.12.2014 4Wk Chg 31.12.2015 4Wk Chg EPS 645.55 45.98 718.24 58.44 753.63 24.15 645.55 45.98 645.55 45.98 Cash Flow Per Share 1155.72 45.86 1233.93 67.24 1332.65 97.85 1155.72 45.86 1155.72 45.86 Dividends Per Share 255.50 11.45 275.21 16.45 286.74 7.45 255.50 11.45 255.50 11.45 Book Value Per Share 5357.97 305.96 5745.97 334.32 5936.96 97.33 5357.97 305.96 5357.97 305.96 Sales 10945.30 231.33 11403.48 505.15 11648.40 317.99 10945.30 231.33 10945.30 231.33 EBITDA 1584.62 97.96 1689.83 106.57 1789.35 102.63 1584.62 97.96 1584.62 97.96 Long Term Growth 9.50 -0.06 9.50 -0.06 9.50 -0.06 9.50 -0.06 9.50 -0.06 Net Debt 1299.98 -190.44 1119.08 -96.55 759.18 -312.30 1299.98 -190.44 1299.98 -190.44 Diluted EPS From Continuing Ops 645.55 45.98 718.24 58.44 753.63 24.15 645.55 45.98 645.55 45.98 EPS before Abnormal Items 645.55 45.98 718.24 58.44 753.63 24.15 645.55 45.98 645.55 45.98 Est Comparable Sales 10945.30 231.33 11403.48 505.15 11648.40 317.99 10945.30 231.33 10945.30 231.33 Valuation Measure Price/EPS Adjusted 9.36 8.41 8.02 9.36 9.36 Price/Sales 0.55 0.53 0.52 0.55 0.55 Price/Book 1.13 1.05 1.02 1.13 1.13 Price/Cash Flow 5.23 4.90 4.53 5.23 5.23 Dividend Yield 4.23 4.55 4.75 4.23 4.23 EV/EBITDA 8.20 7.69 7.26 8.20 8.20 Q.M.S Advisors | tel: +41 (0)78 922 08 77 | e-mail: info@qmsadv.com |
- 3. 05.01.2012 CAC 40 INDEX BEst for BEst for BEst for BEst for BEst for Measure 31.12.2011 4Wk Chg 31.12.2012 4Wk Chg 31.12.2013 4Wk Chg 31.12.2014 4Wk Chg 31.12.2015 4Wk Chg EPS 355.86 11.90 392.30 33.17 433.44 37.60 355.86 11.90 355.86 11.90 Cash Flow Per Share 662.92 10.47 699.94 22.87 723.15 7.98 662.92 10.47 662.92 10.47 Dividends Per Share 161.53 8.75 174.04 10.36 198.40 21.96 161.53 8.75 161.53 8.75 Book Value Per Share 3272.30 162.11 3472.65 175.88 3218.76 -284.71 3272.30 162.11 3272.30 162.11 Sales 5240.51 53.15 5435.68 158.49 5489.59 12.70 5240.51 53.15 5240.51 53.15 EBITDA 873.07 6.65 928.25 41.71 951.62 8.77 873.07 6.65 873.07 6.65 Long Term Growth 7.25 0.02 7.25 0.02 7.25 0.02 7.25 0.02 7.25 0.02 Net Debt 1005.67 -74.65 918.47 -97.60 846.13 -78.95 1005.67 -74.65 1005.67 -74.65 Diluted EPS From Continuing Ops 355.86 11.90 392.30 33.17 433.44 37.60 355.86 11.90 355.86 11.90 EPS before Abnormal Items 355.86 11.90 392.30 33.17 433.44 37.60 355.86 11.90 355.86 11.90 Est Comparable Sales 5240.51 53.15 5435.68 158.49 5489.59 12.70 5240.51 53.15 5240.51 53.15 Valuation Measure Price/EPS Adjusted 8.85 8.03 7.27 8.85 8.85 Price/Sales 0.60 0.58 0.57 0.60 0.60 Price/Book 0.96 0.91 0.98 0.96 0.96 Price/Cash Flow 4.75 4.50 4.36 4.75 4.75 Dividend Yield 5.13 5.52 6.30 5.13 5.13 EV/EBITDA 14.31 13.46 13.12 14.31 14.31 FTSE MIB INDEX BEst for BEst for BEst for BEst for BEst for Measure 31.12.2011 4Wk Chg 31.12.2012 4Wk Chg 31.12.2013 4Wk Chg 31.12.2014 4Wk Chg 31.12.2015 4Wk Chg EPS 1822.79 333.14 2111.48 204.96 2468.86 253.62 1822.79 333.14 1822.79 333.14 Cash Flow Per Share 5342.78 367.55 5807.13 389.21 5500.44 -230.25 5342.78 367.55 5342.78 367.55 Dividends Per Share 836.81 62.67 942.76 63.77 1025.96 22.70 836.81 62.67 836.81 62.67 Book Value Per Share 23101.18 -1860.20 24355.26 -1600.78 26024.41 -1419.04 23101.18 -1860.20 23101.18 -1860.20 Sales 36036.71 5350.31 37956.65 5687.18 38978.75 5060.52 36036.71 5350.31 36036.71 5350.31 EBITDA 6590.68 659.37 7183.39 562.55 7496.76 277.38 6590.68 659.37 6590.68 659.37 Long Term Growth 7.80 -2.18 7.80 -2.18 7.80 -2.18 7.80 -2.18 7.80 -2.18 Net Debt 10496.14 -22.03 9800.18 -562.81 9636.52 -81.28 10496.14 -22.03 10496.14 -22.03 Diluted EPS From Continuing Ops 1822.79 333.14 2111.48 204.96 2468.86 253.62 1822.79 333.14 1822.79 333.14 EPS before Abnormal Items 1822.79 333.14 2111.48 204.96 2468.86 253.62 1822.79 333.14 1822.79 333.14 Est Comparable Sales 36036.71 5350.31 37956.65 5687.18 38978.75 5060.52 36036.71 5350.31 36036.71 5350.31 Valuation Measure Price/EPS Adjusted 8.13 7.02 6.00 8.13 8.13 Price/Sales 0.41 0.39 0.38 0.41 0.41 Price/Book 0.64 0.61 0.57 0.64 0.64 Price/Cash Flow 2.77 2.55 2.69 2.77 2.77 Dividend Yield 5.65 6.36 6.92 5.65 5.65 EV/EBITDA 11.31 10.37 9.94 11.31 11.31 IBEX 35 INDEX BEst for BEst for BEst for BEst for BEst for Measure 31.12.2011 4Wk Chg 31.12.2012 4Wk Chg 31.12.2013 4Wk Chg 31.12.2014 4Wk Chg 31.12.2015 4Wk Chg EPS 926.60 54.54 1032.95 102.17 1087.21 48.85 926.60 54.54 926.60 54.54 Cash Flow Per Share 2330.43 90.53 2499.07 163.33 2529.52 31.56 2330.43 90.53 2330.43 90.53 Dividends Per Share 583.00 -34.37 628.58 -15.21 645.99 -6.60 583.00 -34.37 583.00 -34.37 Book Value Per Share 8192 256 8603 385 8813 203 8192 256 8192 256 Sales 10795.99 616.02 11184.11 419.06 11290.05 122.55 10795.99 616.02 10795.99 616.02 EBITDA 2588.14 148.53 2739.02 100.06 2827.83 35.47 2588.14 148.53 2588.14 148.53 Long Term Growth - -0.22 - -0.22 - -0.22 - -0.22 - -0.22 Net Debt 7167.63 -338.23 6983.66 -401.80 6625.94 -583.34 7167.63 -338.23 7167.63 -338.23 Diluted EPS From Continuing Ops 926.60 54.54 1032.95 102.17 1087.21 48.85 926.60 54.54 926.60 54.54 EPS before Abnormal Items 926.60 54.54 1032.95 102.17 1087.21 48.85 926.60 54.54 926.60 54.54 Est Comparable Sales 10795.99 616.02 11184.11 419.06 11290.05 122.55 10795.99 616.02 10795.99 616.02 Valuation Measure Price/EPS Adjusted 9.06 8.12 7.72 9.06 9.06 Price/Sales 0.78 0.75 0.74 0.78 0.78 Price/Book 1.02 0.98 0.95 1.02 1.02 Price/Cash Flow 3.60 3.36 3.32 3.60 3.60 Dividend Yield 6.95 7.49 7.70 6.95 6.95 EV/EBITDA 11.62 10.98 10.63 11.62 11.62 AEX-Index BEst for BEst for BEst for BEst for BEst for Measure 31.12.2011 4Wk Chg 31.12.2012 4Wk Chg 31.12.2013 4Wk Chg 31.12.2014 4Wk Chg 31.12.2015 4Wk Chg EPS 34.14 1.52 37.96 3.98 39.59 1.79 34.14 1.52 34.14 1.52 Cash Flow Per Share 54.91 5.20 60.33 5.61 62.91 2.64 54.91 5.20 54.91 5.20 Dividends Per Share 14.22 2.11 15.76 1.49 16.38 0.60 14.22 2.11 14.22 2.11 Book Value Per Share 281.75 19.91 303.82 24.09 331.60 30.28 281.75 19.91 281.75 19.91 Sales 511.72 2.66 530.75 20.43 505.80 -20.84 511.72 2.66 511.72 2.66 EBITDA 71.42 1.88 77.59 5.71 80.67 2.48 71.42 1.88 71.42 1.88 Long Term Growth - 0.00 - 0.00 - 0.00 - 0.00 - 0.00 Net Debt 102.45 -2.26 93.48 -3.94 84.41 -5.07 102.45 -2.26 102.45 -2.26 Diluted EPS From Continuing Ops 34.14 1.52 37.96 3.98 39.59 1.79 34.14 1.52 34.14 1.52 EPS before Abnormal Items 34.14 1.52 37.96 3.98 39.59 1.79 34.14 1.52 34.14 1.52 Est Comparable Sales 511.72 2.66 530.75 20.43 505.80 -20.84 511.72 2.66 511.72 2.66 Valuation Measure Price/EPS Adjusted 9.13 8.21 7.87 9.13 9.13 Price/Sales 0.61 0.59 0.62 0.61 0.61 Price/Book 1.11 1.03 0.94 1.11 1.11 Price/Cash Flow 5.67 5.16 4.95 5.67 5.67 Dividend Yield 4.56 5.06 5.26 4.56 4.56 EV/EBITDA 9.97 9.17 8.82 9.97 9.97 Q.M.S Advisors | tel: +41 (0)78 922 08 77 | e-mail: info@qmsadv.com |
- 4. 05.01.2012 NIKKEI 225 BEst for BEst for BEst for BEst for BEst for Measure 31.12.2011 4Wk Chg 31.12.2012 4Wk Chg 31.12.2013 4Wk Chg 31.12.2014 4Wk Chg 31.12.2015 4Wk Chg EPS 527.55 -10.50 669.32 11.69 808.76 9.12 527.55 -10.50 527.55 -10.50 Cash Flow Per Share 1350.17 -6.50 1503.43 -2.66 1605.54 -1.49 1350.17 -6.50 1350.17 -6.50 Dividends Per Share 191.56 -1.30 194.51 1.11 220.08 -4.44 191.56 -1.30 191.56 -1.30 Book Value Per Share 8017.75 22.70 8527.26 24.50 9202.19 103.36 8017.75 22.70 8017.75 22.70 Sales 17307.40 53.29 17911.61 4.59 18650.63 131.51 17307.40 53.29 17307.40 53.29 EBITDA 1861.32 4.29 2037.95 5.03 2196.29 15.40 1861.32 4.29 1861.32 4.29 Long Term Growth 12.42 0.33 12.42 0.33 12.42 0.33 12.42 0.33 12.42 0.33 Net Debt 2770.98 237.98 2435.36 227.13 2005.06 206.24 2770.98 237.98 2770.98 237.98 Diluted EPS From Continuing Ops 527.55 -10.50 669.32 11.69 808.76 9.12 527.55 -10.50 527.55 -10.50 EPS before Abnormal Items 527.55 -10.50 669.32 11.69 808.76 9.12 527.55 -10.50 527.55 -10.50 Est Comparable Sales 17307.40 53.29 17911.61 4.59 18650.63 131.51 17307.40 53.29 17307.40 53.29 Valuation Measure Price/EPS Adjusted 16.09 12.68 10.50 16.09 16.09 Price/Sales 0.49 0.47 0.46 0.49 0.49 Price/Book 1.06 1.00 0.92 1.06 1.06 Price/Cash Flow 6.29 5.65 5.29 6.29 6.29 Dividend Yield 2.26 2.29 2.59 2.26 2.26 EV/EBITDA 7.20 6.58 6.10 7.20 7.20 TOPIX INDEX (TOKYO) BEst for BEst for BEst for BEst for BEst for Measure 31.12.2011 4Wk Chg 31.12.2012 4Wk Chg 31.12.2013 4Wk Chg 31.12.2014 4Wk Chg 31.12.2015 4Wk Chg EPS 48.55 -0.52 60.76 0.89 77.69 0.55 48.55 -0.52 48.55 -0.52 Cash Flow Per Share 141.70 -1.01 157.86 -0.19 171.07 0.25 141.70 -1.01 141.70 -1.01 Dividends Per Share 18.56 -0.02 18.71 0.11 21.38 -0.06 18.56 -0.02 18.56 -0.02 Book Value Per Share 841.42 1.96 889.28 2.33 950.39 5.41 841.42 1.96 841.42 1.96 Sales 1905.08 2.40 1968.80 2.79 1948.62 5.48 1905.08 2.40 1905.08 2.40 EBITDA 183.05 0.27 200.77 -0.37 217.70 1.14 183.05 0.27 183.05 0.27 Long Term Growth 4.35 -14.54 4.35 -14.54 4.35 -14.54 4.35 -14.54 4.35 -14.54 Net Debt 427.43 15.85 402.78 14.31 377.69 5.64 427.43 15.85 427.43 15.85 Diluted EPS From Continuing Ops 48.55 -0.52 60.76 0.89 77.69 0.55 48.55 -0.52 48.55 -0.52 EPS before Abnormal Items 48.55 -0.52 60.76 0.89 77.69 0.55 48.55 -0.52 48.55 -0.52 Est Comparable Sales 1905.08 2.40 1968.80 2.79 1948.62 5.48 1905.08 2.40 1905.08 2.40 Valuation Measure Price/EPS Adjusted 15.16 12.12 9.48 15.16 15.16 Price/Sales 0.39 0.37 0.38 0.39 0.39 Price/Book 0.88 0.83 0.77 0.88 0.88 Price/Cash Flow 5.20 4.66 4.30 5.20 5.20 Dividend Yield 2.52 2.54 2.90 2.52 2.52 EV/EBITDA 10.60 9.67 8.91 10.60 10.60 HANG SENG INDEX BEst for BEst for BEst for BEst for BEst for Measure 31.12.2011 4Wk Chg 31.12.2012 4Wk Chg 31.12.2013 4Wk Chg 31.12.2014 4Wk Chg 31.12.2015 4Wk Chg EPS 1988.74 155.88 2232.63 232.05 2540.72 299.32 1988.74 155.88 1988.74 155.88 Cash Flow Per Share 3060.60 348.18 3397.99 321.21 3433.04 48.30 3060.60 348.18 3060.60 348.18 Dividends Per Share 788.85 53.83 874.56 84.46 1056.67 184.79 788.85 53.83 788.85 53.83 Book Value Per Share 15466 1170 16845 1303 18453 1485 15466 1170 15466 1170 Sales 11518.10 929.97 12695.79 1200.20 14413.53 1663.41 11518.10 929.97 11518.10 929.97 EBITDA 3430.88 245.92 3733.87 296.43 4363.44 625.37 3430.88 245.92 3430.88 245.92 Long Term Growth 10.92 0.64 10.92 0.64 10.92 0.64 10.92 0.64 10.92 0.64 Net Debt 765.04 115.44 728.93 476.45 626.16 404.82 765.04 115.44 765.04 115.44 Diluted EPS From Continuing Ops 1988.74 155.88 2232.63 232.05 2540.72 299.32 1988.74 155.88 1988.74 155.88 EPS before Abnormal Items 1988.74 155.88 2232.63 232.05 2540.72 299.32 1988.74 155.88 1988.74 155.88 Est Comparable Sales 11518.10 929.97 12695.79 1200.20 14413.53 1663.41 11518.10 929.97 11518.10 929.97 Valuation Measure Price/EPS Adjusted 9.46 8.43 7.40 9.46 9.46 Price/Sales 1.63 1.48 1.31 1.63 1.63 Price/Book 1.22 1.12 1.02 1.22 1.22 Price/Cash Flow 6.15 5.54 5.48 6.15 6.15 Dividend Yield 4.19 4.65 5.62 4.19 4.19 EV/EBITDA 5.40 4.96 4.25 5.40 5.40 S&P/ASX 200 INDEX BEst for BEst for BEst for BEst for BEst for Measure 31.12.2011 4Wk Chg 31.12.2012 4Wk Chg 31.12.2013 4Wk Chg 31.12.2014 4Wk Chg 31.12.2015 4Wk Chg EPS 367.52 5.98 408.84 5.87 440.95 3.42 367.52 5.98 367.52 5.98 Cash Flow Per Share 499.13 7.36 548.90 3.73 596.97 3.88 499.13 7.36 499.13 7.36 Dividends Per Share 218.42 -0.56 235.32 2.97 251.37 0.86 218.42 -0.56 218.42 -0.56 Book Value Per Share 2653.90 12.50 2848.69 18.34 3062.74 25.16 2653.90 12.50 2653.90 12.50 Sales 2890.01 15.52 3084.51 11.96 3283.90 17.94 2890.01 15.52 2890.01 15.52 EBITDA 739.07 12.11 818.33 9.59 873.27 0.90 739.07 12.11 739.07 12.11 Long Term Growth 12.27 -0.01 12.27 -0.01 12.27 -0.01 12.27 -0.01 12.27 -0.01 Net Debt 13245.97 30.93 14322.22 28.77 1679.43 -38.57 13245.97 30.93 13245.97 30.93 Diluted EPS From Continuing Ops 367.52 5.98 408.84 5.87 440.95 3.42 367.52 5.98 367.52 5.98 EPS before Abnormal Items 367.52 5.98 408.84 5.87 440.95 3.42 367.52 5.98 367.52 5.98 Est Comparable Sales 2890.01 15.52 3084.51 11.96 3283.90 17.94 2890.01 15.52 2890.01 15.52 Valuation Measure Price/EPS Adjusted 11.27 10.13 9.39 11.27 11.27 Price/Sales 1.43 1.34 1.26 1.43 1.43 Price/Book 1.56 1.45 1.35 1.56 1.56 Price/Cash Flow 8.30 7.55 6.94 8.30 8.30 Dividend Yield 5.27 5.68 6.07 5.27 5.27 EV/EBITDA 10.46 9.45 8.85 10.46 10.46 Q.M.S Advisors | tel: +41 (0)78 922 08 77 | e-mail: info@qmsadv.com |