SlideShare une entreprise Scribd logo
1  sur  10
Télécharger pour lire hors ligne
Anal. Chem. 1998, 70, 4929-4938


Electrospray Ionization High-Resolution Ion
Mobility Spectrometry-Mass Spectrometry
Ching Wu, William F. Siems, G. Reid Asbury, and Herbert H. Hill, Jr.*

Department of Chemistry, Washington State University, Pullman, Washington 99164-4630


A hybrid atmospheric pressure ion mobility spectrometer                            Later, Dole and co-workers reported work with polystyrene,
is described which exhibits resolving power approaching                            speculating that the broad peaks were due to excess solvent ions,
the diffusion limit for singly and multiply charged ions                           which were adsorbed to the surface of the macroion aggregates.3
(over 200 for the most favorable case). Using an elec-                             Finally, they concluded that because of the difficulty in evaporating
trospray ionization source and a downstream quadrupole                             the solvent from the electrosprayed ions under atmospheric
mass spectrometer with electron multiplier as detector,                            conditions, electrospray ionization would be useful only for mass
this ESI-IMS-MS instrument demonstrates the potential                              spectrometry in which the solvent could be efficiently eliminated
of IMS for rapid analytical separations with a resolving                           under vacuum conditions.4 Smith and co-workers also found that
power similar to liquid chromatography. The first mea-                             it was difficult to separate electrosprayed proteins by IMS due to
surements of gas-phase mobility spectra of mass-identified                         inefficient desolvation of the electrosprayed droplets.5 Their data
multiply charged ions migrating at atmospheric pressure                            resembled that of Dole’s earlier work. Unlike Dole’s arrangement,
are reported. These spectra confirm that collision cross                           in which the gas flow was in the same direction as ion migration,
sections are strongly affected by charge state. Baseline                           we have reported the need for a counterflow of heated, dry
separations of multiply charged states of cytochrome c and                         nitrogen drift gas to efficiently evaporate the solvent from
ubiquitin demonstrate the improved resolving power of
                                                                                   electrosprayed droplets.6 This counterflow design produced stable
this instrument compared with previous atmospheric
                                                                                   and completely desolvated electrosprayed ions, exhibiting reduced
pressure ion mobility spectrometers. The effects of
                                                                                   mobility constants that were reproducible with respect to tem-
electric potential, initial pulse duration, ion-molecule
                                                                                   perature, flow, and solvent type.7 Application of electrospray
reactions, ion desolvation, Coulombic repulsion, electric
                                                                                   ionization-ion mobility spectrometry (ESI-IMS) was demonstrated
field homogeneity, ion collection, and charge on the
                                                                                   as a detection method for liquid chromatography,8 capillary
resolving power of this ion mobility spectrometer are
                                                                                   electrophoresis,9 and liquid process streams.10
discussed.
                                                                                       The difficulty with this initial counterflow ESI-IMS design was
                                                                                   that the heated drift gas raised the temperature of the electrospray
    For more than twenty-five years, ion mobility spectrometry
(IMS) has been used as a method for trace organic analysis,                        sufficiently to volatilize the solvent before it could exit the needle
finding important application in the vapor-phase detection of                      and generate the spray. Thus, to increase sensitivity and stabil-
explosives, drugs, and chemical warfare agents.1 While the                         ity,11 corona spray was often preferred over true electrospray
primary targets of IMS analysis have been volatile organic                         conditions. To address this prespray solvent evaporation problem
compounds using radioactive ionization, recent developments in                     we developed a water-cooled electrospray ionization source that
electrospray ionization have enabled the analysis of nonvolatile
                                                                                    (3) Dole, M.; Gupta, C. V.; Mack, L. L.; Nakamae, K. Polym. Prepr. (Am. Chem.
organics from liquid-phase samples.
                                                                                        Soc., Div. Polym. Chem.) 1977, 18 (2), 188-193.
    Electrospray as an ionization source for ion mobility spectrom-                 (4) Gieniec, J.; Mack, L. L.; Nakamae, K.; Gupta, C.; Kumar, V.; Dole, M. Biomed.
etry was first demonstrated by Dole and co-workers in 19722 by                          Mass Spectrom, 1984, 11 (6), 259.
                                                                                    (5) Smith, R. D.; Loo, J. A.; Ogorzalek, R. R.; Busman, M. Mass Spectrom. Rev.
electrospraying lysozyme into an ion mobility spectrometer to
                                                                                        1991, 10, 359-451.
produce three broad peaks. In Dole’s instrument, the nitrogen                       (6) Shumate, C. B.; Hill, H. H., Jr. Northwest Regional ACS Meeting, Bellingham,
drift gas was introduced into the spectrometer at the “rear of the                      WA, June 1987.
                                                                                    (7) Shumate, C. B. An Electrospray Nebulization/Ionization Interface for Liquid
spray tube” in order to help sweep ions downstream. As the drift
                                                                                        Introduction into an Ion Mobility Spectrometer Ph.D. Thesis, Washington
gas flow was increased, more efficient evaporation of the solvent                       State University, 1989.
was observed and the lysozyme ions drifted faster. However, ion                     (8) McMinn, D. G.; Kinzer, J. A.; Shumate, C. B.; Siems, W. F.; Hill, H. H., Jr.
                                                                                        J. Microcolumn Sep. 1990, 2, 188-192.
peaks resulting from these experiments were very broad and did
                                                                                    (9) Hallen, R. W.; Shumate, C. B.; Siems, W. F.; Tsuda, T.; Hill, H. H., Jr.; J.
not demonstrate the presence of multiple charges on the lysozyme.                       Chromatogr. 1989, 480, 233-245.
                                                                                   (10) Shumate, C. B.; Hill, H. H., Jr. Electrospray Ion Mobility SpectrometrysIts
  * Corresponding author: (tel) (509) 335-5648; (e-mail) hhhill@wsu.edu.                Potential as a Liquid-Stream Process Sensor. In Pollution Prevention in
(1) Eiceman, G. A.; Karpas, Z. Ion Mobility Spectrometry; CRC Press: Boca Raton,        Industrial ProcessessThe Role of Process Analytical Chemistry; Breen, J. J.,
    FL, 1994.                                                                           Dellarco, M. J., Eds.; ACS Symposium Series 508; American Chemical
(2) Gieniec, M. L.; Cox, J., Jr.; Teer, D.; Dole, M. 20th Annual Conference on          Society: Washington, DC, 1992.
    Mass Spectrometry and Allied Topics, Dallas, TX, June 4-9, 1972.               (11) Shumate, C. B.; Hill, H. H., Jr. Anal. Chem. 1989, 61, 601-606.

10.1021/ac980414z CCC: $15.00       © 1998 American Chemical Society                  Analytical Chemistry, Vol. 70, No. 23, December 1, 1998 4929
Published on Web 10/24/1998
could be interfaced directly to high-temperature IMS.12 The                                                            D ) kTK/ez                               (2)
advantages of this cooled electrospray source included rapid
desolvation of sprayed droplets, prevention of solute precipitation
                                                                                            and developed an expression for measured pulse width in cases
in the spray needle, efficient transmission of ion spray into the
                                                                                            where Coulombic repulsion and ion-molecule reactions are
IMS, and elimination of corona ionization.13 In addition, both
                                                                                            unimportant and where the initial ion pulse has a Gaussian shape
signal/noise (S/N) ratio and resolving power were improved for
                                                                                            of duration tg at half-maximum
ESI-IMS by using the Fourier transform mode of operation.14 With
the cooled electrospray source, IMS proved to be a sensitive and
practical detection method for liquid chromatography with detec-
                                                                                                               w2 ) tg2 +   (16kT ln 2)t
                                                                                                                                Vez        d
                                                                                                                                            2
                                                                                                                                                                (3)
tion limits as low as 1 × 10-15 mol s-1 and a linear response range
of 3-4 orders of magnitude.15
    While the development of electrospray ionization expanded the                           where k is Boltzman’s constant, T is the temperature of the drift
domain of IMS into polar and nonvolatile compounds, the low                                 gas in kelvin, V is the potential across the drift length, e is the
resolving power of ion mobility spectrometry has continued to                               elementary charge, and z is the number of charges on the ion. In
limit the analytical potential of IMS as a separation device.                               the limit, as td becomes very large compared to tg, the diffusion-
Resolving power has been investigated throughout the history of                             limited resolving power is obtained from eq 3


                                                                                                           ( ) (                   )                ( )
analytical IMS,16-26 with definitions of resolving power based on                                           tg                      1/2                   1/2
                                                                                                                       Vez                          Vez
mass separation,17 separation of pairs of peaks,18 or a single-peak-                          Rd ≡ lim R       f0 )                       ) 0.300               (4)
                                                                                                            td      16kT ln 2                       kT
based quotient.19 The now generally accepted single-peak-based
measurement of IMS resolving power is
                                                                                            For typical IMS devices and conditions (10 cm drift tube with a
                                     R ) td/w                                       (1)
                                                                                            300 V cm-1 electric field, 125 °C temperature), Rd is on the order
                                                                                            of 100 for singly charged ions, but this limit has been elusive.
where td is the ion drift time and w is the ion pulse duration at                               Spangler and Collins17 obtained good qualitative agreement to
the detector measured at half of the maximal intensity. The first                           experimental IMS peak shapes by convoluting a step function
atmospheric pressure ion mobility spectrum, reported in 1970 for                            representing initial pulse shape with a Gaussian function repre-
dimethyl sulfoxide, showed a resolving power of 30 20 by this                               senting diffusion. These authors also estimated that mutual
definition. Since that time, all commercial atmospheric pressure                            repulsion has a small but measurable effect on pulse width, with
ion mobility spectrometers have had similar resolving power,                                this Coulombic broadening increasing as the initial pulse width
despite theoretical predictions of higher values.                                           increases. It should be noted that this result assumed the ∼1 ×
    Revercomb and Mason16 described four phenomena affecting                                10-9 A total ion current typical of β- emitter ion sources. Despite
ion pulse characteristics measured at the detector: (1) the initial                         a good qualitative picture of peak shape, Spangler and Collins
ion pulse width and shape introduced into the drift region, (2)                             needed to introduce a “Townsend energy factor”, η ) 2.7, as a
broadening by mutual Coulomb repulsion between the ions, (3)                                multiplier for the kT in the numerator of eq 3 in order to match
broadening by diffusion as the ion pulse drifts down the electric                           experimental peak widths. Although this factor was rationalized
field, and (4) ion-molecule reactions with the drift gas or with                            as accounting for higher effective temperature of ions which are
impurities. They used the Einstein relation between the diffusion                           continually receiving energy from the electric field, the Townsend
coefficient, D (in cm2 s-1), and the mobility, K (in cm2 V-1 s-1)                           energy factor is known to be close to 1 for ions under atmospheric
                                                                                            pressure IMS conditions.24
(12) Wittmer, D.; Chen, Y. H.; Luckenbill, B. K.; Hill, H. H., Jr. Anal. Chem.                  Siems et al.24 have fit experimental pulse width data for singly
     1994, 66, 2348-2355.
(13) Chen, Y. H.; Hill, H. H., Jr.; Wittmer, D. P. Intl. J. Mass Spectrosc. Ion Processes
                                                                                            charged ions in a number of IMS instruments to a semiempirical
     1996, 154, 1-13.                                                                       model based on eq 3
(14) Chen, Y. H.; Siems, W. F.; Hill, H. H., Jr. Anal. Chim. Acta 1996, 334,
     75-84.                                                                                                   w2 ) γ + βtg2 + R(Ttd2/V)                         (5)
(15) Chen, Y. H.; Hill, H. H., Jr.; Wittmer, D. P.; J. Microcolumn Sep. 1994, 6,
     515-524.
(16) Revercomb, H. E.; Mason, E. A. Anal. Chem. 1975, 47, 970-983.
(17) Spangler, G. E.; Collins, C. I. Anal. Chem. 1975, 47, 403-407.                         and compared best-fit R, β, and γ parameters to the theoretical
(18) Karasek, F. W.; Kim, S. H. Final Report, Contract 8SU77-00227; University              predictions γ ) 0 s2, β ) 1, and R ) 9.57 × 10⁻⁴ V/K (this R
     of Waterloo Research Institute, Waterloo, Ontario, Canada, 1980.
(19) Rokushika, S.; Hatano, H.; Baim, M. A.; Hill, H. H. Anal. Chem. 1985, 57,              should be divided by z1/2 for multiply charged ions). All three
     1902-1907.                                                                             parameters were found to be greater than the theoretical predic-
(20) Cohen, M. J.; Karasek, F. W. J. Chromatogr. Sci. 1970, 8, 330-337.                     tions for each of the instruments studied. That R values were
(21) Mason, E. A. Ion Mobility: Its Role in Plasma Chromatography. In Plasma
     Chromatography; Carr, T. W., Ed.; Plenum Press: New York, 1984.                        generally in the range (1.2-1.5) × 10-3 V/K, which was attributed
(22) Brokenshire, J. L. FACSS Meeting, Anaheim, CA, October 1991.                           mainly to electric field inhomogeneity, while β values of 1.1-1.3
(23) Eiceman, G. A.; Karpas, Z. Ion Mobility Spectrometry; CRC Press: Boca Raton,           were attributed to Coulomb repulsion, and γ values of (0.5-2) ×
     FL, 1994; pp 99-100.
(24) Siems, W. F.; Wu, C.; Tarver, E. E.; Hill, H. H.; Larsen, P. R.; McMinn, D.            10-8 s2 were attributed to collector and amplifier rise time.
     G. Anal. Chem. 1994, 66, 4195-4201.                                                        According to eqs 3 and 4, the primary ways to increase
(25) Leonhardt, J. W.; Rohrbeck, W.; Bensch, H. Fourth International IMS                    resolving power are to (1) raise the total voltage across the drift
     Workshop, Cambridge, U.K., 1995.
(26) Dugourd, Ph.; Hudgins, R. R.; Clemmer, D. E.; Jarrold, M. F. Rev. Sci.                 space, (2) decrease the initial pulse width, (3) lower the temper-
     Instrum. 1997, 68, 1122-1129.                                                          ature of the drift gas, and (4) increase the number of charges on
4930 Analytical Chemistry, Vol. 70, No. 23, December 1, 1998
the ions. To these primary factors we may add secondary factors                    maximum. They suggested that Coulombic repulsion was the
suggested by eq 5s(5) increase the homogeneity of the electric                     primary reason for low resolution in IMS but were unable to
field experienced by the ions, (6) decrease Coulombic repulsion                    demonstrate this effect experimentally.
within the ion pulse, and (7) shorten the rise time of ion collection                  We report here the construction and evaluation of an atmo-
and amplification. Finally we must recognize that higher resolving                 spheric pressure ion mobility spectrometer with an electrospray
power will be achieved if we (8) study ions of high charge and/                    ionization source and a quadrupole mass spectrometer to identify
or low mobility (long td means resolving power close to the                        and detect those ions after mobility separation. Our experimental
diffusion limit of eq 4), and (9) eliminate or mask the effects of                 conditions give some a priori expectations about resolving power
labile clusters and ion-molecule reactions in the drift tube.                      for this instrument. The relatively long drift times and multiple
    Several investigators have increased IMS resolving power by                    charges of ESI generated ions should tend to give relatively
lengthening the drift tube along with increasing its voltage.22-26                 narrow peaks and larger R values. On the other hand, our high
There are several reasons why increasing R by increasing voltage                   operating temperature, dictated by the need to desolvate ions,
also requires making the tube longer. First, increasing V without                  tends to lower R. In addition, we must watch for greater Coulomb
increasing L also raises electric field strength, E ) V/L, eventually              broadening with the high total ion currents of ESI compared to
resulting in electrical breakdown. Second, it has generally been                   β- sources.
deemed important to operate in the low-field regime in which the
ion velocity remains proportional to E. This requires that IMS                     EXPERIMENTAL SECTION
experiments be performed with an E/N ratio no more than (1-                            Instrumentation. The electrospray ionization ion mobility/
2) × 10-17 V cm2 ,21 where N is the number density of the drift                    mass spectrometer instrument used in this study was constructed
gas (in cm-3). Thus, for atmospheric pressure conditions, where                    at Washington State University. A scale drawing of the instrument
N ) 2.46 × 1019cm-3 (25 °C and 1 atm), the typical E values have                   is shown in Figure 1. The water-cooled electrospray source was
been between 246 and 493 V/cm. Third, and with even more                           developed here several years ago.12 In this ESI source, a water-
serious consequences for resolving power, increasing V without                     cooled jacket surrounds the spray needle assembly and water-
lengthening the drift tube also increases the relative contribution                cooled nitrogen flows along the axis of and in contact with the
of tg to w, since td decreases linearly with V. This means that, for               spray needle. The nitrogen exits the spray assembly concentric
a drift tube of given length, for each choice of tg there is an                    with the needle and contributes to nebulization of the electro-
optimum drift voltage, Vopt, that maximizes R17,24                                 sprayed mist. The objective of cooling the spray needle and spray
                                                                                   thoroughly is to prevent the heated drift gas from causing solvent

                              (      RTL2
                                                     )                             evaporation inside the needle. A detailed drawing of this elec-
                                                      1/3
                     Vopt )                                                (6)     trospray ionization source can be found on page 2350 in Figure 3
                                2(γ + βtg2)1/2K2
                                                                                   of ref 12.
                                                                                       The electrospray is drawn by electric potential toward and
                                                                                   through a 16-mesh stainless steel focus screen into the desolvation
although for singly charged ions it is usually necessary to operate
                                                                                   region of the spectrometer, where the charged mist migrates in
above Vopt to maintain signal strength.
                                                                                   an electric field through a counterflow of heated nitrogen drift
    Brokenshire constructed a 44-cm-long drift tube with a 10-cm
                                                                                   gas. During the few milliseconds of migration through the
diameter and reported a 5-10-fold increase in resolving power
                                                                                   desolvation region, solvent evaporates from the droplets, leaving
over traditional IMS instruments.22 In Brokenshire’s design, the
                                                                                   solvent and analyte ions. The temperature of the desolvation
aperture grid and the collector plate had a large diameter so that
                                                                                   region can be controlled independently from the drift region by
radial diffusion of ions did not decrease signal intensity.23 We
                                                                                   the introduction of a separately heated diluent drift gas at the
reported an IMS design in which the resolving power was
                                                                                   interface between the desolvation region and the ion drift region.
improved over commercial instruments using a drift length of 15.6
                                                                                   The temperature of the diluent drift gas can be selected to either
cm and a drift voltage of 7000 V.24 Leowhardt et al. have reported
                                                                                   cool or heat the drift gas as it passes into the desolvation region.
the use of drift fields up to 700 V/cm to reach R values as high
                                                                                   In the experiments reported here, however, no diluent gas was
as 120 for singly charged species.25 Dugrourd et al. recently
                                                                                   added and the temperature in the desolvation region was the same
reported a low-pressure high-resolution IMS instrument where
                                                                                   as that in the drift region.
they place a potential of 14 000 V across a 63-cm drift tube at 500
                                                                                       Two ion gates are located at the entrance and exit of the drift
Torr to produce a resolving power of 172.26
                                                                                   region of the spectrometer. These identical Bradbury-Nielsen-
    Watts and Widers27 evaluated several ion mobility instruments
                                                                                   type gates are constructed using parallel Alloy 46 (California Fine
with respect to resolving power. They calculated that the
                                                                                   Wire Co., Grover Beach, CA) wires 76 µm in diameter with a 0.64-
maximum resolving power (Rm) for the advanced vapor monitor
                                                                                   mm spacing. The gates are “closed” by applying (37.5 V to
(AVM) instrument (Graseby Dynamics, Ltd., Watford, Herts,
                                                                                   adjacent wires so that a ∼1000 V/cm closing field is placed
WD25JX, U.K.) was 50. For the PCP instrument (PCP, 2155
                                                                                   orthogonal to the drift field of the spectrometer. As positive ions
Indian Road, West Palm Beach, FL), they calculated a range of
                                                                                   approach the gate, they are collected on the negative wires of
maximum resolution from 50 to over 100 and a laboratory-
                                                                                   the gate, preventing them from passing through the gate. When
constructed high-resolution tube (HRT) that was 44 cm in length
                                                                                   the gates are “open”, all gate wires are pulsed to a single voltage
had a theoretical maximum R between 125 and 275. Unfortu-
                                                                                   appropriate to the gate’s position in the drift electric field.
nately, none of these instruments performed near their theoretical
                                                                                       Both the desolvation and drift regions are constructed of
(27) Watts, P.; Wilders, A. Int. J. Mass Spectrom. Ion Processes 1992, 112, 179.   electrically conducting stainless steel and electrically insulating
                                                                                     Analytical Chemistry, Vol. 70, No. 23, December 1, 1998     4931
Figure 1. Instrument schematic of high-resolution ion mobility spectrometer with electrospray ionization and mass identification.


alumina rings stacked in an alternating and interlocking design.         apparatus and allows us to vary the electrical potential on the
Each repeating unit of the tube, consisting of one conducting and        pinhole. The pinhole leak is attached to the carrier by six 4/40
one insulating ring, is 0.9 cm in length. The conducting rings           screws and a gold seal. The leak was fabricated by machining a
are 0.8 cm wide, and the insulating rings 0.1 cm wide. The               central hole almost through a piece of 304 stainless steel, leaving
conducting rings are connected to one another via a series of            a metal membrane 250 µm in thickness through which a 40-µm-
1-MΩ resistors. The dimensions of the rings are machined to be           diameter hole was drilled with a laser. The pinhole exhibited a
4.9-cm i.d. and 5.7-cm o.d. The desolvation region is 7.2 cm in          leak flow rate of 28 cm3/s at 15 psi. This flow rate brings us close
length, and the drift region is 13 cm in length.                         to the maximum pumping capacity of our diffusion pumps. The
     A crucial portion of our apparatus is the interface between the     vacuum chamber for the mass spectrometer was constructed at
ion mobility spectrometer and the mass spectrometer. It includes         WSU and consisted of two chambers for differential pumping. Two
(1) the extraction region, (2) the extraction plate, (3) the buffer      Diffstak 160/700 diffusion pumps (Edwards High Vacuum Inc.,
gas region, (4) the pinhole leak and the (5) adiabatic expansion         3279, Grand Island Blvd. Grand Island, NY) were mounted close
region. The extraction region is the space between the ion exit          to the upper chamber in order to achieve the maximum pumping
gate and the pinhole through which the ions continue to migrate          capacity. Two ion gauges (Granville-Phillips, model 274006,
at atmospheric pressure (in an electrical field slightly higher than     Boulder, CO) were installed on the internal and external chamber
the drift field). The extraction plate is the tapering terminal ring     for pressure measurements.
of the mobility spectrometer beyond which only ions from the                 The mass spectrometer was a C50-Q (ABB Extrel, 575 Epsilion,
central 1.4 cm of the ion disk are permitted to continue toward          Pittsburgh, PA) consisting of an API lens system designed by
the pinhole leak. The buffer gas region is the space between the         Extrel, a quadrupole mass filter with 0.95-cm-diameter rods 20
extraction plate and the pinhole leak through which the drift gas        cm in length, and an electron multiplier (model 051-72) and
is introduced. One intention of this arrangement is to disrupt           preamplifier equipped with current amplification and ion-counting
the diffusion layer around the pinhole leak and to keep the leak         capability. The maximum m/z for our rods and power supply was
clean and free from clogging. The 40-µm-diameter pinhole serves          800. For these studies, the stock preamplifier was replaced with
as the barrier between the atmospheric pressure of the drift tube        a Keithley 427 amplifier (Keithley Instruments, Cleveland, OH)
and the vacuum of the mass spectrometer, while allowing a narrow         and the amplified signal sent to the data acquisition system, which
ion beam to enter. Beyond the pinhole is the adiabatic expansion         was constructed at WSU. A detailed description of the IMS control
region where excess drift gas is pumped away and a sufficient            and data acquisition system can be found in ref 12.
electric field is maintained on the ions to prevent clustering or            General Operating Conditions. The electrospray ionization
fragmentation. From the adiabatic expansion region, the ions are         source was normally operated with a potential difference of 4000
first drawn into a space bounded by a cylindrical screen and then        V between the needle tip and the focus screen. The focus screen
focused through an einzel lens system into a quadrupole mass             served to define the initial potential of the ion mobility desolvation
filter.                                                                  region and drift tube. The potential on the screen was normally
     As shown on Figure 1, a metal carrier for the pinhole leak of       5500 V while the potential on the spray needle was 9500 V.
the interface is mounted on a 16-cm-o.d. flange using a custom           Samples were normally introduced into the spray needle with a
design metal-glass seal (fabricated from two standard metal-             solvent system composed of 47.5% water, 47.5% methanol, and 5%
glass seals by Larson Electronic Glass, Redwood City, CA). This          acetic acid. The solvent flow through the needle was controlled
metal-glass seal serves as an expansion joint for the varying            at 5 µL/min. The cooling water and gas flows were 55 and 630
temperature gradient between the drift tube and the rest of the          mL/min, respectively, and were held at 19 and 25 °C, respectively.
4932 Analytical Chemistry, Vol. 70, No. 23, December 1, 1998
Table 1. Operating Conditions

drift gas flow rate                         800 mL/min (N2)
sample flow rate                            5 µL/min
                                            (CH3OH:H2O:CH3-
                                               COOH ) 47.5:47.5:5)
electrospray potential                      9500 V
focus screen potential                      5500 V
desolvation field                           280 V/cm
drift field                                 280 V/cm
reference potential for ion entrance gate   3625 V
entrance gate closure potential             (37 V
reference potential for ion exit gate       628 V
exit gate closure potential                 (28 V
extraction plate potential                  251 V
pinhole leak potential                      7.9 V
ion optics potentials                       7.9, -4.9, -20.1, -7.4,
                                               -99.9, -23.2 V
internal chamber pressure                   1.5 × 10⁻⁵ Torr
external chamber pressure                   2.2 × 10⁻⁴ Torr
                                                                         Figure 2. Drift time as a function of inverse drift voltage. Drift time
                                                                         was measured on ion mobility spectra of doubly and triply charged
                                                                         bradykinin ions created by electrospray ionization.

    The electric field was maintained at 280 V/cm throughout the
desolvation region and the ion drift region. A counterflow of
heated, dry nitrogen drift gas was introduced between the
extraction plate and the pinhole leak. This drift gas was preheated
and introduced at a flow rate of 800 mL/min. In these experi-
ments, no diluent gas for the desolvation region was introduced.
The drift gas was normally heated to 250 °C and the drift tube
pressure was at ∼700 Torr measured for each individual experi-
ment.
    The ion optics of the MS system consisted of six elements
with potentials of +7.9 (pinhole), -4.9 (screen), -20.1 (first
element of einzel), -7.4 (second element of einzel), -99.9 (third
element of einzel), and -23.2 (ELFS plate) V in order of the ion
migration direction. The 1.2-MHz quadrupole mass filter was
biased at -5.2 V. The electron multiplier was operated at potential
of 1.75 kV, and the collision dynode at -4 kV.
    These and other operating conditions are summarized in Table
1. Unless specified otherwise, the conditions listed in this table
were used for all experiments described in this paper.
    Test Compounds. Peptides and proteins (Sigma, St. Louis,
MO) were used in this study without further purification and were
dissolved in electrospray solvents with concentrations in the 10-5
to 10-4 M range. The solvent methanol, water, and acetic acid
were HPLC grade reagents (J. T. Baker, Phillipsburg, NJ).
Morphine standard in methanol (Supelco Inc., Bellefonte, PA) was
diluted with mobile phase as needed.

RESULTS AND DISCUSSION                                                   Figure 3. Ion mobility spectrum of dynorphin a fragment 1-7 with
    Figure 2 shows the relation between drift time and 1/V for           mass-identified ions.
doubly and triply charged positive ions of bradykinin, with drift
voltages in the range 2307-3625 V. The solid lines are linear            defined mobilities when they traveled through the drift region,
least-squares fits to the experimental data. In these plots, the slope   confirming that the desolvation process was complete before the
of the line is the ratio of the drift length squared to the ion          ions exited the desolvation region.
mobility, and the intercept measures the time an ion spends                 Figure 3 shows data typical of the ESI-IMS-MS instrument
traveling from the pinhole at the end of the drift region to the         constructed for this project. The three spectra in this figure were
particle multiplier. For both doubly and triply charged ions, the        produced from electrospray ionization of the peptide dynorphin
intercept is close to zero, indicating that the time for ions to drift   A 1-7 (MW ) 867). The lower tracing is an ion mobility
through the adiabatic expansion region and mass analyzer is              spectrum of all ions produced in the electrospray process with a
negligible compared to drift time under our operating conditions.        molecular mass larger than 250 Da. This spectrum was obtained
A similar result was reported in previous IMS-MS experiments.1           by pulsing the entrance gate open for 0.2 ms at a frequency of 20
In addition, the linearity of the plots indicates both ions had well-    Hz, holding the exit gate of the ion mobility spectrometer open
                                                                           Analytical Chemistry, Vol. 70, No. 23, December 1, 1998        4933
Table 2. Drift Time and Peak Width Data for Dynorphin                  with drift times of 20.5 and 21.2 ms shown in the lower trace of
A Using tg ) 0.2 ms                                                    Figure 3. The smaller of these two peaks was found to have m/z
                                                                       ) 443, 8 Da greater than the m/z 435 measured for the larger (M
  ion charge       td (ms)       w (ms)        R        Rd (calc)
                                                                       + 2H)2+ peak. The mass identifications confirm that these really
      +1             37.5          0.66        57           85         are two different species, with mobilities differing by ∼3%, that
      +2             20.5          0.29        71          120
      +3             17.3          0.22        78          147         have been near baseline resolved by this IMS instrument, a
                                                                       condition we have never been able to achieve before with similar
                                                                       drift tubes. Incidentally, from the separation of these two peaks
                                                                       it might be reasoned that the mass dispersion of the IMS is 0.6
continuously, and using the mass spectrometer as a high-pass filter    ms/8 Da ) 0.08 ms/Da. The corresponding width in daltons for
so that only ions with a mass greater than 250 Da would be             the peak at 20.5 ms would be (20.5 ms)/(57 × 0.08 ms/Da) )
detected by the electron multiplier. Under these conditions, ions      4.5 Da, and the resolving power from the 20.5-ms peak calculated
with an m/z greater than 800 can be detected, even though the          on a mass basis would be 435/4.5 ) 97. The fact that this “mass”
mass identification range of the quadrupole used in these experi-      resolving power and the mobility resolving power do not agree is
ments was limited to 800 Da.                                           another reminder that mass and mobility cannot be directly
    The peak at 37.5 ms is thought to be the singly protonated         compared. Because ion mobility separations are based on the
peptide (M + H)+ with m/z ) 868, although this ion could not           size and shape of ions, rather than mass (mass is important only
be mass identified due to the 800-Da limit of our quadrupole. Mass     in that it changes the size of the ion), it is clearly absurd to
identification of the doubly and triply charged ion species,           measure the resolving power of an ion mobility spectrometer in
however, was possible. The middle tracing in Figure 3 was              terms of mass.
obtained by setting the mass spectrometer to pass m/z ) 290,               The identities assigned to these two ions were (M + 2H)2+
while the ion mobility spectrometer operated in the same manner        for the peak at 20.5 ms as discussed above and (M + O + 2H)2+
used for the lower tracing. The single peak with a drift time of       for the peak at 21.2 ms. The assignment of an oxygen adduct to
17.3 ms matches the peak of highest mobility in the nonselective       an electrosprayed ion is reasonable and has been noted previ-
spectrum shown in the lower tracing and is believed to be the          ously.28 One explanation for the presence of (M + O + nH)n+
triply protonated peptide (M + 3H)3+ with m/z ) (867 + 3)/3 )          ions when proteins or peptides are electrosprayed into mass
290. Similarly, the upper tracing in Figure 3 was obtained by          spectrometers is that a corona discharge is present at the
setting the mass spectrometer to pass m/z ) 435. The single            electrospray emitter tip. Alternatively, species may be oxidized
peak at 20.5 ms corresponds to the most intense peak in the lower      in solution by electrolysis in the electrospray needle. Through
trace and is identified as a doubly protonated peptide (M + 2H)2+      variation of solvent flow and emitter tip potential, it may be possible
with m/z ) (867 + 2)/2 ) 434.5. This is the first time multiply        to eliminate the formation of this adduct and/or to elucidate its
charged ions have been mass identified for atmospheric pressure        formation mechanism.
ion mobility spectrometry.                                                 To systematically examine the resolving power of the ESI-
    Drift time and peak width data for the +1, +2, and +3 peptide      IMS-MS system, a number of interrelated factors must be
ions of Figure 3 are summarized in Table 2. If all three peptides      considered: initial pulse width, electric field homogeneity, ion
had the same collision cross section, then the ratio of drift times    detection, Coulombic repulsion, ion statistics, ion-molecule
for the +1/+2, +1/+3, and +2/+3 species would be 2, 3, and             reactions, ion desolvation and temperature, analyte concentration,
1.5, respectively. That the measured ratios are 1.8, 2.1, and 1.2,     and ionic charge.
respectively, indicates that the collision cross section increases         Initial Pulse Width. Other than diffusion, the single most
as protons are added to the peptide, with a particularly striking      important contributor to IMS peak width is the initial width of
increase as a third proton is added to the (M + 2H)2+ species.         the pulse. It is also the least interesting, as we know from the
Perhaps this is due to a strong repulsion of charges located on        beginning how we must handle it: for highest possible R, use
the two terminal arginine residues.                                    the lowest possible tg that produces a sufficiently strong signal.
    The measured resolving power of the ion mobility spectrom-         Decreases of S/N with decreasing pulse width were observed.
eter for the three peptide ions (see Table 2) is quite striking and    When initial pulse widths less than 0.05 ms were used, the signal
entirely typical of what we observe with this apparatus. Generally     became too weak to detect. This cutoff probably occurs because
speaking, this device shows resolving power of ∼2× or better,          0.05 ms is about the time required for an ion to pass completely
compared to what we have come to expect for IMS instruments            through the region where the gate closure field significantly
of similar dimensions and operating conditions. For comparison,        perturbs the drift field.
Table 2 shows Rd, the diffusion-limited maximum resolving power,           To understand the improved resolving power of the present
predicted from eq 4 for these three peptide ions. As we discuss        ESI-IMS-MS, we want to remove the effects of the initial pulse
further below, for very narrow initial pulse widths we have            width and consider the remaining “impulse response” of the IMS
frequently measured R values greater than Rd. We do not take           to an infinitely narrow initial ion pulse. Data to accomplish this
this to mean that we have defeated diffusion, but rather to indicate   are summarized in Table 3. It contains four studies of peak width
that the actual resolving power of this device is close enough to      for the (MH)+ ion for two different concentrations of histidine (1
the theoretical limit that the noise statistics of our measurements    and 0.1 mg/mL), measured by either nonselective monitoring
yield results above the maximum with fairly high frequency.
    A practical consequence of increased resolving power is the        (28) Morand, K.; Talbo, G.; Mann, M. Rapid Comm. Mass Spectrom. 1993, 7,
ability to separate closely spaced peaks, such as the two peaks             738.

4934 Analytical Chemistry, Vol. 70, No. 23, December 1, 1998
Table 3. Histidine (M + H)+ Peak Width Measured by Selected Ion Monitoring (SIM) and Nonselective Monitoring
(NS) as a Function of Applied Pulse Width

      C                               tg            td                                                                       wd
   (mg/mL)            mode           (ms)          (ms)           w ( σ (ms)             R(σ            (w2 - tg2)1/2       (ms)            β
        1.0            NS            0.05          13.65         0.193 ( 0.037          71 ( 14             0.19            0.20           1.18
                                     0.10          13.63         0.242 ( 0.006          56 ( 1              0.22
                                     0.20          13.61         0.304 ( 0.011          45 ( 2              0.23
                                     0.40          13.71         0.479 ( 0.022          29 ( 1              0.26
        1.0            SIM           0.05          13.67         0.188 ( 0.026          73 ( 11             0.18            0.16           1.49
                                     0.10          13.62         0.217 ( 0.026          63 ( 8              0.19
                                     0.20          13.61         0.276 ( 0.008          49 ( 1              0.19
                                     0.40          13.64         0.516 ( 0.027          26 ( 1              0.33
        0.1            NS            0.05          13.76         0.151 ( 0.012          91 ( 7              0.14            0.14           1.37
                                     0.10          13.74         0.184 ( 0.019          75 ( 7              0.16
                                     0.20          13.70         0.274 ( 0.014          50 ( 3              0.19
                                     0.40          13.74         0.489 ( 0.013          28 ( 1              0.28
        0.1            SIM           0.05           a            a                      a                   a               0.11           1.39
                                     0.10          13.77         0.144 ( 0.013          96 ( 9              0.10
                                     0.20          13.69         0.271 ( 0.017          50 ( 3              0.18
                                     0.40          13.79         0.483 ( 0.056          29 ( 3              0.27
  a   Signal too weak to measure.


(m/z >150, NS) or selective monitoring of the molecular ion (m/z            essentially ideal diffusion-limited behavior from this IMS device
) 156, SIM). For each of four tg values, quadruplicate measure-             when the effects of initial pulse width and Coulombic repulsion
ments of w yielded an average width and standard deviation.                 are removed. In terms of the analysis of eq 4 and ref 24 for this
Although it is tempting to use eq 2 and subtract the effect of the          IMS essentially γ ) 0 s2 and R)1.0 × 10⁻³ V/K. If ref 24 was
initial width from the measured width to get a “diffusion-only”             correct in concluding that the R values of the real IMS devices
width, (w2 - tg2)1/2, this approach fails since (w2 - tg2)1/2 varies        studied were 20-50% higher than ideal because of electric field
with tg (see Table 3).                                                      inhomogeneity, we must conclude that the ESI-IMS-MS of this
    One reason for the dependence of (w2 - tg2)1/2 on tg is that            study has a nearly perfectly homogeneous electric field. Similarly
the initial pulse is not Gaussian in shape and its width depends            if γ values greater than zero can be accounted for by slow collector
on ion distribution across a closed gate. Although, of course, the          and amplifier rise times in the devices studied in ref 24 then the
electronic timing of the signal applied to the gate is known, the           present device must be faster in its response.
temporal profile of the ion pulse admitted to the drift tube is greatly         Electric Field Homogeneity. Past attempts to the create
influenced by the details of the interaction between the ion stream         homogeneous drift fields have included increasing the diameter
and the physical components of the gate. The ion stream is                  of the drift tube, increasing the number of drift rings per unit
depleted of ions immediately upstream of the gate due to the                distance, and coating the inside of the tube with a resistive paint,
action of the closure field (the “gate depletion” effect), and this         creating a continuous voltage gradient. None of these approaches
disruption extends about as far upstream in the drift tube as the           have resulted in high-resolution ion mobility spectrometry. In the
separation distance of the gate wires. A similar effect of closing          present ESI-IMS-MS device, it seems clear that the ions con-
the gate reduces ion density in the trailing edges of ion pulses            tributing to the observed spectra experience not necessarily an
admitted to the drift tube. The actual magnitude and spatial profile        electric field of superior homogeneity but what is just as good for
of this depletion will be different for ions of different mobility.         maintaining narrow peaks: they experience nearly the same
Another contributor to our uncertainty about peak shape is                  electric field. Only those ions which pass through the 40-µm-
Coulombic repulsion, which broadens the initial pulse to an extent          pinhole contribute to the signal, and if the trajectories of these
that increases with ion density, mobility, and applied initial pulse        ions are traced backward to their points of origin in the plane of
width.                                                                      the gate, we would find that ∼67% of them come from an ∼1.5-
    Because of these effects, we cannot know the true initial pulse         mm-diameter circle at the center of the gate. This follows because
width, and the best approach is to plot w2 vs tg2 for several values        an initially infinitely thin disk of ions that spends 13.7 ms drifting
of tg.24 Extrapolation of the nearly linear plot to tg2 ) 0 yields the      through a 13-cm drift tube, diffusing to become a plug with
diffusion-only width, wd, as the square root of the y intercept. This       temporal width of 0.16 ms at half-maximum, has a spatial thickness
extrapolation eliminates not only the pulse width but also the              of 0.16 ms(13 cm/13.7 ms) ) 0.15 cm. Since the ions have nearly
effects of mutual Coulombic repulsion. In fact, the slope of the            the same transverse diffusion coefficient as longitudinal, the
plot (the β of eq 5) is a measure of broadening due to Coulombic            origins of the ions passing through the 0.040-mm pinhole, of
repulsion. This linear regression was performed for each of the             negligible size compared to the 1.5-mm diffusion width, would
sets of data in Table 3. The wd and β values are given in the               be described as a Gaussian distribution of width 1.5 mm at half-
table.                                                                      maximum in the plane of the gate. Having a small plug of ions
    The values of wd given in Table 3 should be compared with               that travels through a narrow corridor in the most homogeneous
the diffusion-limited peak width of 0.16 ms calculated from eq 4            central part of the electric field to reach the pinhole and contribute
for an ion of drift time 13.75 ms. We appear to be seeing                   to our signal should be contrasted to ordinary circumstances in
                                                                                 Analytical Chemistry, Vol. 70, No. 23, December 1, 1998     4935
spectrometer. This change may be the source of improvement
                                                                                     in γ.
                                                                                         Coulombic Repulsion. The average β () 1.36) for the four
                                                                                     sets of experiments summarized in Table 3 is somewhat higher
                                                                                     than the 1.1-1.3 range from ref 24. This may be the result of
                                                                                     increased Coulombic broadening due to the higher ion currents
                                                                                     of our ESI source compared to the 63Ni sources of the reference.
                                                                                     It is then somewhat surprising that the 1.0 mg/mL experiments
                                                                                     have an average β ) 1.34, nearly the same as the β ) 1.38 of the
                                                                                     lower concentration 0.1 mg/mL experiments. This lack of
                                                                                     dependence of β on analyte concentration suggests that the
                                                                                     additional broadening might be the result of higher concentration
                                                                                     of solvent-derived ions, in which case the broadening would have
Figure 4. Simion plot of ion drift tube-mass spectrometer interface.                 to occur during the first few milliseconds after a pulse is admitted
Potential contour interval is 25 V. The distance between last electrode              to the drift tube, before the solvent and analyte ions become
to pinhole inlet was 3 mm.                                                           separated. This situation could be clarified by a more exhaustive
                                                                                     study with a wider range of concentrations.
                                                                                         Ion Statistics and Anomalously High Resolution. Table 3
which an ion pulse nearly as wide as the drift tube is gathered on
                                                                                     contains two R values higher than Rd, and the wd values for the
a collector of similar width. This is probably the main source of
                                                                                     0.1 mg/mL samples are both below the 0.16-ms diffusion limit.
improvement in our resolution compared to ordinary IMS.
                                                                                     While these results are statistically not exceedingly unlikely, and
    Ion Detection. People have used a direct pinhole interface
                                                                                     we certainly do not wish to challenge eq 2, we still have
between IMS and MS for years without noting resolving power
                                                                                     encountered anomalously high R values often enough with the
as high as ours,29 and one wonders at the reason for this. It is
                                                                                     ESI-IMS-MS apparatus, especially with low analyte concentration
certainly not a result of our electrospray ion source. It may be
                                                                                     and/or low initial pulse widths, to spend some time trying to think
that the electronics of earlier systems have simply been too slow
                                                                                     of ways that falsely narrow peak widths could be obtained. The
to observe improved resolution. It may also be that highly
                                                                                     only possibility that has not been discarded as untenable is
attractive potentials used to increase the number of ions drawn
                                                                                     statistically inadequate sampling of the single ion pulses which
through the pinhole have distorted and broadened the ion pulse.
                                                                                     comprise our signal.
Our design keeps the equipotentials fairly flat right up to the
                                                                                         A typical weak IMS pulse might consist of 104 ions ((10-pA
pinhole, as may be seen in Figure 4.
                                                                                     peak current × 0.2-ms peak width)/1.6 × 10-19 C ion-1), while it
    On the related matter of our apparatus having a γ close to 0,
                                                                                     seems unlikely that the 40-µm pinhole has an ion-transfer ef-
this is certainly not the result of amplifier characteristics since
                                                                                     ficiency greater than 10-5 (pinhole area/ion beam area = (4 ×
the ESI-IMS-MS uses the same type of amplifier (with a 0.1-ms
                                                                                     10-3cm)2/(1.25 cm)2). Then the most intense IMS peaks (say
10-90% rise time) that has been used for all our applications in
                                                                                     106 ions) will transfer ∼10 ions into the mass spectrometer, while
recent years. However, our design does eliminate the aperture
                                                                                     the weakest peaks might produce one ion or less in 10 trials. Each
grid. Traditionally, IMS detection has been accomplished with a
                                                                                     ion striking the multiplier of the mass spectrometer produces a
Faraday plate shielded by an open wire structure called an
                                                                                     current spike containing ∼106 electrons and lasting a few tens of
aperture grid located 0.5-1 mm ahead of the plate. Without the
                                                                                     nanoseconds, and the amplifier with its 0.1-ms 10-90% rise time
aperture grid, an ion pulse approaching the collector plate induces
                                                                                     at 109V/A gain converts this spike into a ∼0.1 V pulse ∼0.2 ms
a current well before the pulse actually reaches the plate,
                                                                                     wide. To measure peak widths correctly we must average enough
broadening peaks significantly. The aperture grid shields the
                                                                                     of these single-ion pulses to adequately represent the ion spatial
collector electrode from the incoming ion packet. To minimize
                                                                                     distribution in the IMS tube. It may be that for some weak signals
pulse broadening, the distance between the aperture grid and
                                                                                     we have used ion samples that are too small or rejected as “noisy”
collector should be as small as possible while the field between
                                                                                     some of the outliers in our data and thereby underestimated the
the two is as large as possible without distorting the drift field.
                                                                                     widths of these small peaks.
Unfortunately, the shorter the distance between the grid and the
                                                                                         Ion-Molecule Reactions. The diffusion-limited peak widths
collector or the larger the potential difference between the grid
                                                                                     in Table 3 are slightly narrower for the SIM data than for the
and the collector, the more sensitive is the collector to vibrational
                                                                                     corresponding nonselective data. Although one of our purposes
variations in the grid-collector distance. These variations lead
                                                                                     in using a countercurrent flow of drift gas is to reduce penetration
to increased baseline noise in the detector. Thus, a compromise
                                                                                     of the drift region by neutral molecules of sample and solvent,
of conditions between those that produce acceptable baseline noise
                                                                                     the wider peaks for the nonselective cases may be the result of
and those that produce acceptable pulse broadening is required,
                                                                                     ion-molecule reactions in the drift space. A neutral molecule, I,
and in the optimum case, the inductive response of the collector
                                                                                     can react reversibly with an analyte M+ to form an adduct or
probably begins ∼0.1 ms ahead of the arrival of the ion packet.
                                                                                     capture charge
In the present design, the need for an aperture grid is eliminated
since the ions are detected by the electron multiplier of the mass                           M+ + I S MI+ and/or M+ + I S M + I+                     (6)
(29) Karpas, Z.; Stimac, R. M.; Rappoport, Z. Int. J. Mass Spectrom. Ion Processes
     1988, 83, 163.                                                                  If a peak composed mainly of M+ also contains ions such as I+
4936 Analytical Chemistry, Vol. 70, No. 23, December 1, 1998
Figure 6. Measured ion mobility resolution of amphetamine,
                                                                         cocaine, and morphine under different sample concentration with
Figure 5. Ion mobility spectra of electrospray solvent under different
                                                                         mass selective detection: electrospray solvent, 49.5% water, 49.5%
temperatures: A, 100, B, 150, C, 200, D, 250 °C.
                                                                         methanol, and 1% acetic acid.


and MI+, having mobilities either less or greater than M+, it is         repulsion with the greater ion density of the more concentrated
clear that the peak will be broadened relative to a peak composed        samples, the coincidence of the β values argues against this. More
of pure M+. If the forward and reverse reactions of eq 6 are rapid       extensive examination of this situation is needed. In a related
relative to the mobility experiment, then selective detection will       study, Figure 6 shows resolution as a function of analyte
have no effect on peak width since the relative ionic composition        concentration for cocaine, amphetamine and morphine with
will be uniform across the whole peak. However, if the reaction          concentrations ranging from 1 to 1000 µg/mL. A constant tg of
rates are on the same order as or slower than the mobility               0.2 ms was used for these SIM measurements, and since lower
experiment, then the leading edge of the peak will accumulate            concentrations of the sample produce a lower charge density in
ions more mobile than M+ while the trailing edge will have a             the migrating ion pulse, the low concentrations are expected to
higher proportion of ions lower in mobility than M+ in comparison        show higher resolving power if Coulombic repulsion is important.
to the central portion of the peak. In this case, mass selective         The figure shows this is indeed the case. The overall lower
detection will not record these ions in the leading and trailing         resolving power for amphetamine is probably the result of the
edges of the peak, and the measured width will be less than with         shorter drift time for this analyte (13.36 ms vs 19.31 ms for cocaine
nonselective detection.                                                  and 18.33 ms for morphine), resulting in a greater relative
    Desolvation and Temperature. According to eq 3, lowering             contribution of tg to the total peak width. For all three analytes,
the drift tube temperature is an effective means to increase the         at concentrations less than 100 µg/mL resolution increases
resolving power of an ion mobility spectrometer. On the other            greatly, and in fact, for the lowest two concentrations of cocaine
hand, we rely on the high temperature of the countercurrent drift        and morphine, R is above the diffusion limit. This rapid decrease
gas to supply the heat needed to desolvate analyte ions, so it is        in peak width at the lowest concentrations is contrary to what
important to operate our system at the lowest temperature that           would be expected from Coulombic repulsion, since the repulsive
will accomplish this. Figure 5 compares ion mobility spectra of          force becomes less and approaches zero as the absolute charge
solvent ions obtained at four different temperatures. At 100 °C,         density approaches zero. These low-concentration results are
poorly resolved peak clusters are observed at 16.6 (major), 18.2,        possibly due to inadequate sampling of the very weak signals, as
19.7, and 21.9 ms. As the drift gas temperature is increased to          discussed above. Whatever the explanation of these lowest
250 °C, these peaks become better resolved and move to faster            concentration results, for best resolution it appears that the IMS
drift times, presumably as the number of clustered solvent ions          should be operated at the lowest ion currents possible.
decreases. In the 250 °C spectrum, the two major ions were mass             Ionic Charge. From eqs 3 and 4, we see that the diffusion-
identified as m/z ) 19 (7.5 ms, H3O+) and ) 75 (10.1 ms, C3H7O2+,        limited resolving power increases with the square root of the
protonated methyl acetate). As suggested by this study, we found         number of charges on the ion. Multiple charging of compounds
that complete desolvation of analyte ions required a drift tube          by electrospray ionization is common, with 30 charges or more
temperature of 250 °C.                                                   reported for some proteins. The combination of multiple charges
    Analyte Concentration. Note that the wd values in Table 3            and large collision cross sections with low analyte concentration
for the 1.0 mg/mL experiments are slightly greater than the              and the other characteristics of our ESI-IMS-MS have acted in
corresponding values for the 0.1 mg/mL samples. Although it is           concert to produce the highly resolved ion spectra of two proteins,
tempting to attribute this observation to additional Coulombic           cytochrome c and ubiquitin, shown in Figure 7.
                                                                           Analytical Chemistry, Vol. 70, No. 23, December 1, 1998      4937
we would need to find another way to supply heat of vaporization
                                                                                    directly to the ESI droplets. Second, resolving power could be
                                                                                    increased by increasing the total drift voltage. As discussed in
                                                                                    the introduction, to increase resolving power by increasing V it
                                                                                    is also necessary to increase tube length to remain in the low-
                                                                                    field regime.
                                                                                        In this connection it should be noted that Spangler has recently
                                                                                    reported that, while ion velocity will no longer be proportional to
                                                                                    the strength of the electric field, high-field conditions may further
                                                                                    increase the resolving power of IMS.30 Moreover, high-field
                                                                                    conditions may vary the separation factor between ions. Separa-
                                                                                    tion factor R′ is defined here for the ion mobility spectrometer in
                                                                                    a manner similar to that used in chromatography:
                                                                                                           R′ ) K1/K2 ) v1/v2                        (7)


                                                                                        Where v1 and K1 are the ion velocity and mobility of the ion
                                                                                    with the fastest drift time and v2 and K2 are the ion velocity and
                                                                                    mobility of the ion with the longest drift time, respectively. For
                                                                                    low-field conditions R′ is constant, but for high-field conditions R′
                                                                                    becomes a function of the electric field strength. While there has
                                                                                    not been much published on ion mobility under high-field strength
Figure 7. Ion mobility spectra of cytochrome c and ubiquitins                       conditions, the transverse ion mobility spectrometer uses this
separation of multiply charged ions.                                                phenomenon to maximize separation between two ions.31 For
                                                                                    time-of-flight IMS, however, more investigation is required to test
                                                                                    the usefulness of high E fields for increasing resolution.
   The numbers above each peak or peak cluster indicate the                             Ion mobility spectrometry, originally known as plasma chro-
charge state of that peak or cluster. For example, the peak in                      matography and touted as a poor man’s mass spectrometer, has,
the cytochrome c spectrum with a drift time of 28.7 ms was mass                     over the years, proved not to have sufficient resolving power to
identified to be the (M + 17H)17+ ion. The resolving power that                     serve as a replacement for chromatography much less mass
was calculated from this ion was 120. The highest resolving power                   spectrometry. In fact, the resolving power of atmospheric pres-
calculated from this spectrum was from the peak located at a drift                  sure ion mobility spectrometers has been so low that IMS has
time of 36.7 ms. Identified as the (M + 11H)11+ ion, the resolving                  primarily been useful only as a selective detection device after
power was determined to be 216. Note the baseline separation                        high-resolution chromatography. Thus, with the improvements
of each charge state.                                                               in resolving power reported in this work, IMS appears poised to
                                                                                    become a separation method in its on right, providing orthogonal
CONCLUSIONS                                                                         separation data that complements rather than competes with those
    The improved resolving power exhibited by our ESI-IMS-MS                        obtained with both chromatography and mass spectrometry.
appears to be due mainly to improved electric field homogeneity
and detection speed, with contributions from selective ion moni-                    ACKNOWLEDGMENT
toring and the tendency of target analytes appropriate for ESI to                      The authors thank Dr. Glen Spangler for his initial advice in
have long drift times and multicharged ions. For low concentra-                     constructing the IMS-MS instrument and Dr. Gary Van Berkelfor
tions and very narrow gate widths we have often noted anoma-                        discussions on the electrospray process. This project was sup-
lously high resolving power, possibly because of very small ion                     ported in part by the Washington State University Drug Abuse
samples. We are certainly at the very limit of rise time possible                   Program, the Federal Aviation Administration Grant 97G009, and
with our electrometer amplifier and should probably change to                       a Research Fellowship for C.W. provided by STEC, Inc., Japan.
time-to-digital conversion for these very weak signals.                             This paper was presented in part at the 45th ASMS Conference
    There are two main avenues to further improve the resolving                     on Mass Spectrometry and Allied Topics, Palm Springs, CA, June
power of our apparatus. Operating the drift tube at much lower                      1997.
temperatures could greatly increase resolving power, although
                                                                                    Received for review April 13, 1998. Accepted August 7,
(30) Spangler, G. E. Fifth International IMS Workshop, Jackson, WY, 1996.           1998.
(31) Buryakov, I. A.; Krylov, E. V.; Nazarov, E. G.; Rasulev, U. Kh. Int. J. Mass
     Spectrom. Ion Processes 1993, 128, 143.                                        AC980414Z


4938 Analytical Chemistry, Vol. 70, No. 23, December 1, 1998

Contenu connexe

Tendances

EM monitoring of CO2 sequestration
EM monitoring of CO2 sequestration EM monitoring of CO2 sequestration
EM monitoring of CO2 sequestration Saurabh Wagh
 
cm702564a. web release pdf
cm702564a. web release pdfcm702564a. web release pdf
cm702564a. web release pdfFraser Harris
 
International Journal of Engineering and Science Invention (IJESI)
International Journal of Engineering and Science Invention (IJESI)International Journal of Engineering and Science Invention (IJESI)
International Journal of Engineering and Science Invention (IJESI)inventionjournals
 
Saline_Interface_Mapping
Saline_Interface_MappingSaline_Interface_Mapping
Saline_Interface_MappingBenjamin Seive
 
Organic Spintronics
Organic SpintronicsOrganic Spintronics
Organic Spintronicsminkayj
 
Chris EstevezGeophysics - Petroleum - EM Methods
Chris EstevezGeophysics - Petroleum - EM MethodsChris EstevezGeophysics - Petroleum - EM Methods
Chris EstevezGeophysics - Petroleum - EM MethodsChristopher Estevez
 
Application Of Resistivity For Groundwater, Hydrogeology and Pollution Research
Application Of Resistivity For Groundwater, Hydrogeology and Pollution ResearchApplication Of Resistivity For Groundwater, Hydrogeology and Pollution Research
Application Of Resistivity For Groundwater, Hydrogeology and Pollution ResearchOmokpariolaElshalom
 
A Novel Method For Production of Cr-51_INIS
A Novel Method For Production of Cr-51_INISA Novel Method For Production of Cr-51_INIS
A Novel Method For Production of Cr-51_INISmohamed aydia
 
Biofilm remediation of aluminum, iron and manganese using “microchip wetland”...
Biofilm remediation of aluminum, iron and manganese using “microchip wetland”...Biofilm remediation of aluminum, iron and manganese using “microchip wetland”...
Biofilm remediation of aluminum, iron and manganese using “microchip wetland”...Colin Lennox
 
Exploring the Relationship between Moisture Content and Electrical Resistivit...
Exploring the Relationship between Moisture Content and Electrical Resistivit...Exploring the Relationship between Moisture Content and Electrical Resistivit...
Exploring the Relationship between Moisture Content and Electrical Resistivit...inventionjournals
 
Morphological instabilities in argon ion sputtered cosi binary mixtures
Morphological instabilities in argon ion sputtered cosi binary mixturesMorphological instabilities in argon ion sputtered cosi binary mixtures
Morphological instabilities in argon ion sputtered cosi binary mixturesDr. Basanta Kumar Parida
 
2nd Webinar on Nanotechnology and Nanoscience
2nd Webinar on Nanotechnology and Nanoscience2nd Webinar on Nanotechnology and Nanoscience
2nd Webinar on Nanotechnology and NanoscienceSiti Husnaa Mohd Taib
 
Radiopharmaceuticals
RadiopharmaceuticalsRadiopharmaceuticals
RadiopharmaceuticalsPravinMuli
 
Calixpyrrolepptx
CalixpyrrolepptxCalixpyrrolepptx
CalixpyrrolepptxPhilip Gale
 
Band gap engineering of indium zinc oxide by nitrogen incorporation
Band gap engineering of indium zinc oxide by nitrogen incorporationBand gap engineering of indium zinc oxide by nitrogen incorporation
Band gap engineering of indium zinc oxide by nitrogen incorporationYahaya Balarabe
 

Tendances (18)

EM monitoring of CO2 sequestration
EM monitoring of CO2 sequestration EM monitoring of CO2 sequestration
EM monitoring of CO2 sequestration
 
Ikard et al 2013a
Ikard et al 2013aIkard et al 2013a
Ikard et al 2013a
 
cm702564a. web release pdf
cm702564a. web release pdfcm702564a. web release pdf
cm702564a. web release pdf
 
Poster Draft V5
Poster Draft V5Poster Draft V5
Poster Draft V5
 
International Journal of Engineering and Science Invention (IJESI)
International Journal of Engineering and Science Invention (IJESI)International Journal of Engineering and Science Invention (IJESI)
International Journal of Engineering and Science Invention (IJESI)
 
Saline_Interface_Mapping
Saline_Interface_MappingSaline_Interface_Mapping
Saline_Interface_Mapping
 
Organic Spintronics
Organic SpintronicsOrganic Spintronics
Organic Spintronics
 
Chris EstevezGeophysics - Petroleum - EM Methods
Chris EstevezGeophysics - Petroleum - EM MethodsChris EstevezGeophysics - Petroleum - EM Methods
Chris EstevezGeophysics - Petroleum - EM Methods
 
Application Of Resistivity For Groundwater, Hydrogeology and Pollution Research
Application Of Resistivity For Groundwater, Hydrogeology and Pollution ResearchApplication Of Resistivity For Groundwater, Hydrogeology and Pollution Research
Application Of Resistivity For Groundwater, Hydrogeology and Pollution Research
 
A Novel Method For Production of Cr-51_INIS
A Novel Method For Production of Cr-51_INISA Novel Method For Production of Cr-51_INIS
A Novel Method For Production of Cr-51_INIS
 
Biofilm remediation of aluminum, iron and manganese using “microchip wetland”...
Biofilm remediation of aluminum, iron and manganese using “microchip wetland”...Biofilm remediation of aluminum, iron and manganese using “microchip wetland”...
Biofilm remediation of aluminum, iron and manganese using “microchip wetland”...
 
Exploring the Relationship between Moisture Content and Electrical Resistivit...
Exploring the Relationship between Moisture Content and Electrical Resistivit...Exploring the Relationship between Moisture Content and Electrical Resistivit...
Exploring the Relationship between Moisture Content and Electrical Resistivit...
 
Morphological instabilities in argon ion sputtered cosi binary mixtures
Morphological instabilities in argon ion sputtered cosi binary mixturesMorphological instabilities in argon ion sputtered cosi binary mixtures
Morphological instabilities in argon ion sputtered cosi binary mixtures
 
2nd Webinar on Nanotechnology and Nanoscience
2nd Webinar on Nanotechnology and Nanoscience2nd Webinar on Nanotechnology and Nanoscience
2nd Webinar on Nanotechnology and Nanoscience
 
Radiopharmaceuticals
RadiopharmaceuticalsRadiopharmaceuticals
Radiopharmaceuticals
 
Ppij 06-00172
Ppij 06-00172Ppij 06-00172
Ppij 06-00172
 
Calixpyrrolepptx
CalixpyrrolepptxCalixpyrrolepptx
Calixpyrrolepptx
 
Band gap engineering of indium zinc oxide by nitrogen incorporation
Band gap engineering of indium zinc oxide by nitrogen incorporationBand gap engineering of indium zinc oxide by nitrogen incorporation
Band gap engineering of indium zinc oxide by nitrogen incorporation
 

Similaire à ESI-HRIMS-MS for Separating Multiply Charged Ions

L1 introduction and history
L1  introduction and historyL1  introduction and history
L1 introduction and historyAnupam Banerjee
 
Edri And Regev 2009 “Shaken, Not Stable”: Dispersion Mechanism and Dynami...
Edri And Regev   2009   “Shaken, Not Stable”: Dispersion Mechanism and Dynami...Edri And Regev   2009   “Shaken, Not Stable”: Dispersion Mechanism and Dynami...
Edri And Regev 2009 “Shaken, Not Stable”: Dispersion Mechanism and Dynami...edrier
 
Electronic Switching of Single Silicon Atoms by Molecular Field Effects
Electronic Switching of Single Silicon Atoms by Molecular Field EffectsElectronic Switching of Single Silicon Atoms by Molecular Field Effects
Electronic Switching of Single Silicon Atoms by Molecular Field Effectsioneec
 
Molecular Mean Field Theory of ions in Bulk and Channels
Molecular Mean Field Theory of ions in Bulk and ChannelsMolecular Mean Field Theory of ions in Bulk and Channels
Molecular Mean Field Theory of ions in Bulk and ChannelsBob Eisenberg
 
(Advances in microbial physiology 9) a.h. rose and d.w. tempest (eds.) academ...
(Advances in microbial physiology 9) a.h. rose and d.w. tempest (eds.) academ...(Advances in microbial physiology 9) a.h. rose and d.w. tempest (eds.) academ...
(Advances in microbial physiology 9) a.h. rose and d.w. tempest (eds.) academ...amin beni
 
Ic981126o
Ic981126oIc981126o
Ic981126oinscore
 
Arranging atoms one by one the way we want them
Arranging atoms one by one the way we want themArranging atoms one by one the way we want them
Arranging atoms one by one the way we want themOndrej Dyck
 
2DIAGNOSTICSe-p.ppt
2DIAGNOSTICSe-p.ppt2DIAGNOSTICSe-p.ppt
2DIAGNOSTICSe-p.pptHoca26
 
synthesis of semiconducting polymers for possible application in [autosaved]
synthesis of semiconducting polymers for possible application in [autosaved]synthesis of semiconducting polymers for possible application in [autosaved]
synthesis of semiconducting polymers for possible application in [autosaved]Boniface Y. Antwi
 
Ion beam irradiation of polycarbonate_TEST
Ion beam irradiation of polycarbonate_TESTIon beam irradiation of polycarbonate_TEST
Ion beam irradiation of polycarbonate_TESTMircea Chipara
 
Diazonium Protein... Corgier Et Al.
Diazonium Protein...   Corgier Et Al.Diazonium Protein...   Corgier Et Al.
Diazonium Protein... Corgier Et Al.christophemarquette
 
Examination of methods to determine free-ion diffusivity and number density f...
Examination of methods to determine free-ion diffusivity and number density f...Examination of methods to determine free-ion diffusivity and number density f...
Examination of methods to determine free-ion diffusivity and number density f...Weston Bell
 
The E3 center in zinc oxide - Evidence for involvement of hydrogen - A. Hupfe...
The E3 center in zinc oxide - Evidence for involvement of hydrogen - A. Hupfe...The E3 center in zinc oxide - Evidence for involvement of hydrogen - A. Hupfe...
The E3 center in zinc oxide - Evidence for involvement of hydrogen - A. Hupfe...Chidanand Bhoodoo
 
Magnon crystallization in kagomé antiferromagnets
Magnon crystallization in kagomé antiferromagnetsMagnon crystallization in kagomé antiferromagnets
Magnon crystallization in kagomé antiferromagnetsRyutaro Okuma
 

Similaire à ESI-HRIMS-MS for Separating Multiply Charged Ions (20)

L1 introduction and history
L1  introduction and historyL1  introduction and history
L1 introduction and history
 
Mass spectrometry - A detailed study on components
Mass spectrometry - A detailed study on components Mass spectrometry - A detailed study on components
Mass spectrometry - A detailed study on components
 
Edri And Regev 2009 “Shaken, Not Stable”: Dispersion Mechanism and Dynami...
Edri And Regev   2009   “Shaken, Not Stable”: Dispersion Mechanism and Dynami...Edri And Regev   2009   “Shaken, Not Stable”: Dispersion Mechanism and Dynami...
Edri And Regev 2009 “Shaken, Not Stable”: Dispersion Mechanism and Dynami...
 
Electronic Switching of Single Silicon Atoms by Molecular Field Effects
Electronic Switching of Single Silicon Atoms by Molecular Field EffectsElectronic Switching of Single Silicon Atoms by Molecular Field Effects
Electronic Switching of Single Silicon Atoms by Molecular Field Effects
 
Molecular Mean Field Theory of ions in Bulk and Channels
Molecular Mean Field Theory of ions in Bulk and ChannelsMolecular Mean Field Theory of ions in Bulk and Channels
Molecular Mean Field Theory of ions in Bulk and Channels
 
(Advances in microbial physiology 9) a.h. rose and d.w. tempest (eds.) academ...
(Advances in microbial physiology 9) a.h. rose and d.w. tempest (eds.) academ...(Advances in microbial physiology 9) a.h. rose and d.w. tempest (eds.) academ...
(Advances in microbial physiology 9) a.h. rose and d.w. tempest (eds.) academ...
 
SNBoseTalk06
SNBoseTalk06SNBoseTalk06
SNBoseTalk06
 
Ic981126o
Ic981126oIc981126o
Ic981126o
 
Arranging atoms one by one the way we want them
Arranging atoms one by one the way we want themArranging atoms one by one the way we want them
Arranging atoms one by one the way we want them
 
2DIAGNOSTICSe-p.ppt
2DIAGNOSTICSe-p.ppt2DIAGNOSTICSe-p.ppt
2DIAGNOSTICSe-p.ppt
 
synthesis of semiconducting polymers for possible application in [autosaved]
synthesis of semiconducting polymers for possible application in [autosaved]synthesis of semiconducting polymers for possible application in [autosaved]
synthesis of semiconducting polymers for possible application in [autosaved]
 
Lunar core dynamo
Lunar core dynamoLunar core dynamo
Lunar core dynamo
 
Sandrogreco Hyperconj Trends Ja 02[1]
Sandrogreco Hyperconj Trends Ja 02[1]Sandrogreco Hyperconj Trends Ja 02[1]
Sandrogreco Hyperconj Trends Ja 02[1]
 
Mass spectrometry
Mass spectrometry Mass spectrometry
Mass spectrometry
 
Ion beam irradiation of polycarbonate_TEST
Ion beam irradiation of polycarbonate_TESTIon beam irradiation of polycarbonate_TEST
Ion beam irradiation of polycarbonate_TEST
 
Diazonium Protein... Corgier Et Al.
Diazonium Protein...   Corgier Et Al.Diazonium Protein...   Corgier Et Al.
Diazonium Protein... Corgier Et Al.
 
Dep
DepDep
Dep
 
Examination of methods to determine free-ion diffusivity and number density f...
Examination of methods to determine free-ion diffusivity and number density f...Examination of methods to determine free-ion diffusivity and number density f...
Examination of methods to determine free-ion diffusivity and number density f...
 
The E3 center in zinc oxide - Evidence for involvement of hydrogen - A. Hupfe...
The E3 center in zinc oxide - Evidence for involvement of hydrogen - A. Hupfe...The E3 center in zinc oxide - Evidence for involvement of hydrogen - A. Hupfe...
The E3 center in zinc oxide - Evidence for involvement of hydrogen - A. Hupfe...
 
Magnon crystallization in kagomé antiferromagnets
Magnon crystallization in kagomé antiferromagnetsMagnon crystallization in kagomé antiferromagnets
Magnon crystallization in kagomé antiferromagnets
 

ESI-HRIMS-MS for Separating Multiply Charged Ions

  • 1. Anal. Chem. 1998, 70, 4929-4938 Electrospray Ionization High-Resolution Ion Mobility Spectrometry-Mass Spectrometry Ching Wu, William F. Siems, G. Reid Asbury, and Herbert H. Hill, Jr.* Department of Chemistry, Washington State University, Pullman, Washington 99164-4630 A hybrid atmospheric pressure ion mobility spectrometer Later, Dole and co-workers reported work with polystyrene, is described which exhibits resolving power approaching speculating that the broad peaks were due to excess solvent ions, the diffusion limit for singly and multiply charged ions which were adsorbed to the surface of the macroion aggregates.3 (over 200 for the most favorable case). Using an elec- Finally, they concluded that because of the difficulty in evaporating trospray ionization source and a downstream quadrupole the solvent from the electrosprayed ions under atmospheric mass spectrometer with electron multiplier as detector, conditions, electrospray ionization would be useful only for mass this ESI-IMS-MS instrument demonstrates the potential spectrometry in which the solvent could be efficiently eliminated of IMS for rapid analytical separations with a resolving under vacuum conditions.4 Smith and co-workers also found that power similar to liquid chromatography. The first mea- it was difficult to separate electrosprayed proteins by IMS due to surements of gas-phase mobility spectra of mass-identified inefficient desolvation of the electrosprayed droplets.5 Their data multiply charged ions migrating at atmospheric pressure resembled that of Dole’s earlier work. Unlike Dole’s arrangement, are reported. These spectra confirm that collision cross in which the gas flow was in the same direction as ion migration, sections are strongly affected by charge state. Baseline we have reported the need for a counterflow of heated, dry separations of multiply charged states of cytochrome c and nitrogen drift gas to efficiently evaporate the solvent from ubiquitin demonstrate the improved resolving power of electrosprayed droplets.6 This counterflow design produced stable this instrument compared with previous atmospheric and completely desolvated electrosprayed ions, exhibiting reduced pressure ion mobility spectrometers. The effects of mobility constants that were reproducible with respect to tem- electric potential, initial pulse duration, ion-molecule perature, flow, and solvent type.7 Application of electrospray reactions, ion desolvation, Coulombic repulsion, electric ionization-ion mobility spectrometry (ESI-IMS) was demonstrated field homogeneity, ion collection, and charge on the as a detection method for liquid chromatography,8 capillary resolving power of this ion mobility spectrometer are electrophoresis,9 and liquid process streams.10 discussed. The difficulty with this initial counterflow ESI-IMS design was that the heated drift gas raised the temperature of the electrospray For more than twenty-five years, ion mobility spectrometry (IMS) has been used as a method for trace organic analysis, sufficiently to volatilize the solvent before it could exit the needle finding important application in the vapor-phase detection of and generate the spray. Thus, to increase sensitivity and stabil- explosives, drugs, and chemical warfare agents.1 While the ity,11 corona spray was often preferred over true electrospray primary targets of IMS analysis have been volatile organic conditions. To address this prespray solvent evaporation problem compounds using radioactive ionization, recent developments in we developed a water-cooled electrospray ionization source that electrospray ionization have enabled the analysis of nonvolatile (3) Dole, M.; Gupta, C. V.; Mack, L. L.; Nakamae, K. Polym. Prepr. (Am. Chem. organics from liquid-phase samples. Soc., Div. Polym. Chem.) 1977, 18 (2), 188-193. Electrospray as an ionization source for ion mobility spectrom- (4) Gieniec, J.; Mack, L. L.; Nakamae, K.; Gupta, C.; Kumar, V.; Dole, M. Biomed. etry was first demonstrated by Dole and co-workers in 19722 by Mass Spectrom, 1984, 11 (6), 259. (5) Smith, R. D.; Loo, J. A.; Ogorzalek, R. R.; Busman, M. Mass Spectrom. Rev. electrospraying lysozyme into an ion mobility spectrometer to 1991, 10, 359-451. produce three broad peaks. In Dole’s instrument, the nitrogen (6) Shumate, C. B.; Hill, H. H., Jr. Northwest Regional ACS Meeting, Bellingham, drift gas was introduced into the spectrometer at the “rear of the WA, June 1987. (7) Shumate, C. B. An Electrospray Nebulization/Ionization Interface for Liquid spray tube” in order to help sweep ions downstream. As the drift Introduction into an Ion Mobility Spectrometer Ph.D. Thesis, Washington gas flow was increased, more efficient evaporation of the solvent State University, 1989. was observed and the lysozyme ions drifted faster. However, ion (8) McMinn, D. G.; Kinzer, J. A.; Shumate, C. B.; Siems, W. F.; Hill, H. H., Jr. J. Microcolumn Sep. 1990, 2, 188-192. peaks resulting from these experiments were very broad and did (9) Hallen, R. W.; Shumate, C. B.; Siems, W. F.; Tsuda, T.; Hill, H. H., Jr.; J. not demonstrate the presence of multiple charges on the lysozyme. Chromatogr. 1989, 480, 233-245. (10) Shumate, C. B.; Hill, H. H., Jr. Electrospray Ion Mobility SpectrometrysIts * Corresponding author: (tel) (509) 335-5648; (e-mail) hhhill@wsu.edu. Potential as a Liquid-Stream Process Sensor. In Pollution Prevention in (1) Eiceman, G. A.; Karpas, Z. Ion Mobility Spectrometry; CRC Press: Boca Raton, Industrial ProcessessThe Role of Process Analytical Chemistry; Breen, J. J., FL, 1994. Dellarco, M. J., Eds.; ACS Symposium Series 508; American Chemical (2) Gieniec, M. L.; Cox, J., Jr.; Teer, D.; Dole, M. 20th Annual Conference on Society: Washington, DC, 1992. Mass Spectrometry and Allied Topics, Dallas, TX, June 4-9, 1972. (11) Shumate, C. B.; Hill, H. H., Jr. Anal. Chem. 1989, 61, 601-606. 10.1021/ac980414z CCC: $15.00 © 1998 American Chemical Society Analytical Chemistry, Vol. 70, No. 23, December 1, 1998 4929 Published on Web 10/24/1998
  • 2. could be interfaced directly to high-temperature IMS.12 The D ) kTK/ez (2) advantages of this cooled electrospray source included rapid desolvation of sprayed droplets, prevention of solute precipitation and developed an expression for measured pulse width in cases in the spray needle, efficient transmission of ion spray into the where Coulombic repulsion and ion-molecule reactions are IMS, and elimination of corona ionization.13 In addition, both unimportant and where the initial ion pulse has a Gaussian shape signal/noise (S/N) ratio and resolving power were improved for of duration tg at half-maximum ESI-IMS by using the Fourier transform mode of operation.14 With the cooled electrospray source, IMS proved to be a sensitive and practical detection method for liquid chromatography with detec- w2 ) tg2 + (16kT ln 2)t Vez d 2 (3) tion limits as low as 1 × 10-15 mol s-1 and a linear response range of 3-4 orders of magnitude.15 While the development of electrospray ionization expanded the where k is Boltzman’s constant, T is the temperature of the drift domain of IMS into polar and nonvolatile compounds, the low gas in kelvin, V is the potential across the drift length, e is the resolving power of ion mobility spectrometry has continued to elementary charge, and z is the number of charges on the ion. In limit the analytical potential of IMS as a separation device. the limit, as td becomes very large compared to tg, the diffusion- Resolving power has been investigated throughout the history of limited resolving power is obtained from eq 3 ( ) ( ) ( ) analytical IMS,16-26 with definitions of resolving power based on tg 1/2 1/2 Vez Vez mass separation,17 separation of pairs of peaks,18 or a single-peak- Rd ≡ lim R f0 ) ) 0.300 (4) td 16kT ln 2 kT based quotient.19 The now generally accepted single-peak-based measurement of IMS resolving power is For typical IMS devices and conditions (10 cm drift tube with a R ) td/w (1) 300 V cm-1 electric field, 125 °C temperature), Rd is on the order of 100 for singly charged ions, but this limit has been elusive. where td is the ion drift time and w is the ion pulse duration at Spangler and Collins17 obtained good qualitative agreement to the detector measured at half of the maximal intensity. The first experimental IMS peak shapes by convoluting a step function atmospheric pressure ion mobility spectrum, reported in 1970 for representing initial pulse shape with a Gaussian function repre- dimethyl sulfoxide, showed a resolving power of 30 20 by this senting diffusion. These authors also estimated that mutual definition. Since that time, all commercial atmospheric pressure repulsion has a small but measurable effect on pulse width, with ion mobility spectrometers have had similar resolving power, this Coulombic broadening increasing as the initial pulse width despite theoretical predictions of higher values. increases. It should be noted that this result assumed the ∼1 × Revercomb and Mason16 described four phenomena affecting 10-9 A total ion current typical of β- emitter ion sources. Despite ion pulse characteristics measured at the detector: (1) the initial a good qualitative picture of peak shape, Spangler and Collins ion pulse width and shape introduced into the drift region, (2) needed to introduce a “Townsend energy factor”, η ) 2.7, as a broadening by mutual Coulomb repulsion between the ions, (3) multiplier for the kT in the numerator of eq 3 in order to match broadening by diffusion as the ion pulse drifts down the electric experimental peak widths. Although this factor was rationalized field, and (4) ion-molecule reactions with the drift gas or with as accounting for higher effective temperature of ions which are impurities. They used the Einstein relation between the diffusion continually receiving energy from the electric field, the Townsend coefficient, D (in cm2 s-1), and the mobility, K (in cm2 V-1 s-1) energy factor is known to be close to 1 for ions under atmospheric pressure IMS conditions.24 (12) Wittmer, D.; Chen, Y. H.; Luckenbill, B. K.; Hill, H. H., Jr. Anal. Chem. Siems et al.24 have fit experimental pulse width data for singly 1994, 66, 2348-2355. (13) Chen, Y. H.; Hill, H. H., Jr.; Wittmer, D. P. Intl. J. Mass Spectrosc. Ion Processes charged ions in a number of IMS instruments to a semiempirical 1996, 154, 1-13. model based on eq 3 (14) Chen, Y. H.; Siems, W. F.; Hill, H. H., Jr. Anal. Chim. Acta 1996, 334, 75-84. w2 ) γ + βtg2 + R(Ttd2/V) (5) (15) Chen, Y. H.; Hill, H. H., Jr.; Wittmer, D. P.; J. Microcolumn Sep. 1994, 6, 515-524. (16) Revercomb, H. E.; Mason, E. A. Anal. Chem. 1975, 47, 970-983. (17) Spangler, G. E.; Collins, C. I. Anal. Chem. 1975, 47, 403-407. and compared best-fit R, β, and γ parameters to the theoretical (18) Karasek, F. W.; Kim, S. H. Final Report, Contract 8SU77-00227; University predictions γ ) 0 s2, β ) 1, and R ) 9.57 × 10⁻⁴ V/K (this R of Waterloo Research Institute, Waterloo, Ontario, Canada, 1980. (19) Rokushika, S.; Hatano, H.; Baim, M. A.; Hill, H. H. Anal. Chem. 1985, 57, should be divided by z1/2 for multiply charged ions). All three 1902-1907. parameters were found to be greater than the theoretical predic- (20) Cohen, M. J.; Karasek, F. W. J. Chromatogr. Sci. 1970, 8, 330-337. tions for each of the instruments studied. That R values were (21) Mason, E. A. Ion Mobility: Its Role in Plasma Chromatography. In Plasma Chromatography; Carr, T. W., Ed.; Plenum Press: New York, 1984. generally in the range (1.2-1.5) × 10-3 V/K, which was attributed (22) Brokenshire, J. L. FACSS Meeting, Anaheim, CA, October 1991. mainly to electric field inhomogeneity, while β values of 1.1-1.3 (23) Eiceman, G. A.; Karpas, Z. Ion Mobility Spectrometry; CRC Press: Boca Raton, were attributed to Coulomb repulsion, and γ values of (0.5-2) × FL, 1994; pp 99-100. (24) Siems, W. F.; Wu, C.; Tarver, E. E.; Hill, H. H.; Larsen, P. R.; McMinn, D. 10-8 s2 were attributed to collector and amplifier rise time. G. Anal. Chem. 1994, 66, 4195-4201. According to eqs 3 and 4, the primary ways to increase (25) Leonhardt, J. W.; Rohrbeck, W.; Bensch, H. Fourth International IMS resolving power are to (1) raise the total voltage across the drift Workshop, Cambridge, U.K., 1995. (26) Dugourd, Ph.; Hudgins, R. R.; Clemmer, D. E.; Jarrold, M. F. Rev. Sci. space, (2) decrease the initial pulse width, (3) lower the temper- Instrum. 1997, 68, 1122-1129. ature of the drift gas, and (4) increase the number of charges on 4930 Analytical Chemistry, Vol. 70, No. 23, December 1, 1998
  • 3. the ions. To these primary factors we may add secondary factors maximum. They suggested that Coulombic repulsion was the suggested by eq 5s(5) increase the homogeneity of the electric primary reason for low resolution in IMS but were unable to field experienced by the ions, (6) decrease Coulombic repulsion demonstrate this effect experimentally. within the ion pulse, and (7) shorten the rise time of ion collection We report here the construction and evaluation of an atmo- and amplification. Finally we must recognize that higher resolving spheric pressure ion mobility spectrometer with an electrospray power will be achieved if we (8) study ions of high charge and/ ionization source and a quadrupole mass spectrometer to identify or low mobility (long td means resolving power close to the and detect those ions after mobility separation. Our experimental diffusion limit of eq 4), and (9) eliminate or mask the effects of conditions give some a priori expectations about resolving power labile clusters and ion-molecule reactions in the drift tube. for this instrument. The relatively long drift times and multiple Several investigators have increased IMS resolving power by charges of ESI generated ions should tend to give relatively lengthening the drift tube along with increasing its voltage.22-26 narrow peaks and larger R values. On the other hand, our high There are several reasons why increasing R by increasing voltage operating temperature, dictated by the need to desolvate ions, also requires making the tube longer. First, increasing V without tends to lower R. In addition, we must watch for greater Coulomb increasing L also raises electric field strength, E ) V/L, eventually broadening with the high total ion currents of ESI compared to resulting in electrical breakdown. Second, it has generally been β- sources. deemed important to operate in the low-field regime in which the ion velocity remains proportional to E. This requires that IMS EXPERIMENTAL SECTION experiments be performed with an E/N ratio no more than (1- Instrumentation. The electrospray ionization ion mobility/ 2) × 10-17 V cm2 ,21 where N is the number density of the drift mass spectrometer instrument used in this study was constructed gas (in cm-3). Thus, for atmospheric pressure conditions, where at Washington State University. A scale drawing of the instrument N ) 2.46 × 1019cm-3 (25 °C and 1 atm), the typical E values have is shown in Figure 1. The water-cooled electrospray source was been between 246 and 493 V/cm. Third, and with even more developed here several years ago.12 In this ESI source, a water- serious consequences for resolving power, increasing V without cooled jacket surrounds the spray needle assembly and water- lengthening the drift tube also increases the relative contribution cooled nitrogen flows along the axis of and in contact with the of tg to w, since td decreases linearly with V. This means that, for spray needle. The nitrogen exits the spray assembly concentric a drift tube of given length, for each choice of tg there is an with the needle and contributes to nebulization of the electro- optimum drift voltage, Vopt, that maximizes R17,24 sprayed mist. The objective of cooling the spray needle and spray thoroughly is to prevent the heated drift gas from causing solvent ( RTL2 ) evaporation inside the needle. A detailed drawing of this elec- 1/3 Vopt ) (6) trospray ionization source can be found on page 2350 in Figure 3 2(γ + βtg2)1/2K2 of ref 12. The electrospray is drawn by electric potential toward and through a 16-mesh stainless steel focus screen into the desolvation although for singly charged ions it is usually necessary to operate region of the spectrometer, where the charged mist migrates in above Vopt to maintain signal strength. an electric field through a counterflow of heated nitrogen drift Brokenshire constructed a 44-cm-long drift tube with a 10-cm gas. During the few milliseconds of migration through the diameter and reported a 5-10-fold increase in resolving power desolvation region, solvent evaporates from the droplets, leaving over traditional IMS instruments.22 In Brokenshire’s design, the solvent and analyte ions. The temperature of the desolvation aperture grid and the collector plate had a large diameter so that region can be controlled independently from the drift region by radial diffusion of ions did not decrease signal intensity.23 We the introduction of a separately heated diluent drift gas at the reported an IMS design in which the resolving power was interface between the desolvation region and the ion drift region. improved over commercial instruments using a drift length of 15.6 The temperature of the diluent drift gas can be selected to either cm and a drift voltage of 7000 V.24 Leowhardt et al. have reported cool or heat the drift gas as it passes into the desolvation region. the use of drift fields up to 700 V/cm to reach R values as high In the experiments reported here, however, no diluent gas was as 120 for singly charged species.25 Dugrourd et al. recently added and the temperature in the desolvation region was the same reported a low-pressure high-resolution IMS instrument where as that in the drift region. they place a potential of 14 000 V across a 63-cm drift tube at 500 Two ion gates are located at the entrance and exit of the drift Torr to produce a resolving power of 172.26 region of the spectrometer. These identical Bradbury-Nielsen- Watts and Widers27 evaluated several ion mobility instruments type gates are constructed using parallel Alloy 46 (California Fine with respect to resolving power. They calculated that the Wire Co., Grover Beach, CA) wires 76 µm in diameter with a 0.64- maximum resolving power (Rm) for the advanced vapor monitor mm spacing. The gates are “closed” by applying (37.5 V to (AVM) instrument (Graseby Dynamics, Ltd., Watford, Herts, adjacent wires so that a ∼1000 V/cm closing field is placed WD25JX, U.K.) was 50. For the PCP instrument (PCP, 2155 orthogonal to the drift field of the spectrometer. As positive ions Indian Road, West Palm Beach, FL), they calculated a range of approach the gate, they are collected on the negative wires of maximum resolution from 50 to over 100 and a laboratory- the gate, preventing them from passing through the gate. When constructed high-resolution tube (HRT) that was 44 cm in length the gates are “open”, all gate wires are pulsed to a single voltage had a theoretical maximum R between 125 and 275. Unfortu- appropriate to the gate’s position in the drift electric field. nately, none of these instruments performed near their theoretical Both the desolvation and drift regions are constructed of (27) Watts, P.; Wilders, A. Int. J. Mass Spectrom. Ion Processes 1992, 112, 179. electrically conducting stainless steel and electrically insulating Analytical Chemistry, Vol. 70, No. 23, December 1, 1998 4931
  • 4. Figure 1. Instrument schematic of high-resolution ion mobility spectrometer with electrospray ionization and mass identification. alumina rings stacked in an alternating and interlocking design. apparatus and allows us to vary the electrical potential on the Each repeating unit of the tube, consisting of one conducting and pinhole. The pinhole leak is attached to the carrier by six 4/40 one insulating ring, is 0.9 cm in length. The conducting rings screws and a gold seal. The leak was fabricated by machining a are 0.8 cm wide, and the insulating rings 0.1 cm wide. The central hole almost through a piece of 304 stainless steel, leaving conducting rings are connected to one another via a series of a metal membrane 250 µm in thickness through which a 40-µm- 1-MΩ resistors. The dimensions of the rings are machined to be diameter hole was drilled with a laser. The pinhole exhibited a 4.9-cm i.d. and 5.7-cm o.d. The desolvation region is 7.2 cm in leak flow rate of 28 cm3/s at 15 psi. This flow rate brings us close length, and the drift region is 13 cm in length. to the maximum pumping capacity of our diffusion pumps. The A crucial portion of our apparatus is the interface between the vacuum chamber for the mass spectrometer was constructed at ion mobility spectrometer and the mass spectrometer. It includes WSU and consisted of two chambers for differential pumping. Two (1) the extraction region, (2) the extraction plate, (3) the buffer Diffstak 160/700 diffusion pumps (Edwards High Vacuum Inc., gas region, (4) the pinhole leak and the (5) adiabatic expansion 3279, Grand Island Blvd. Grand Island, NY) were mounted close region. The extraction region is the space between the ion exit to the upper chamber in order to achieve the maximum pumping gate and the pinhole through which the ions continue to migrate capacity. Two ion gauges (Granville-Phillips, model 274006, at atmospheric pressure (in an electrical field slightly higher than Boulder, CO) were installed on the internal and external chamber the drift field). The extraction plate is the tapering terminal ring for pressure measurements. of the mobility spectrometer beyond which only ions from the The mass spectrometer was a C50-Q (ABB Extrel, 575 Epsilion, central 1.4 cm of the ion disk are permitted to continue toward Pittsburgh, PA) consisting of an API lens system designed by the pinhole leak. The buffer gas region is the space between the Extrel, a quadrupole mass filter with 0.95-cm-diameter rods 20 extraction plate and the pinhole leak through which the drift gas cm in length, and an electron multiplier (model 051-72) and is introduced. One intention of this arrangement is to disrupt preamplifier equipped with current amplification and ion-counting the diffusion layer around the pinhole leak and to keep the leak capability. The maximum m/z for our rods and power supply was clean and free from clogging. The 40-µm-diameter pinhole serves 800. For these studies, the stock preamplifier was replaced with as the barrier between the atmospheric pressure of the drift tube a Keithley 427 amplifier (Keithley Instruments, Cleveland, OH) and the vacuum of the mass spectrometer, while allowing a narrow and the amplified signal sent to the data acquisition system, which ion beam to enter. Beyond the pinhole is the adiabatic expansion was constructed at WSU. A detailed description of the IMS control region where excess drift gas is pumped away and a sufficient and data acquisition system can be found in ref 12. electric field is maintained on the ions to prevent clustering or General Operating Conditions. The electrospray ionization fragmentation. From the adiabatic expansion region, the ions are source was normally operated with a potential difference of 4000 first drawn into a space bounded by a cylindrical screen and then V between the needle tip and the focus screen. The focus screen focused through an einzel lens system into a quadrupole mass served to define the initial potential of the ion mobility desolvation filter. region and drift tube. The potential on the screen was normally As shown on Figure 1, a metal carrier for the pinhole leak of 5500 V while the potential on the spray needle was 9500 V. the interface is mounted on a 16-cm-o.d. flange using a custom Samples were normally introduced into the spray needle with a design metal-glass seal (fabricated from two standard metal- solvent system composed of 47.5% water, 47.5% methanol, and 5% glass seals by Larson Electronic Glass, Redwood City, CA). This acetic acid. The solvent flow through the needle was controlled metal-glass seal serves as an expansion joint for the varying at 5 µL/min. The cooling water and gas flows were 55 and 630 temperature gradient between the drift tube and the rest of the mL/min, respectively, and were held at 19 and 25 °C, respectively. 4932 Analytical Chemistry, Vol. 70, No. 23, December 1, 1998
  • 5. Table 1. Operating Conditions drift gas flow rate 800 mL/min (N2) sample flow rate 5 µL/min (CH3OH:H2O:CH3- COOH ) 47.5:47.5:5) electrospray potential 9500 V focus screen potential 5500 V desolvation field 280 V/cm drift field 280 V/cm reference potential for ion entrance gate 3625 V entrance gate closure potential (37 V reference potential for ion exit gate 628 V exit gate closure potential (28 V extraction plate potential 251 V pinhole leak potential 7.9 V ion optics potentials 7.9, -4.9, -20.1, -7.4, -99.9, -23.2 V internal chamber pressure 1.5 × 10⁻⁵ Torr external chamber pressure 2.2 × 10⁻⁴ Torr Figure 2. Drift time as a function of inverse drift voltage. Drift time was measured on ion mobility spectra of doubly and triply charged bradykinin ions created by electrospray ionization. The electric field was maintained at 280 V/cm throughout the desolvation region and the ion drift region. A counterflow of heated, dry nitrogen drift gas was introduced between the extraction plate and the pinhole leak. This drift gas was preheated and introduced at a flow rate of 800 mL/min. In these experi- ments, no diluent gas for the desolvation region was introduced. The drift gas was normally heated to 250 °C and the drift tube pressure was at ∼700 Torr measured for each individual experi- ment. The ion optics of the MS system consisted of six elements with potentials of +7.9 (pinhole), -4.9 (screen), -20.1 (first element of einzel), -7.4 (second element of einzel), -99.9 (third element of einzel), and -23.2 (ELFS plate) V in order of the ion migration direction. The 1.2-MHz quadrupole mass filter was biased at -5.2 V. The electron multiplier was operated at potential of 1.75 kV, and the collision dynode at -4 kV. These and other operating conditions are summarized in Table 1. Unless specified otherwise, the conditions listed in this table were used for all experiments described in this paper. Test Compounds. Peptides and proteins (Sigma, St. Louis, MO) were used in this study without further purification and were dissolved in electrospray solvents with concentrations in the 10-5 to 10-4 M range. The solvent methanol, water, and acetic acid were HPLC grade reagents (J. T. Baker, Phillipsburg, NJ). Morphine standard in methanol (Supelco Inc., Bellefonte, PA) was diluted with mobile phase as needed. RESULTS AND DISCUSSION Figure 3. Ion mobility spectrum of dynorphin a fragment 1-7 with Figure 2 shows the relation between drift time and 1/V for mass-identified ions. doubly and triply charged positive ions of bradykinin, with drift voltages in the range 2307-3625 V. The solid lines are linear defined mobilities when they traveled through the drift region, least-squares fits to the experimental data. In these plots, the slope confirming that the desolvation process was complete before the of the line is the ratio of the drift length squared to the ion ions exited the desolvation region. mobility, and the intercept measures the time an ion spends Figure 3 shows data typical of the ESI-IMS-MS instrument traveling from the pinhole at the end of the drift region to the constructed for this project. The three spectra in this figure were particle multiplier. For both doubly and triply charged ions, the produced from electrospray ionization of the peptide dynorphin intercept is close to zero, indicating that the time for ions to drift A 1-7 (MW ) 867). The lower tracing is an ion mobility through the adiabatic expansion region and mass analyzer is spectrum of all ions produced in the electrospray process with a negligible compared to drift time under our operating conditions. molecular mass larger than 250 Da. This spectrum was obtained A similar result was reported in previous IMS-MS experiments.1 by pulsing the entrance gate open for 0.2 ms at a frequency of 20 In addition, the linearity of the plots indicates both ions had well- Hz, holding the exit gate of the ion mobility spectrometer open Analytical Chemistry, Vol. 70, No. 23, December 1, 1998 4933
  • 6. Table 2. Drift Time and Peak Width Data for Dynorphin with drift times of 20.5 and 21.2 ms shown in the lower trace of A Using tg ) 0.2 ms Figure 3. The smaller of these two peaks was found to have m/z ) 443, 8 Da greater than the m/z 435 measured for the larger (M ion charge td (ms) w (ms) R Rd (calc) + 2H)2+ peak. The mass identifications confirm that these really +1 37.5 0.66 57 85 are two different species, with mobilities differing by ∼3%, that +2 20.5 0.29 71 120 +3 17.3 0.22 78 147 have been near baseline resolved by this IMS instrument, a condition we have never been able to achieve before with similar drift tubes. Incidentally, from the separation of these two peaks it might be reasoned that the mass dispersion of the IMS is 0.6 continuously, and using the mass spectrometer as a high-pass filter ms/8 Da ) 0.08 ms/Da. The corresponding width in daltons for so that only ions with a mass greater than 250 Da would be the peak at 20.5 ms would be (20.5 ms)/(57 × 0.08 ms/Da) ) detected by the electron multiplier. Under these conditions, ions 4.5 Da, and the resolving power from the 20.5-ms peak calculated with an m/z greater than 800 can be detected, even though the on a mass basis would be 435/4.5 ) 97. The fact that this “mass” mass identification range of the quadrupole used in these experi- resolving power and the mobility resolving power do not agree is ments was limited to 800 Da. another reminder that mass and mobility cannot be directly The peak at 37.5 ms is thought to be the singly protonated compared. Because ion mobility separations are based on the peptide (M + H)+ with m/z ) 868, although this ion could not size and shape of ions, rather than mass (mass is important only be mass identified due to the 800-Da limit of our quadrupole. Mass in that it changes the size of the ion), it is clearly absurd to identification of the doubly and triply charged ion species, measure the resolving power of an ion mobility spectrometer in however, was possible. The middle tracing in Figure 3 was terms of mass. obtained by setting the mass spectrometer to pass m/z ) 290, The identities assigned to these two ions were (M + 2H)2+ while the ion mobility spectrometer operated in the same manner for the peak at 20.5 ms as discussed above and (M + O + 2H)2+ used for the lower tracing. The single peak with a drift time of for the peak at 21.2 ms. The assignment of an oxygen adduct to 17.3 ms matches the peak of highest mobility in the nonselective an electrosprayed ion is reasonable and has been noted previ- spectrum shown in the lower tracing and is believed to be the ously.28 One explanation for the presence of (M + O + nH)n+ triply protonated peptide (M + 3H)3+ with m/z ) (867 + 3)/3 ) ions when proteins or peptides are electrosprayed into mass 290. Similarly, the upper tracing in Figure 3 was obtained by spectrometers is that a corona discharge is present at the setting the mass spectrometer to pass m/z ) 435. The single electrospray emitter tip. Alternatively, species may be oxidized peak at 20.5 ms corresponds to the most intense peak in the lower in solution by electrolysis in the electrospray needle. Through trace and is identified as a doubly protonated peptide (M + 2H)2+ variation of solvent flow and emitter tip potential, it may be possible with m/z ) (867 + 2)/2 ) 434.5. This is the first time multiply to eliminate the formation of this adduct and/or to elucidate its charged ions have been mass identified for atmospheric pressure formation mechanism. ion mobility spectrometry. To systematically examine the resolving power of the ESI- Drift time and peak width data for the +1, +2, and +3 peptide IMS-MS system, a number of interrelated factors must be ions of Figure 3 are summarized in Table 2. If all three peptides considered: initial pulse width, electric field homogeneity, ion had the same collision cross section, then the ratio of drift times detection, Coulombic repulsion, ion statistics, ion-molecule for the +1/+2, +1/+3, and +2/+3 species would be 2, 3, and reactions, ion desolvation and temperature, analyte concentration, 1.5, respectively. That the measured ratios are 1.8, 2.1, and 1.2, and ionic charge. respectively, indicates that the collision cross section increases Initial Pulse Width. Other than diffusion, the single most as protons are added to the peptide, with a particularly striking important contributor to IMS peak width is the initial width of increase as a third proton is added to the (M + 2H)2+ species. the pulse. It is also the least interesting, as we know from the Perhaps this is due to a strong repulsion of charges located on beginning how we must handle it: for highest possible R, use the two terminal arginine residues. the lowest possible tg that produces a sufficiently strong signal. The measured resolving power of the ion mobility spectrom- Decreases of S/N with decreasing pulse width were observed. eter for the three peptide ions (see Table 2) is quite striking and When initial pulse widths less than 0.05 ms were used, the signal entirely typical of what we observe with this apparatus. Generally became too weak to detect. This cutoff probably occurs because speaking, this device shows resolving power of ∼2× or better, 0.05 ms is about the time required for an ion to pass completely compared to what we have come to expect for IMS instruments through the region where the gate closure field significantly of similar dimensions and operating conditions. For comparison, perturbs the drift field. Table 2 shows Rd, the diffusion-limited maximum resolving power, To understand the improved resolving power of the present predicted from eq 4 for these three peptide ions. As we discuss ESI-IMS-MS, we want to remove the effects of the initial pulse further below, for very narrow initial pulse widths we have width and consider the remaining “impulse response” of the IMS frequently measured R values greater than Rd. We do not take to an infinitely narrow initial ion pulse. Data to accomplish this this to mean that we have defeated diffusion, but rather to indicate are summarized in Table 3. It contains four studies of peak width that the actual resolving power of this device is close enough to for the (MH)+ ion for two different concentrations of histidine (1 the theoretical limit that the noise statistics of our measurements and 0.1 mg/mL), measured by either nonselective monitoring yield results above the maximum with fairly high frequency. A practical consequence of increased resolving power is the (28) Morand, K.; Talbo, G.; Mann, M. Rapid Comm. Mass Spectrom. 1993, 7, ability to separate closely spaced peaks, such as the two peaks 738. 4934 Analytical Chemistry, Vol. 70, No. 23, December 1, 1998
  • 7. Table 3. Histidine (M + H)+ Peak Width Measured by Selected Ion Monitoring (SIM) and Nonselective Monitoring (NS) as a Function of Applied Pulse Width C tg td wd (mg/mL) mode (ms) (ms) w ( σ (ms) R(σ (w2 - tg2)1/2 (ms) β 1.0 NS 0.05 13.65 0.193 ( 0.037 71 ( 14 0.19 0.20 1.18 0.10 13.63 0.242 ( 0.006 56 ( 1 0.22 0.20 13.61 0.304 ( 0.011 45 ( 2 0.23 0.40 13.71 0.479 ( 0.022 29 ( 1 0.26 1.0 SIM 0.05 13.67 0.188 ( 0.026 73 ( 11 0.18 0.16 1.49 0.10 13.62 0.217 ( 0.026 63 ( 8 0.19 0.20 13.61 0.276 ( 0.008 49 ( 1 0.19 0.40 13.64 0.516 ( 0.027 26 ( 1 0.33 0.1 NS 0.05 13.76 0.151 ( 0.012 91 ( 7 0.14 0.14 1.37 0.10 13.74 0.184 ( 0.019 75 ( 7 0.16 0.20 13.70 0.274 ( 0.014 50 ( 3 0.19 0.40 13.74 0.489 ( 0.013 28 ( 1 0.28 0.1 SIM 0.05 a a a a 0.11 1.39 0.10 13.77 0.144 ( 0.013 96 ( 9 0.10 0.20 13.69 0.271 ( 0.017 50 ( 3 0.18 0.40 13.79 0.483 ( 0.056 29 ( 3 0.27 a Signal too weak to measure. (m/z >150, NS) or selective monitoring of the molecular ion (m/z essentially ideal diffusion-limited behavior from this IMS device ) 156, SIM). For each of four tg values, quadruplicate measure- when the effects of initial pulse width and Coulombic repulsion ments of w yielded an average width and standard deviation. are removed. In terms of the analysis of eq 4 and ref 24 for this Although it is tempting to use eq 2 and subtract the effect of the IMS essentially γ ) 0 s2 and R)1.0 × 10⁻³ V/K. If ref 24 was initial width from the measured width to get a “diffusion-only” correct in concluding that the R values of the real IMS devices width, (w2 - tg2)1/2, this approach fails since (w2 - tg2)1/2 varies studied were 20-50% higher than ideal because of electric field with tg (see Table 3). inhomogeneity, we must conclude that the ESI-IMS-MS of this One reason for the dependence of (w2 - tg2)1/2 on tg is that study has a nearly perfectly homogeneous electric field. Similarly the initial pulse is not Gaussian in shape and its width depends if γ values greater than zero can be accounted for by slow collector on ion distribution across a closed gate. Although, of course, the and amplifier rise times in the devices studied in ref 24 then the electronic timing of the signal applied to the gate is known, the present device must be faster in its response. temporal profile of the ion pulse admitted to the drift tube is greatly Electric Field Homogeneity. Past attempts to the create influenced by the details of the interaction between the ion stream homogeneous drift fields have included increasing the diameter and the physical components of the gate. The ion stream is of the drift tube, increasing the number of drift rings per unit depleted of ions immediately upstream of the gate due to the distance, and coating the inside of the tube with a resistive paint, action of the closure field (the “gate depletion” effect), and this creating a continuous voltage gradient. None of these approaches disruption extends about as far upstream in the drift tube as the have resulted in high-resolution ion mobility spectrometry. In the separation distance of the gate wires. A similar effect of closing present ESI-IMS-MS device, it seems clear that the ions con- the gate reduces ion density in the trailing edges of ion pulses tributing to the observed spectra experience not necessarily an admitted to the drift tube. The actual magnitude and spatial profile electric field of superior homogeneity but what is just as good for of this depletion will be different for ions of different mobility. maintaining narrow peaks: they experience nearly the same Another contributor to our uncertainty about peak shape is electric field. Only those ions which pass through the 40-µm- Coulombic repulsion, which broadens the initial pulse to an extent pinhole contribute to the signal, and if the trajectories of these that increases with ion density, mobility, and applied initial pulse ions are traced backward to their points of origin in the plane of width. the gate, we would find that ∼67% of them come from an ∼1.5- Because of these effects, we cannot know the true initial pulse mm-diameter circle at the center of the gate. This follows because width, and the best approach is to plot w2 vs tg2 for several values an initially infinitely thin disk of ions that spends 13.7 ms drifting of tg.24 Extrapolation of the nearly linear plot to tg2 ) 0 yields the through a 13-cm drift tube, diffusing to become a plug with diffusion-only width, wd, as the square root of the y intercept. This temporal width of 0.16 ms at half-maximum, has a spatial thickness extrapolation eliminates not only the pulse width but also the of 0.16 ms(13 cm/13.7 ms) ) 0.15 cm. Since the ions have nearly effects of mutual Coulombic repulsion. In fact, the slope of the the same transverse diffusion coefficient as longitudinal, the plot (the β of eq 5) is a measure of broadening due to Coulombic origins of the ions passing through the 0.040-mm pinhole, of repulsion. This linear regression was performed for each of the negligible size compared to the 1.5-mm diffusion width, would sets of data in Table 3. The wd and β values are given in the be described as a Gaussian distribution of width 1.5 mm at half- table. maximum in the plane of the gate. Having a small plug of ions The values of wd given in Table 3 should be compared with that travels through a narrow corridor in the most homogeneous the diffusion-limited peak width of 0.16 ms calculated from eq 4 central part of the electric field to reach the pinhole and contribute for an ion of drift time 13.75 ms. We appear to be seeing to our signal should be contrasted to ordinary circumstances in Analytical Chemistry, Vol. 70, No. 23, December 1, 1998 4935
  • 8. spectrometer. This change may be the source of improvement in γ. Coulombic Repulsion. The average β () 1.36) for the four sets of experiments summarized in Table 3 is somewhat higher than the 1.1-1.3 range from ref 24. This may be the result of increased Coulombic broadening due to the higher ion currents of our ESI source compared to the 63Ni sources of the reference. It is then somewhat surprising that the 1.0 mg/mL experiments have an average β ) 1.34, nearly the same as the β ) 1.38 of the lower concentration 0.1 mg/mL experiments. This lack of dependence of β on analyte concentration suggests that the additional broadening might be the result of higher concentration of solvent-derived ions, in which case the broadening would have Figure 4. Simion plot of ion drift tube-mass spectrometer interface. to occur during the first few milliseconds after a pulse is admitted Potential contour interval is 25 V. The distance between last electrode to the drift tube, before the solvent and analyte ions become to pinhole inlet was 3 mm. separated. This situation could be clarified by a more exhaustive study with a wider range of concentrations. Ion Statistics and Anomalously High Resolution. Table 3 which an ion pulse nearly as wide as the drift tube is gathered on contains two R values higher than Rd, and the wd values for the a collector of similar width. This is probably the main source of 0.1 mg/mL samples are both below the 0.16-ms diffusion limit. improvement in our resolution compared to ordinary IMS. While these results are statistically not exceedingly unlikely, and Ion Detection. People have used a direct pinhole interface we certainly do not wish to challenge eq 2, we still have between IMS and MS for years without noting resolving power encountered anomalously high R values often enough with the as high as ours,29 and one wonders at the reason for this. It is ESI-IMS-MS apparatus, especially with low analyte concentration certainly not a result of our electrospray ion source. It may be and/or low initial pulse widths, to spend some time trying to think that the electronics of earlier systems have simply been too slow of ways that falsely narrow peak widths could be obtained. The to observe improved resolution. It may also be that highly only possibility that has not been discarded as untenable is attractive potentials used to increase the number of ions drawn statistically inadequate sampling of the single ion pulses which through the pinhole have distorted and broadened the ion pulse. comprise our signal. Our design keeps the equipotentials fairly flat right up to the A typical weak IMS pulse might consist of 104 ions ((10-pA pinhole, as may be seen in Figure 4. peak current × 0.2-ms peak width)/1.6 × 10-19 C ion-1), while it On the related matter of our apparatus having a γ close to 0, seems unlikely that the 40-µm pinhole has an ion-transfer ef- this is certainly not the result of amplifier characteristics since ficiency greater than 10-5 (pinhole area/ion beam area = (4 × the ESI-IMS-MS uses the same type of amplifier (with a 0.1-ms 10-3cm)2/(1.25 cm)2). Then the most intense IMS peaks (say 10-90% rise time) that has been used for all our applications in 106 ions) will transfer ∼10 ions into the mass spectrometer, while recent years. However, our design does eliminate the aperture the weakest peaks might produce one ion or less in 10 trials. Each grid. Traditionally, IMS detection has been accomplished with a ion striking the multiplier of the mass spectrometer produces a Faraday plate shielded by an open wire structure called an current spike containing ∼106 electrons and lasting a few tens of aperture grid located 0.5-1 mm ahead of the plate. Without the nanoseconds, and the amplifier with its 0.1-ms 10-90% rise time aperture grid, an ion pulse approaching the collector plate induces at 109V/A gain converts this spike into a ∼0.1 V pulse ∼0.2 ms a current well before the pulse actually reaches the plate, wide. To measure peak widths correctly we must average enough broadening peaks significantly. The aperture grid shields the of these single-ion pulses to adequately represent the ion spatial collector electrode from the incoming ion packet. To minimize distribution in the IMS tube. It may be that for some weak signals pulse broadening, the distance between the aperture grid and we have used ion samples that are too small or rejected as “noisy” collector should be as small as possible while the field between some of the outliers in our data and thereby underestimated the the two is as large as possible without distorting the drift field. widths of these small peaks. Unfortunately, the shorter the distance between the grid and the Ion-Molecule Reactions. The diffusion-limited peak widths collector or the larger the potential difference between the grid in Table 3 are slightly narrower for the SIM data than for the and the collector, the more sensitive is the collector to vibrational corresponding nonselective data. Although one of our purposes variations in the grid-collector distance. These variations lead in using a countercurrent flow of drift gas is to reduce penetration to increased baseline noise in the detector. Thus, a compromise of the drift region by neutral molecules of sample and solvent, of conditions between those that produce acceptable baseline noise the wider peaks for the nonselective cases may be the result of and those that produce acceptable pulse broadening is required, ion-molecule reactions in the drift space. A neutral molecule, I, and in the optimum case, the inductive response of the collector can react reversibly with an analyte M+ to form an adduct or probably begins ∼0.1 ms ahead of the arrival of the ion packet. capture charge In the present design, the need for an aperture grid is eliminated since the ions are detected by the electron multiplier of the mass M+ + I S MI+ and/or M+ + I S M + I+ (6) (29) Karpas, Z.; Stimac, R. M.; Rappoport, Z. Int. J. Mass Spectrom. Ion Processes 1988, 83, 163. If a peak composed mainly of M+ also contains ions such as I+ 4936 Analytical Chemistry, Vol. 70, No. 23, December 1, 1998
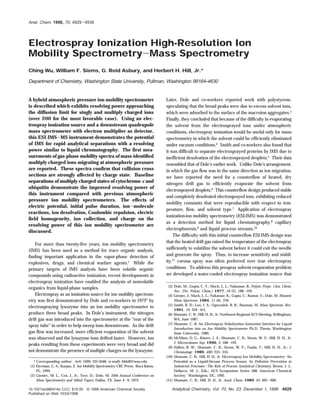
  • 9. Figure 6. Measured ion mobility resolution of amphetamine, cocaine, and morphine under different sample concentration with Figure 5. Ion mobility spectra of electrospray solvent under different mass selective detection: electrospray solvent, 49.5% water, 49.5% temperatures: A, 100, B, 150, C, 200, D, 250 °C. methanol, and 1% acetic acid. and MI+, having mobilities either less or greater than M+, it is repulsion with the greater ion density of the more concentrated clear that the peak will be broadened relative to a peak composed samples, the coincidence of the β values argues against this. More of pure M+. If the forward and reverse reactions of eq 6 are rapid extensive examination of this situation is needed. In a related relative to the mobility experiment, then selective detection will study, Figure 6 shows resolution as a function of analyte have no effect on peak width since the relative ionic composition concentration for cocaine, amphetamine and morphine with will be uniform across the whole peak. However, if the reaction concentrations ranging from 1 to 1000 µg/mL. A constant tg of rates are on the same order as or slower than the mobility 0.2 ms was used for these SIM measurements, and since lower experiment, then the leading edge of the peak will accumulate concentrations of the sample produce a lower charge density in ions more mobile than M+ while the trailing edge will have a the migrating ion pulse, the low concentrations are expected to higher proportion of ions lower in mobility than M+ in comparison show higher resolving power if Coulombic repulsion is important. to the central portion of the peak. In this case, mass selective The figure shows this is indeed the case. The overall lower detection will not record these ions in the leading and trailing resolving power for amphetamine is probably the result of the edges of the peak, and the measured width will be less than with shorter drift time for this analyte (13.36 ms vs 19.31 ms for cocaine nonselective detection. and 18.33 ms for morphine), resulting in a greater relative Desolvation and Temperature. According to eq 3, lowering contribution of tg to the total peak width. For all three analytes, the drift tube temperature is an effective means to increase the at concentrations less than 100 µg/mL resolution increases resolving power of an ion mobility spectrometer. On the other greatly, and in fact, for the lowest two concentrations of cocaine hand, we rely on the high temperature of the countercurrent drift and morphine, R is above the diffusion limit. This rapid decrease gas to supply the heat needed to desolvate analyte ions, so it is in peak width at the lowest concentrations is contrary to what important to operate our system at the lowest temperature that would be expected from Coulombic repulsion, since the repulsive will accomplish this. Figure 5 compares ion mobility spectra of force becomes less and approaches zero as the absolute charge solvent ions obtained at four different temperatures. At 100 °C, density approaches zero. These low-concentration results are poorly resolved peak clusters are observed at 16.6 (major), 18.2, possibly due to inadequate sampling of the very weak signals, as 19.7, and 21.9 ms. As the drift gas temperature is increased to discussed above. Whatever the explanation of these lowest 250 °C, these peaks become better resolved and move to faster concentration results, for best resolution it appears that the IMS drift times, presumably as the number of clustered solvent ions should be operated at the lowest ion currents possible. decreases. In the 250 °C spectrum, the two major ions were mass Ionic Charge. From eqs 3 and 4, we see that the diffusion- identified as m/z ) 19 (7.5 ms, H3O+) and ) 75 (10.1 ms, C3H7O2+, limited resolving power increases with the square root of the protonated methyl acetate). As suggested by this study, we found number of charges on the ion. Multiple charging of compounds that complete desolvation of analyte ions required a drift tube by electrospray ionization is common, with 30 charges or more temperature of 250 °C. reported for some proteins. The combination of multiple charges Analyte Concentration. Note that the wd values in Table 3 and large collision cross sections with low analyte concentration for the 1.0 mg/mL experiments are slightly greater than the and the other characteristics of our ESI-IMS-MS have acted in corresponding values for the 0.1 mg/mL samples. Although it is concert to produce the highly resolved ion spectra of two proteins, tempting to attribute this observation to additional Coulombic cytochrome c and ubiquitin, shown in Figure 7. Analytical Chemistry, Vol. 70, No. 23, December 1, 1998 4937
  • 10. we would need to find another way to supply heat of vaporization directly to the ESI droplets. Second, resolving power could be increased by increasing the total drift voltage. As discussed in the introduction, to increase resolving power by increasing V it is also necessary to increase tube length to remain in the low- field regime. In this connection it should be noted that Spangler has recently reported that, while ion velocity will no longer be proportional to the strength of the electric field, high-field conditions may further increase the resolving power of IMS.30 Moreover, high-field conditions may vary the separation factor between ions. Separa- tion factor R′ is defined here for the ion mobility spectrometer in a manner similar to that used in chromatography: R′ ) K1/K2 ) v1/v2 (7) Where v1 and K1 are the ion velocity and mobility of the ion with the fastest drift time and v2 and K2 are the ion velocity and mobility of the ion with the longest drift time, respectively. For low-field conditions R′ is constant, but for high-field conditions R′ becomes a function of the electric field strength. While there has not been much published on ion mobility under high-field strength Figure 7. Ion mobility spectra of cytochrome c and ubiquitins conditions, the transverse ion mobility spectrometer uses this separation of multiply charged ions. phenomenon to maximize separation between two ions.31 For time-of-flight IMS, however, more investigation is required to test the usefulness of high E fields for increasing resolution. The numbers above each peak or peak cluster indicate the Ion mobility spectrometry, originally known as plasma chro- charge state of that peak or cluster. For example, the peak in matography and touted as a poor man’s mass spectrometer, has, the cytochrome c spectrum with a drift time of 28.7 ms was mass over the years, proved not to have sufficient resolving power to identified to be the (M + 17H)17+ ion. The resolving power that serve as a replacement for chromatography much less mass was calculated from this ion was 120. The highest resolving power spectrometry. In fact, the resolving power of atmospheric pres- calculated from this spectrum was from the peak located at a drift sure ion mobility spectrometers has been so low that IMS has time of 36.7 ms. Identified as the (M + 11H)11+ ion, the resolving primarily been useful only as a selective detection device after power was determined to be 216. Note the baseline separation high-resolution chromatography. Thus, with the improvements of each charge state. in resolving power reported in this work, IMS appears poised to become a separation method in its on right, providing orthogonal CONCLUSIONS separation data that complements rather than competes with those The improved resolving power exhibited by our ESI-IMS-MS obtained with both chromatography and mass spectrometry. appears to be due mainly to improved electric field homogeneity and detection speed, with contributions from selective ion moni- ACKNOWLEDGMENT toring and the tendency of target analytes appropriate for ESI to The authors thank Dr. Glen Spangler for his initial advice in have long drift times and multicharged ions. For low concentra- constructing the IMS-MS instrument and Dr. Gary Van Berkelfor tions and very narrow gate widths we have often noted anoma- discussions on the electrospray process. This project was sup- lously high resolving power, possibly because of very small ion ported in part by the Washington State University Drug Abuse samples. We are certainly at the very limit of rise time possible Program, the Federal Aviation Administration Grant 97G009, and with our electrometer amplifier and should probably change to a Research Fellowship for C.W. provided by STEC, Inc., Japan. time-to-digital conversion for these very weak signals. This paper was presented in part at the 45th ASMS Conference There are two main avenues to further improve the resolving on Mass Spectrometry and Allied Topics, Palm Springs, CA, June power of our apparatus. Operating the drift tube at much lower 1997. temperatures could greatly increase resolving power, although Received for review April 13, 1998. Accepted August 7, (30) Spangler, G. E. Fifth International IMS Workshop, Jackson, WY, 1996. 1998. (31) Buryakov, I. A.; Krylov, E. V.; Nazarov, E. G.; Rasulev, U. Kh. Int. J. Mass Spectrom. Ion Processes 1993, 128, 143. AC980414Z 4938 Analytical Chemistry, Vol. 70, No. 23, December 1, 1998