SlideShare une entreprise Scribd logo
1  sur  4
With gold sitting very close to all-time nominal highs, we thought you might like the
    following points on what drives gold's movement.

    "What drives gold?" Among the factors: Real interest rates, central bank balance sheets,
    Indian wedding season, and the Aussie dollar.


Has Gold Unwound its Overbought Status?

One of the biggest questions being written about which is on traders and analysts minds is
whether Gold has moved into bubble territory and is about to start a major reversal, or is going
to keep on truckin’ Blind Boy Fuller style. While my fundamental hat suggests it’s likely to
continue its trend (as a hedge against bad govt’s), being a quantitative price action and ichimoku
trader, I have to see what the technical picture is communicating.

For looking at whether a market is in an extreme phase and is set to reverse, we often look
towards our weekly 20EMA spread. This model plots the distance from the weekly closing price
to the 20EMA as a gauge of market extremes or whether the trend is likely to continue. If a
market is at an extreme level, it usually has a very large spread from the 20EMA. Any abnormal
spread from the 20EMA is likely to return to the 20EMA.

Looking at the chart below, you are seeing the weekly chart on Gold over the last 6 years. In this
chart, you can see price’s movement and its relationship to the 20EMA, along with the lower
indicator/model representing the spread between the week’s closing price and the 20EMA.


We have highlighted the key peaks which generally occurred around a 1258 reading, or price
having $125.8 price spread from the weekly closing price to the 20EMA. This generally led to a
pullback minimally to the 20EMA within an average of 4 weeks and a maximum of 10. We
would like to note that historically, since April of 2005, Gold has spent only 43 weeks below the
20EMA (closing basis) out of 541 for a total of 8% of the time, statistically displaying its tendency
to trend upward. It also means should Gold break below the 20EMA, the chances of price
staying below it for extended periods of time are unlikely.

What we do have to note is the most recent parabolic run away from the 20EMA created an
abnormal spike never before seen in history with a reading of 2718 or price closing $271.8 away
from the 20EMA. So the next logical question becomes what do we make of this and is it the
end of this massive uptrend?

Our view is this is unlikely, considering the historical relationship to the 20EMA as noted before
(8% of time below). In fact, we may consider a pullback to the 20EMA to be a healthy thing as it
will put Gold through a re-distribution phase and allow the order flows behind it to start another
run higher.

But, the extreme nature of this suggests price is likely to pullback to the 20ema within the next
2mos or by year end. Across most instruments, price rarely has this kind of extreme or unstable
relationship to the 20EMA and usually means the orders behind such movements have to
normalize a bit before starting another run. Keep in mind, this does not have to happen with a
violent sell-off and could be the result of price hanging around the $1700-$1900 range while
the 20EMA catches up to current price levels.

In fact, to add any new positions, we’d rather wait to let the spread normalize and move back
into the prior range which suggested a very healthy trend.

We also do have to add to the bullish prospects how price had one of its biggest weekly drops
from an open of $1860.92, to an all-time high of $1911.89, then shedding $209 to the weekly
$1702 low to do what??? Bounce strongly and end the week at $1827. This is highly
suggestive of how the buyers were ready to stand up to one of the most violent and largest %
based weekly sell-offs and send the metal within roughly $40 or 2% of where it opened the
week.

Thus, although the short-term price structure may suggest consolidation or mild pullback to the
20EMA, our medium and long term technical view is still strongly bullish


The higher they go the harder they'll crash: when gold goes hyperbolic as now, it's a bubble.
Issue is at which level it crashes? 3K, 4K...? A Tale of Two Bubbles: attached a Gold vs Nasdaq
Chart, time adjusted. Courtesy of Reuters
Question for gold bugs: How much of gold long positions are financed now, as Nasdaq was in
late '90s, with leverage? Do CME data show that? Of course a bubble doesn't mean you should
stop buying. Roubini said earlier this week that rising uncertainty supports gold: “That’s the
mentality that leads gold to be at $1,800 (an ounce) or above. So gold, because of that, can go
higher."

Yesterday Wells Fargo compared gold to past bubbles and came up with a different conclusion:
"In the five years prior to their respective peaks, the NASDAQ rose 500 percent and oil rose 340
percent. Over the last five years, gold has not seen nearly the trajectory of increase, rising only
about 200 percent. Thus, based on this metric, gold does not yet appear to be in a bubble à la
the NASDAQ in 2000 or oil in 2008. However, the 200 percent five-year increase has risen from
150 percent in our April report

“Real Gold Price Still Below Record, but Just Barely
The real gold price has not yet reached the high of about $1,952/ounce at today’s prices seen in
January 1980, but it is very close. In addition, prices have gone “parabolic,” meaning they have
risen by an extraordinary amount in a very short period of time. When asset prices go parabolic,
they usually do not stay at those levels very long and often see a quick reversal. Thus, it is
possible we could see a near-term pullback in gold based on this technical pattern. However,
based on the aforementioned factors driving gold’s meteoric rise, the pullback may not be very
large and will probably not last very long before gold prices start to rise again.

Gold Still Hasn’t Risen as Much or as Fast as NASDAQ or Oil
In the five years prior to their respective peaks, the NASDAQ rose 500 percent and oil rose 340
percent. Over the last five years, gold has not seen nearly the trajectory of increase, rising only
about 200 percent. Thus, based on this metric, gold does not yet appear to be in a bubble à la
the NASDAQ in 2000 or oil in 2008. However, the 200 percent five-year increase has risen from
150 percent in our April report.

Gold-Oil Price Ratio Above Average, but Not Unprecedented
While gold has soared, oil has dropped to around $84/barrel amid growing concerns about
slowing global growth. As such, the gold-oil ratio has jumped to 22.4, well above the historical
average of 15.5 but certainly not unprecedented. Furthermore, just because the ratio is above-
average does not necessarily mean gold is overvalued or oil is undervalued. At this time, both
the jump in gold prices and the plunge in oil prices appear to be justified by fundamentals. This
ratio may decline a bit in the coming weeks, but we do not foresee an outright crash in gold
prices


I want to say that should the SNB choose to set up a Peg it will not work. It will end with a
staggering explosion. I can’t see a “solution” in Europe. Germany will not “Federalize” the debts
of the peripheral states. Therefore the problems will not go away. The risks to Italy and France
will grow as a result. As that happens, capital will have to move in the direction of Switzerland.
That is always how this has worked in Europe. The SNB may buy some time with their Peg and
force scared money into gold. But sooner or later the money will flow to Switzerland. This is
especially true given that the SNB will be subsidizing the price of the Franc for that hot money.

Should we go down that road the SNB could be forced to absorb 300 billion Euros. The losses on
those holding could be staggering for a small economy like Switzerland What happens if there
were to be a peg? Two shorter-term outcomes that I can think of:The CHF is the “go to” safe
have. But not if they peg themselves to the Euro. Some of the money that is currently parked
LONG TERM in Switzerland will leave. (I think a lot of the short term hot money has found the
exit by now). Where will those long term seekers of of a safe haven go, now that it ain’t so safe?
There is only one option, gold. That is especially true for those who have Swiss Francs in the
first place. They all love gold. Now they will have to love it more.

The next time there is a crisis on the table where will the money go? Not the Swissie. That
would be a dead end. So the rest of the hot money will have less of a place to go. Once again it
points to gold.


ShamikBhose@yahoo.com

Contenu connexe

En vedette

A Crude Oil Overview Part 2 Summer 2012
A Crude Oil  Overview Part 2 Summer 2012A Crude Oil  Overview Part 2 Summer 2012
A Crude Oil Overview Part 2 Summer 2012Shamik Bhose
 
Shamik On Gold & Silver Breakout
Shamik On Gold & Silver BreakoutShamik On Gold & Silver Breakout
Shamik On Gold & Silver BreakoutShamik Bhose
 
Commodity Wealth Creation
Commodity Wealth CreationCommodity Wealth Creation
Commodity Wealth CreationShamik Bhose
 
Shamik 0n Yasni Google
Shamik 0n Yasni GoogleShamik 0n Yasni Google
Shamik 0n Yasni GoogleShamik Bhose
 
Indian Groundwater Crisis
Indian Groundwater CrisisIndian Groundwater Crisis
Indian Groundwater CrisisShamik Bhose
 
Shamik Gold Standard & Reasons 2011 Sept
Shamik Gold Standard & Reasons 2011 SeptShamik Gold Standard & Reasons 2011 Sept
Shamik Gold Standard & Reasons 2011 SeptShamik Bhose
 

En vedette (6)

A Crude Oil Overview Part 2 Summer 2012
A Crude Oil  Overview Part 2 Summer 2012A Crude Oil  Overview Part 2 Summer 2012
A Crude Oil Overview Part 2 Summer 2012
 
Shamik On Gold & Silver Breakout
Shamik On Gold & Silver BreakoutShamik On Gold & Silver Breakout
Shamik On Gold & Silver Breakout
 
Commodity Wealth Creation
Commodity Wealth CreationCommodity Wealth Creation
Commodity Wealth Creation
 
Shamik 0n Yasni Google
Shamik 0n Yasni GoogleShamik 0n Yasni Google
Shamik 0n Yasni Google
 
Indian Groundwater Crisis
Indian Groundwater CrisisIndian Groundwater Crisis
Indian Groundwater Crisis
 
Shamik Gold Standard & Reasons 2011 Sept
Shamik Gold Standard & Reasons 2011 SeptShamik Gold Standard & Reasons 2011 Sept
Shamik Gold Standard & Reasons 2011 Sept
 

Plus de Shamik Bhose

Shamik On Gold & Etf Presentation
Shamik On Gold & Etf PresentationShamik On Gold & Etf Presentation
Shamik On Gold & Etf PresentationShamik Bhose
 
Shamiks Crude Oil Overview 1 Summer 12
Shamiks Crude Oil Overview 1 Summer 12Shamiks Crude Oil Overview 1 Summer 12
Shamiks Crude Oil Overview 1 Summer 12Shamik Bhose
 
Part Ii Gold Standard Redux
Part Ii   Gold Standard ReduxPart Ii   Gold Standard Redux
Part Ii Gold Standard ReduxShamik Bhose
 
Fx Commodity Corelation
Fx Commodity CorelationFx Commodity Corelation
Fx Commodity CorelationShamik Bhose
 
Ray & Santiniketan, a little drop of dew
Ray & Santiniketan, a little drop of dewRay & Santiniketan, a little drop of dew
Ray & Santiniketan, a little drop of dewShamik Bhose
 
Shamik bhose profile as director of commodity & currency
Shamik bhose profile as director of commodity & currencyShamik bhose profile as director of commodity & currency
Shamik bhose profile as director of commodity & currencyShamik Bhose
 
Shamik Bhose On Gold As Money
Shamik Bhose On Gold As MoneyShamik Bhose On Gold As Money
Shamik Bhose On Gold As MoneyShamik Bhose
 
Shamik Bhose October Crude Oil Views
Shamik Bhose  October Crude Oil ViewsShamik Bhose  October Crude Oil Views
Shamik Bhose October Crude Oil ViewsShamik Bhose
 

Plus de Shamik Bhose (8)

Shamik On Gold & Etf Presentation
Shamik On Gold & Etf PresentationShamik On Gold & Etf Presentation
Shamik On Gold & Etf Presentation
 
Shamiks Crude Oil Overview 1 Summer 12
Shamiks Crude Oil Overview 1 Summer 12Shamiks Crude Oil Overview 1 Summer 12
Shamiks Crude Oil Overview 1 Summer 12
 
Part Ii Gold Standard Redux
Part Ii   Gold Standard ReduxPart Ii   Gold Standard Redux
Part Ii Gold Standard Redux
 
Fx Commodity Corelation
Fx Commodity CorelationFx Commodity Corelation
Fx Commodity Corelation
 
Ray & Santiniketan, a little drop of dew
Ray & Santiniketan, a little drop of dewRay & Santiniketan, a little drop of dew
Ray & Santiniketan, a little drop of dew
 
Shamik bhose profile as director of commodity & currency
Shamik bhose profile as director of commodity & currencyShamik bhose profile as director of commodity & currency
Shamik bhose profile as director of commodity & currency
 
Shamik Bhose On Gold As Money
Shamik Bhose On Gold As MoneyShamik Bhose On Gold As Money
Shamik Bhose On Gold As Money
 
Shamik Bhose October Crude Oil Views
Shamik Bhose  October Crude Oil ViewsShamik Bhose  October Crude Oil Views
Shamik Bhose October Crude Oil Views
 

What Drives Gold On

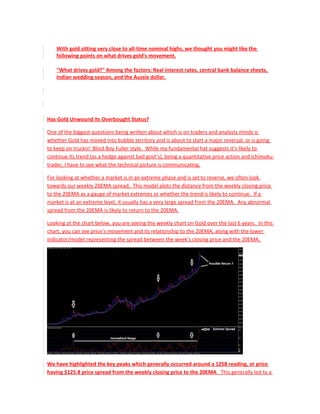
  • 1. With gold sitting very close to all-time nominal highs, we thought you might like the following points on what drives gold's movement. "What drives gold?" Among the factors: Real interest rates, central bank balance sheets, Indian wedding season, and the Aussie dollar. Has Gold Unwound its Overbought Status? One of the biggest questions being written about which is on traders and analysts minds is whether Gold has moved into bubble territory and is about to start a major reversal, or is going to keep on truckin’ Blind Boy Fuller style. While my fundamental hat suggests it’s likely to continue its trend (as a hedge against bad govt’s), being a quantitative price action and ichimoku trader, I have to see what the technical picture is communicating. For looking at whether a market is in an extreme phase and is set to reverse, we often look towards our weekly 20EMA spread. This model plots the distance from the weekly closing price to the 20EMA as a gauge of market extremes or whether the trend is likely to continue. If a market is at an extreme level, it usually has a very large spread from the 20EMA. Any abnormal spread from the 20EMA is likely to return to the 20EMA. Looking at the chart below, you are seeing the weekly chart on Gold over the last 6 years. In this chart, you can see price’s movement and its relationship to the 20EMA, along with the lower indicator/model representing the spread between the week’s closing price and the 20EMA. We have highlighted the key peaks which generally occurred around a 1258 reading, or price having $125.8 price spread from the weekly closing price to the 20EMA. This generally led to a
  • 2. pullback minimally to the 20EMA within an average of 4 weeks and a maximum of 10. We would like to note that historically, since April of 2005, Gold has spent only 43 weeks below the 20EMA (closing basis) out of 541 for a total of 8% of the time, statistically displaying its tendency to trend upward. It also means should Gold break below the 20EMA, the chances of price staying below it for extended periods of time are unlikely. What we do have to note is the most recent parabolic run away from the 20EMA created an abnormal spike never before seen in history with a reading of 2718 or price closing $271.8 away from the 20EMA. So the next logical question becomes what do we make of this and is it the end of this massive uptrend? Our view is this is unlikely, considering the historical relationship to the 20EMA as noted before (8% of time below). In fact, we may consider a pullback to the 20EMA to be a healthy thing as it will put Gold through a re-distribution phase and allow the order flows behind it to start another run higher. But, the extreme nature of this suggests price is likely to pullback to the 20ema within the next 2mos or by year end. Across most instruments, price rarely has this kind of extreme or unstable relationship to the 20EMA and usually means the orders behind such movements have to normalize a bit before starting another run. Keep in mind, this does not have to happen with a violent sell-off and could be the result of price hanging around the $1700-$1900 range while the 20EMA catches up to current price levels. In fact, to add any new positions, we’d rather wait to let the spread normalize and move back into the prior range which suggested a very healthy trend. We also do have to add to the bullish prospects how price had one of its biggest weekly drops from an open of $1860.92, to an all-time high of $1911.89, then shedding $209 to the weekly $1702 low to do what??? Bounce strongly and end the week at $1827. This is highly suggestive of how the buyers were ready to stand up to one of the most violent and largest % based weekly sell-offs and send the metal within roughly $40 or 2% of where it opened the week. Thus, although the short-term price structure may suggest consolidation or mild pullback to the 20EMA, our medium and long term technical view is still strongly bullish The higher they go the harder they'll crash: when gold goes hyperbolic as now, it's a bubble. Issue is at which level it crashes? 3K, 4K...? A Tale of Two Bubbles: attached a Gold vs Nasdaq Chart, time adjusted. Courtesy of Reuters
  • 3. Question for gold bugs: How much of gold long positions are financed now, as Nasdaq was in late '90s, with leverage? Do CME data show that? Of course a bubble doesn't mean you should stop buying. Roubini said earlier this week that rising uncertainty supports gold: “That’s the mentality that leads gold to be at $1,800 (an ounce) or above. So gold, because of that, can go higher." Yesterday Wells Fargo compared gold to past bubbles and came up with a different conclusion: "In the five years prior to their respective peaks, the NASDAQ rose 500 percent and oil rose 340 percent. Over the last five years, gold has not seen nearly the trajectory of increase, rising only about 200 percent. Thus, based on this metric, gold does not yet appear to be in a bubble à la the NASDAQ in 2000 or oil in 2008. However, the 200 percent five-year increase has risen from 150 percent in our April report “Real Gold Price Still Below Record, but Just Barely The real gold price has not yet reached the high of about $1,952/ounce at today’s prices seen in January 1980, but it is very close. In addition, prices have gone “parabolic,” meaning they have risen by an extraordinary amount in a very short period of time. When asset prices go parabolic, they usually do not stay at those levels very long and often see a quick reversal. Thus, it is possible we could see a near-term pullback in gold based on this technical pattern. However, based on the aforementioned factors driving gold’s meteoric rise, the pullback may not be very large and will probably not last very long before gold prices start to rise again. Gold Still Hasn’t Risen as Much or as Fast as NASDAQ or Oil In the five years prior to their respective peaks, the NASDAQ rose 500 percent and oil rose 340 percent. Over the last five years, gold has not seen nearly the trajectory of increase, rising only about 200 percent. Thus, based on this metric, gold does not yet appear to be in a bubble à la
  • 4. the NASDAQ in 2000 or oil in 2008. However, the 200 percent five-year increase has risen from 150 percent in our April report. Gold-Oil Price Ratio Above Average, but Not Unprecedented While gold has soared, oil has dropped to around $84/barrel amid growing concerns about slowing global growth. As such, the gold-oil ratio has jumped to 22.4, well above the historical average of 15.5 but certainly not unprecedented. Furthermore, just because the ratio is above- average does not necessarily mean gold is overvalued or oil is undervalued. At this time, both the jump in gold prices and the plunge in oil prices appear to be justified by fundamentals. This ratio may decline a bit in the coming weeks, but we do not foresee an outright crash in gold prices I want to say that should the SNB choose to set up a Peg it will not work. It will end with a staggering explosion. I can’t see a “solution” in Europe. Germany will not “Federalize” the debts of the peripheral states. Therefore the problems will not go away. The risks to Italy and France will grow as a result. As that happens, capital will have to move in the direction of Switzerland. That is always how this has worked in Europe. The SNB may buy some time with their Peg and force scared money into gold. But sooner or later the money will flow to Switzerland. This is especially true given that the SNB will be subsidizing the price of the Franc for that hot money. Should we go down that road the SNB could be forced to absorb 300 billion Euros. The losses on those holding could be staggering for a small economy like Switzerland What happens if there were to be a peg? Two shorter-term outcomes that I can think of:The CHF is the “go to” safe have. But not if they peg themselves to the Euro. Some of the money that is currently parked LONG TERM in Switzerland will leave. (I think a lot of the short term hot money has found the exit by now). Where will those long term seekers of of a safe haven go, now that it ain’t so safe? There is only one option, gold. That is especially true for those who have Swiss Francs in the first place. They all love gold. Now they will have to love it more. The next time there is a crisis on the table where will the money go? Not the Swissie. That would be a dead end. So the rest of the hot money will have less of a place to go. Once again it points to gold. ShamikBhose@yahoo.com