SlideShare une entreprise Scribd logo
1  sur  42
Balance Sheet of State Bank of India    ------------------- in Rs. Cr. -------------------


                                       Mar '05     Mar '06                Mar '07            Mar '08      Mar '09


                                       12 mths 12 mths                    12 mths            12 mths      12 mths


Capital and Liabilities:
Total Share Capital                    526.30      526.30                 526.30             631.47       634.88
Equity Share Capital                   526.30      526.30                 526.30             631.47       634.88
Share Application Money                0.00        0.00                   0.00               0.00         0.00
Preference Share Capital               0.00        0.00                   0.00               0.00         0.00
Reserves                               23,545.84 27,117.79                30,772.26          48,401.19    57,312.82
Revaluation Reserves                   0.00        0.00                   0.00               0.00         0.00
Net Worth                              24,072.14 27,644.09                31,298.56          49,032.66    57,947.70
                                       367,047.5
Deposits                                         380,046.06               435,521.09         537,403.94   742,073.13
                                       3
Borrowings                             19,184.31 30,641.24                39,703.34          51,727.41    53,713.68
                                       386,231.8
Total Debt                                       410,687.30               475,224.43         589,131.35   795,786.81
                                       4
Other Liabilities & Provisions         49,578.89 55,538.17                60,042.26          83,362.30    110,697.57
                                       459,882.8
Total Liabilities                                493,869.56               566,565.25         721,526.31   964,432.08
                                       7
                                       Mar '05     Mar '06                Mar '07            Mar '08      Mar '09


                                       12 mths 12 mths                    12 mths            12 mths      12 mths


Assets
Cash & Balances with RBI               16,810.33 21,652.70                29,076.43          51,534.62    55,546.17
Balance with Banks, Money at Call        22,511.77 22,907.30                22,892.27          15,931.72    48,857.63
                                         202,374.4
Advances                                           261,641.53               337,336.49         416,768.20   542,503.20
                                         5
                                         197,097.9
Investments                                        162,534.24               149,148.88         189,501.27   275,953.96
                                         1
Gross Block                              6,691.09 7,424.84                  8,061.92           8,988.35     10,403.06
Accumulated Depreciation                 4,114.67 4,751.73                  5,385.01           5,849.13     6,828.65
Net Block                                2,576.42 2,673.11                  2,676.91           3,139.22     3,574.41
Capital Work In Progress                 121.27      79.82                  141.95             234.26       263.44
Other Assets                             18,390.71 22,380.84                25,292.31          44,417.03    37,733.27
                                         459,882.8
Total Assets                                       493,869.54               566,565.24         721,526.32   964,432.08
                                         6


                                         131,325.4
Contingent Liabilities                             191,819.34               259,536.57         736,087.59   614,603.47
                                         0
Bills for collection                     44,794.10 57,618.44                70,418.15          93,652.89    152,964.06
Book Value (Rs)                          457.39      525.25                 594.69             776.48       912.73


Profit & Loss account of State Bank of
                                          ------------------- in Rs. Cr. -------------------
India


                                         Mar '05 Mar '06                   Mar '07             Mar '08      Mar '09


                                         12 mths 12 mths                   12 mths             12 mths      12 mths


Income

Interest Earned                          32,428.0035,794.93                39,491.03           48,950.31    63,788.43
Other Income                   7,119.90 7,388.69    7,446.76    9,398.43    12,691.35

Total Income                   39,547.9043,183.62   46,937.79   58,348.74   76,479.78

Expenditure

Interest expended              18,483.3820,159.29   23,436.82   31,929.08   42,915.29

Employee Cost                  6,907.35 8,123.04    7,932.58    7,785.87    9,747.31

Selling and Admin Expenses     2,634.64 1,853.32    3,251.14    4,165.94    5,122.06

Depreciation                   752.21   729.13      602.39      679.98      763.14

Miscellaneous Expenses         6,465.82 7,912.15    7,173.55    7,058.75    8,810.75

Preoperative Exp Capitalised   0.00     0.00        0.00        0.00        0.00

Operating Expenses             11,278.1811,872.89   13,251.78   14,609.55   18,123.66

Provisions & Contingencies     5,481.84 6,744.75    5,707.88    5,080.99    6,319.60

Total Expenses                 35,243.4038,776.93   42,396.48   51,619.62   67,358.55

                               Mar '05 Mar '06      Mar '07     Mar '08     Mar '09


                               12 mths 12 mths      12 mths     12 mths     12 mths


Net Profit for the Year        4,304.52 4,406.67    4,541.31    6,729.12    9,121.23

Extraordionary Items           0.00     0.00        0.00        0.00        0.00

Profit brought forward         0.34     0.34        0.34        0.34        0.34

Total                          4,304.86 4,407.01    4,541.65    6,729.46    9,121.57

Preference Dividend            0.00     0.00        0.00        0.00        0.00

Equity Dividend                657.87   736.82      736.82      1,357.66    1,841.15

Corporate Dividend Tax         93.75    103.34      125.22      165.87      248.03

Per share data (annualised)

Earning Per Share (Rs)         81.79    83.73       86.29       106.56      143.67

Equity Dividend (%)            125.00   140.00      140.00      215.00      290.00

Book Value (Rs)                457.39   525.25      594.69      776.48      912.73
Appropriations

Transfer to Statutory Reserves                 3,552.89 3,566.51                  3,682.15               5,205.69      6,725.15

Transfer to Other Reserves                     0.01        0.00                   -2.88                  -0.10         306.90

Proposed Dividend/Transfer to Govt             751.62      840.16                 862.04                 1,523.53      2,089.18

Balance c/f to Balance Sheet                   0.34        0.34                   0.34                   0.34          0.34

Total                                          4,304.86 4,407.01                  4,541.65               6,729.46      9,121.57

Cash Flow of State Bank of India                 ------------------- in Rs. Cr. -------------------


                                                 Mar '06            Mar '07             Mar '08           Mar '09       Mar '10


                                                 12 mths            12 mths             12 mths           12 mths       12 mths


Net Profit Before Tax                            6837.36            7625.08             10438.90          14180.64      13926.10

Net Cash From Operating Activities               6039.14            -1776.07            -856.87           29479.73      -1804.99

Net Cash (used in)/from
                                                 -1134.18           -284.56             -2798.01          -1651.93      -1761.52
Investing Activities

Net Cash (used in)/from Financing
                                                 461.98             9494.11             19371.12          5097.38       -3359.67
Activities

Net (decrease)/increase In Cash and Cash
                                         5366.94                    7433.49             15716.24          32925.18      -6926.18
Equivalents

Opening Cash & Cash Equivalents                  39322.10           44535.20            51968.69          71478.62      103110.02

Closing Cash & Cash Equivalents                  44689.04           51968.69            67466.34          104403.80     96183.84


Key Financial Ratios of State Bank of India ------------------- in Rs. Cr. -------------------


                                                Mar     Mar '07               Mar '08                 Mar '09         Mar '10
'06


Investment Valuation Ratios

Face Value                               10.00 10.00    10.00    10.00      10.00

Dividend Per Share                       14.00 14.00    21.50    29.00      30.00

Operating Profit Per Share (Rs)          124.77147.72   173.61   230.04     229.63

Net Operating Profit Per Share (Rs)      719.54833.38   899.83   1,179.45   1,353.15

Free Reserves Per Share (Rs)             178.33184.43   356.61   373.99     412.36

Bonus in Equity Capital                  --     --      --       --         --

Profitability Ratios

Interest Spread                          4.31   4.20    4.32     4.34       3.82

Adjusted Cash Margin(%)                  13.06 11.43    12.81    13.04      11.62

Net Profit Margin                        11.21 10.12    11.65    12.03      10.54

Return on Long Term Fund(%)              97.89 99.20    86.83    100.35     95.02

Return on Net Worth(%)                   15.94 14.50    13.72    15.74      13.89

Adjusted Return on Net Worth(%)          15.93 14.47    13.70    15.74      13.91

Return on Assets Excluding Revaluations 525.25594.69    0.93     912.73     1,038.76

Return on Assets Including Revaluations 525.25594.69    0.93     912.73     1,038.76

Management Efficiency Ratios

Interest Income / Total Funds            7.94   8.27    8.82     8.88       8.52

Net Interest Income / Total Funds        3.71   3.85    3.87     3.79       3.82

Non Interest Income / Total Funds        0.30   0.19    0.14     0.11       0.10

Interest Expended / Total Funds          4.23   4.42    4.96     5.09       4.69

Operating Expense / Total Funds          2.34   2.39    2.16     2.06       2.38

Profit Before Provisions / Total Funds   1.52   1.54    1.74     1.75       1.46

Net Profit / Total Funds                 0.92   0.86    1.04     1.08       0.91

Loans Turnover                           0.16   0.15    0.15     0.16       0.15
Total Income / Capital Employed(%)       8.24    8.46   8.96    8.99    8.62

Interest Expended / Capital Employed(%) 4.23     4.42   4.96    5.09    4.69

Total Assets Turnover Ratios             0.08    0.08   0.09    0.09    0.09

Asset Turnover Ratio                     5.10    5.44   6.32    7.20    7.26

Profit And Loss Account Ratios

Interest Expended / Interest Earned      56.32 59.35    65.23   67.28   66.66

Other Income / Total Income              3.60    2.25   1.56    1.18    1.21

Operating Expense / Total Income         28.37 28.19    24.13   22.91   27.61

Selling Distribution Cost Composition    0.28    0.20   0.30    0.33    0.26

Balance Sheet Ratios

Capital Adequacy Ratio                   11.88 12.34    13.47   14.25   13.39

Advances / Loans Funds(%)                65.66 76.16    78.31   78.34   74.22

Debt Coverage Ratios

Credit Deposit Ratio                     62.11 73.44    77.51   74.97   75.96

Investment Deposit Ratio                 48.14 38.22    34.81   36.38   36.33

Cash Deposit Ratio                       5.15    6.22   8.29    8.37    7.56

Total Debt to Owners Fund                13.75 13.92    10.96   12.81   12.19

Financial Charges Coverage Ratio         1.40    1.37   1.37    1.36    1.33

Financial Charges Coverage Ratio Post Tax 1.25   1.22   1.23    1.23    1.21

Leverage Ratios

Current Ratio                            0.05    0.05   0.07    0.04    0.04

Quick Ratio                              5.50    6.52   6.15    5.74    9.07

Cash Flow Indicator Ratios

Dividend Payout Ratio Net Profit         19.06 18.98    22.64   22.90   23.36

Dividend Payout Ratio Cash Profit        16.35 16.75    20.56   21.13   21.20

Earning Retention Ratio                  80.93 80.97    77.33   77.11   76.67

Cash Earning Retention Ratio             83.64 83.21    79.41   78.88   78.82
AdjustedCash Flow Times                 74.03 84.87                   72.64                   75.05              79.54

Yearly Results of State Bank of India    ------------------- in Rs. Cr. -------------------


                                         Mar '06                 Mar '07                 Mar '08      Mar '09       Mar '10


Sales Turnover                           35,794.93               39,491.02               48,950.31    63,788.43     70,993.92

Other Income                             7,388.69                5,769.25                8,694.93     12,690.79     14,968.15

Total Income                             43,183.62               45,260.27               57,645.24    76,479.22     85,962.07

Total Expenses                           16,118.18               14,233.15               15,277.26    19,383.27     24,713.51

Operating Profit                         19,676.75               25,257.87               33,673.05    44,405.16     46,280.41

Profit On Sale Of Assets                 --                      --                      --           --            --

Profit On Sale Of Investments            --                      --                      --           --            --

Gain/Loss On Foreign Exchange            --                      --                      --           --            --

VRS Adjustment                           --                      --                      --           --            --

Other Extraordinary Income/Expenses      --                      --                      --           --            --

Total Extraordinary Income/Expenses      --                      --                      --           --            --

Tax On Extraordinary Items               --                      --                      --           --            --

Net Extra Ordinary Income/Expenses       --                      --                      --           --            --

Gross Profit                             27,065.44               31,027.12               42,367.98    57,095.95     61,248.56

Interest                                 20,159.29               23,436.82               31,929.08    42,915.29     47,322.48

PBDT                                     6,906.15                7,590.30                10,438.90    14,180.66     13,926.08

Depreciation                             --                      --                      --           --            --

Depreciation On Revaluation Of Assets    --                      --                      --           --            --

PBT                                      6,906.15                7,590.30                10,438.90    14,180.66     13,926.08

Tax                                      2,499.48                3,048.99                3,709.78     5,059.42      4,760.03

Net Profit                               4,406.67                4,541.31                6,729.12     9,121.24      9,166.05

Prior Years Income/Expenses              --                      --                      --           --            --
Depreciation for Previous Years Written
                                          --                --               --             --            --
Back/ Provided

Dividend                                  --                --               --             --            --

Dividend Tax                              --                --               --             --            --

Dividend (%)                              --                --               --             --            --

Earnings Per Share                        83.73             86.29            106.56         143.67        144.37

Book Value                                --                --               --             --            --

Equity                                    526.30            526.30           631.47         634.88        634.88

Reserves                                  27,117.79         30,503.66        48,401.19      57,312.81     65,314.32

Face Value                                10.00             10.00            10.00          10.00         10.00

Capital Structure

Period                  Instrument        Authorized CapitalIssued Capital   -PAIDUP-

From           To                         (Rs. cr)          (Rs. cr)         Shares (nos)           Face Value     Capital

2009           2010     Equity Share      214.75            214.75           634882644              10             214.75

2008           2009     Equity Share      214.75            214.75           634880222              10             214.75

2007           2008     Equity Share      214.75            214.75           631470376              10             214.75

2006           2007     Equity Share      214.75            214.75           526298878              10             214.75

2005           2006     Equity Share      214.75            214.75           526298878              10             214.75

2004           2005     Equity Share      214.75            214.75           526298878              10             214.75

2003           2004     Equity Share      214.75            214.75           526298878              10             214.75

2002           2003     Equity Share      214.75            214.75           526298878              10             214.75

2001           2002     Equity Share      214.75            214.75           526298878              10             214.75

2000           2001     Equity Share      214.75            214.75           526298878              10             214.75

1999           2000     Equity Share      214.75            214.75           526298878              10             214.75

1996           2000     Equity Share      214.75            214.75           526298878              10             214.75

1995           1996     Equity Share      214.75            214.75           474009872              10             214.75

1994           1995     Equity Share      214.75            214.75           474009189              10             214.75

1993           1994     Equity Share      214.75            214.75           473828726              10             214.75
1991        1993   Equity Share    214.75     200           20000000       100           200

Directors Report                                                                 Year End : Mar '10

V. CREDIT POLICY AND PROCEDURES DEPARTMENT (CPPD)

 PERFORMANCE HIGHLIGHTS :

 - Loan Policy of the Bank, has been reviewed and current RBI guidelines
 have been incorporated.

 - Increase in the Term Loan exposure limit to Infrastructure sector to
 15% from 10%. .

 - Appointment of Nominee Directors Review and Authority Structure.

 - Prudential Norms on Unsecured Advances.

 - Guidelines on Restructuring of Advances by Banks.

 - Review of Grievances redressal mechanism under Guidelines on Fair
 Practice Codes for Lending.

 - Accounting procedures for sale of NPAs / Securitisatibn Companies /
 Asset Reconstruction Companies.

 - Operational guidelines on Forward Exchange Contracts and Derivatives.

 - Competitive Pricing - Review.

 - CP linked rates for discounting of Bills under LCs.

 - Policy for financing Corporates on Unsecured basis to attract new
 business.

 - As part of the Banks Green Banking Policy, initiatives like
 plantation of fruit bearing trees across the Banks premises,
 implementation of energy saving measures, encouraging customers on
 reduction of Green House gases by way of extending project loans on
 concessionary interest rates, assisting in CDM Registration and
 securitization of CER receivables etc. were undertaken.

 - Under the captive windmill project, the Bank has gone in for 10
 windmills (1.5 MW each) which have been set up in three States viz.
 Maharashtra, Gujarat and Tamilnadu. Power generated from the windmills
 shall be set-off against the power consumption of identified offices /
 branches of those States. State Bank of India is the first Bank in
 India to have conceived the idea of Green Power generation for
 captive use in the Banking Industry.

 NEW PRODUCT :

 - Financing to Shipbreaking Units.
Responsibility Statement

 The Board of Directors hereby states :

 i, that in the preparation of the annual accounts, the applicable
 accounting standards have been followed along with proper explanation
 relating to material departures;

 ii>. that they have selected such accounting policies and applied them
 consistently and made judgements and estimates as are reasonable and
 prudent, so as to give a true and fair view of the state of affairs of
 the Bank as on the 31st March 2010, and of the profit and loss of the
 Bank for the year ended on that date;

 iii. that they have taken proper and sufficient care for the
 maintenance of adequate accounting records in accordance with the
 provisions of the Banking Regulation Act, 1949 and State Bank of India
 Act, 1955 for safeguarding the assets of the Bank and preventing and
 detecting frauds and other irregularities; and

 iv. that they have prepared the annual accounts on a going concern
 basis.

 Acknowledgement

 During the year, Shri Ashok Chawla, Finance Secretary, Govt, of India
 was nominated to the Board under Section 19 (e) with effect from 13th
 May 2009, in place of Shri Arun Ramanathan, who retired on 30th April
 2009.

 The Directors express their gratitude for the guidance and cooperation
 received from the Government of India, RBI, SEBI, IRDA and other
 government and regulatory agencies.

 The Directors also thank all the valued clients, shareholders, banks
 and financial institutions, stock exchanges, rating agencies and other
 stakeholders for their patronage and support, and take this opportunity
 to express their appreciation of the dedicated and committed team of
 employees of the Bank.

                                             For and on behalf of the
                                           Central Board of Directors

                                                           O.P. Bhatt

 Date : 14th May, 2010                                       Chairman


Chairman's Speech                                                          Year : Mar '10

I feel honoured to present, for the fourth time, details of your Banks
 performance and in this connection, your Banks Annual Report for the
 year 2009-10 detailing some of the significant initiatives and
 achievements during the year is enclosed.

 The world economy has been through a severe recession, the worst in the
last 70 years, marked by financial turmoil, large-scale destruction of
wealth, and declines in global output and trade. The global crisis,
which began in the financial sector in the developed countries exposed
a number of unresolved fragilities within the increasingly integrated
financial system and affected the real economy. Global economic
conditions appear to have improved on the back of co-ordinated fiscal
and monetary policy measures taken by governments and central banks
across the world. While some countries especially USA, now seem to be
showing some signs of coming out of one of the largest financial crises
in history, the recent threat of a sovereign default has tempered the
green shoots of optimism that things are beginning to get back to
normal. Continuing bank failures, macroeconomic weakness, widespread
unemployment and recent tremors in Dubai, Portugal, Ireland, Iceland,
Greece, Spain and other countries indicate that the crisis is not yet
completely out of fuel. Also, even though the outlook for global growth
has improved, the world is wary of a double dip, given the several
risks and uncertainties that still persist.

In sharp contrast, the Indian economy is trending up with strong GDP
growth expected at 7.2% in FY 2010, rising to over 8% in FY 2011 and
moving on to 9-10% in the medium term. The resurgence of manufacturing
sector is driven by continuing growth in capital goods and consumer
goods, as well as capacity additions across industry. At the same time,
inflation has been rising. This complex global and domestic economic
backdrop has posed its own set of challenges for policymakers in India
and maintaining interest rates that are not out of sync with global
rates, while supporting the growth momentum and also keeping a check on
inflation remains a great challenge for the economy.

Against this background, in the year gone by, the State Bank Group has
performed well. Associate Banks Net Profit increased by 17.74% from
Rs.2,774 crores in FY 2009 to Rs.3,266 crores in FY 2010. Operating
profit of all Associate Banks increased by 2008% from Rs.5,495 crores
to Rs.6,598 crores. SBI Group Net Profit for FY 2010 at Rs.11,734
crores was up by 7.11% from Rs.10,955 crores in FY 2009.

Within a short span, SBI Life has recorded a profit of Rs.276 crores in
FY 2010 as against a loss of Rs.26 crores in FY 2009. AUM of the
company as on March 31, 2010 stood at Rs.28,703 crores, a YoY growth of
94%. Market share of SBI Life amongst private insurers increased to
18.34% from 16.00% in March 2009. SBI Capital Markets Ltd has posted a
PAT of Rs.150 crores during FY 2010 as against Rs.75 crores in FY 2009
(excluding extraordinary income of Rs.74.98 crores), a YoY growth of
100%, driven by an increase of 73% in fee income. I am happy to place
on record that SBI Capital Markets has crossed the milestone of
Rs.1,00,000 crores in syndication. Another subsidiary, SBI DFHI Ltd.,
has recorded a net profit of Rs.89 crores during FY 2010 which is the
highest in the last six years. SBI Cards has emerged as the most
trusted brand by being the undisputed Gold Award winner in the Readers
Digest Trusted Brands Survey 2009 in the Credit Card category. Net loss
before tax during FY 2010 is down by 17% to Rs. 154 crores against a
loss of Rs.185 crores during FY 2009.

As you are aware, we ended last year with a liquidity surplus of
Rs»83,991 crores, causing a drag on our profitability. Since credit
off-take was poor, we consciously decided to shed high cost bulk
deposits. You will be happy to see that in this competitive and
challenging scenario, despite shedding high cost bulk deposits of
Rs.77,679 crores (-50.15%), your Banks deposits went up by Rs.62,043
crores in FY 2010, driven by CASA growth of 26.76% and retail term
deposits growth of 17.64%, resulting in a YoY growth of 8.36% in
deposits from Rs.7,42,073 crores in March 2009 to Rs.8,04,116 crores in
March 2010. Savings Bank deposits grew at an average of Rs.4,897
crores per month during FY 2010, total CASA growth during the year
being Rs.73,168 crores. While market share in deposits in March 2010 at
16.31% (17.70% in March 2009), declined by 139 bps YoY, market share in
low cost demand deposits at 17.51% (17.43% in March 2009) was up by 8
bps.

Gross Advances of your Bank rose by Rs.92,940 crores, a growth of
16.94% from Rs.5,48,540 crores in March 2009 to Rs.6,41,480 crores in
March 2010. Market share in advances in March 2010 at 16.28% (15.99%
in March 2009) registered an increase of 29 bps YoY. Your Bank
registered an impressive rise in Credit Deposit Ratio to 73.56% as at
the end of March 2010 from 66.63% at the end of March 2009, an increase
of 693 bps, bucking the industry trend as the credit deposit ratio for
ASCB has come down from 72.32% in March 2009 to 72.22% in March 2010.

Your Banks prudent lending policies have ensured balanced growth, with
credit flowing across a wide range of sectors in the economy. Large and
Mid Corporate advances have grown from Rs. 1,93,351 crores in March
2009 to Rs.2,21,892 crores in March 2010, registering a growth of
14.76%. Your Bank was No.l in retail lending in FY 2009 and continues
to be No.l in FY 2010, driven by robust growth in Home, Auto and
Education loans.

Home loans grew by 31.68% YoY from a level of Rs.54,063 crores in March
2009 to Rs.71,193 crores in March 2010. Almost 95% of our customers (in
rural, semi urban and urban areas) are first time home buyers. SBI Home
Loans is Indias No.l Home Loan brand. It has maintained its position
as Indias Most Preferred Home Loan brand in CNBC-Awaaz consumer
awards continuously for four years since 2006. SBI Home Loans has been
rated as The Best Home Loan in India by the panel of eminent jury in
NDTV-Outlook Money awards continuously since 2008.

Auto Loans went up by 45.44% YoY and Education Loans grew by 34.61%
between March 2009 and March 2010. Your Bank remains a leader in Auto
loans with its market share in Auto loans going up by 180 bps from 15%
in March 2009 to 16.80% in March 2010. The Bank continues to be number
one in financing Maruti cars pan India for two consecutive years in a
row and has increased its presence in the market with higher
penetration in the major brands like Chevrolet, Hyundai, Tata Motors
and Honda Siel cars. Currently, your Bank is the market leader in
Education Loans with a market share of 25% amongst PSU banks
underpinning its belief in the future of India and that the youth will
be the face of India in the coming years.

Agriculture advances have grown by 16.54% between March 2009 and March
2010 and total disbursements under Agri Advances were Rs.34,179 crores
during FY 2010, covering 12.32 lakh new farmers during the year.
International advances increased by 12.49% from Rs.86,301 crores in
March 2009 to Rs.97,071 crores in March 2010 despite hardening of the
rupee.
Along with increase in credit, your Banks conscious efforts to improve
asset quality have borne fruit. The economic slowdown led to a rise in
Gross NPAs from 2.86% in March 2009 to 3.11% in December 2009, but the
same has been contained and declined to 3.05% by March 2010. During
this period, Net NPAs rose from 1.79% to 1.88% but declined to 1.72%.

Your Banks capital adequacy is   well above the 9% norm stipulated by
RBI. As per Basel II the CRAR    of your Bank stood at 13.39% as at the
end of March 2010, compared to   14.25% last year. As per Basel I the
CRAR was 12.00% and Tier I was   8.46% as on March 2010.

Operating Expenses were up by 29.84% in FY 2010 over FY 2009, driven by
five key costs, as the Bank invested heavily in laying the foundation
for future growth: (i) sharp increase in number of employees in various
categories, the full impact of which on staff expenses was felt during
FY 2010; (ii) Rs.627 crores arrears for wage revision pertaining to
previous years provided during FY 2010; (iii) Additional contribution
for pension at Rs.1998 crores against Rs.1,469 crores

last year; (iv) Additional expenses of Rs.59 crores on Financial
Inclusion; and (v) An expenditure of Rs.347 crores incurred on opening
of 1,049 new branches and installing 7,788 new ATMs during the year.
Bulk of these got back ended to the last quarter of the year. Our
profits for Q4, therefore, went down by Rs.875.69 crores or 31.93% and
the profit for the year remained flat at Rs.9166.05 crores.

Your Bank remains committed to the customer and has taken several new
initiatives to expand the bouquet of choices for its customers. As you
are aware, over the last four years, your Bank has been seeking out new
growth opportunities and has successfully forayed into related areas. I
am happy to announce that your Bank has tirelessly persevered in this
direction and several new initiatives were launched during 2009-10.
Mobile Banking Services launched on 31.03.2009, have been extended to
all branches during FY 2010. There are more than 2,18,000 registered
users on date. Financial Planning & Wealth Management application has
gone live and Financial Planning & Advisory Services have been rolled
out in 924 branches across the Bank. Merchant Acquiring business has
commenced on select basis and around 200 PoS terminals have been
deployed. Your Bank is expected to deploy 1.50 lac PoS temiinals and
enrol over 100 merchants for online purchases during the year. Your
Bank has selected a consortium of Visa International and Elavon for a
joint venture, which aims to set up 6 lac PoS terminals. SBI-SG Global
Securities Services Pvt Ltd. has commenced operations in March 2010,
which provides Custodial Services comprising Settlement, Depository
Services, Safekeeping, Corporate Action, Fund Accounting etc. Your Bank
has established SBI General Insurance Co. and limited commercial
operations have been launched in March 2010. By August 2010, the
Company would be ready for pan India operations with IT backed support.

As the Countrys Premier Financial Conglomerate providing financial
resources and services to clients pan India, your Bank has a role to
play in addressing the issue of global warming. Your Banks Green
Banking policy aims to reduce the Banks own carbon footprint and to
sensitise its clients to adopt low carbon emission practices. First of
its kind in the entire Banking, Finance and Insurance Sector (BFIS),
your Bank has conceptualised generation of energy through renewable
energy resources and therefore, resolved to install windmills for the
Banks captive use with a view to substitute polluting power with green
power besides initiating several measures like switching over to energy
efficient lighting systems, installation of energy savers, efficient
water management systems, waste disposal, tree plantation, etc.

Out of 1,049 branches opened during the financial year 2009-10, 354
branches were opened in metro and urban areas with a view to increase
our reach and be more accessible to customers. As at the end of March
2010, the Bank had 12,496 branches and 21,485 Group ATMs. As part of
our endeavour to provide increased access to banking facilities across
the country, your Bank simultaneously opened 154 branches and 1,540 new
ATMs on 12th July 2009, the largest by any Bank, anywhere in the world,
and the countrywide inauguration was done by the Honble Finance
Minister, Shri Pranab Mukherjee. Further, the 1000th new SBI branch and
10,000th new group ATM of the year were inaugurated by the Secretary,
Department of Financial Services, Ministry of Finance, Govt, of India.

The need to give the Bank a modern look and feel was necessary and
hence, special focus was placed on alternate banking channels such as
ATMs, Internet Banking and Mobile Banking which offer customers hassle
free banking anytime anywhere. The State Bank Group has a total of
21,485 ATMs across India as on 31st March 2010 of which 16,294 ATMs are
of the State Bank of India alone. Along with an increase in number of
ATMs, there has also been an increase in the number of debit cards
issued by the Bank, which rose by more than 40% during the year.

In the area of Micro Finance and Financial Inclusion, your Bank remains
the market leader with market share of around 31% in SHG-Bank Credit
Linkage programme having credit linked so far 17.13 lakh SHGs and
disbursed loans to the extent of Rs.l 1,562 crores. Your Bank has
rolled out several unique products like SHG Credit Card, SHG Sahayog
Niwas and SHG Gold Card, a new scheme for financing NGOs/ MFIs for
on-leading to SHGs, a Micro Insurance product - Grameen-Shakti has been
rolled out which has covered one million lives by March 2010. Your Bank
has been rated as the Best Public Sector Bank for Rural Reach by Dun
and Bradstreet and has been awarded the Best Microfinance Award for the
year 2009 by the Asian Banker for financial institutions across the
Asia Pacific, Gulf and Central Asia regions. Coverage of unbanked
villages increased from 53,000 in March 2009 to 1,03,938 by March 2010.

Your Bank has gone beyond the usual domains of technology in terms of
platform, solution, operational details and service content in a very
aggressive manner to serve the excluded common citizen with minimal
costs including SBI Tiny Card. Your Bank has rolled out Kiosk Banking,
operated at internet enabled PC (Kiosk) % with bio-metric validation,
in 7 Circles across 7 States and 49 districts. Major Service Centre
Agencies (SCAs) like SREI Sahaj, 3-i Infotech have been engaged as
Business Correspondents besides appointing about 26,800 Customer
Service Point (CSP)/ outlets of Business Correspondents / Business
Facilitators (BC/BFs). Some of the national level BC/BFs are India
Post, ITC, National Bulk Handling Corporation and Reliance Dairy. To
increase its outreach, the Bank has opened about 695 new branches in
rural and semi urban areas during 2009-10. To improve the processing
capacity, 314 Rural Central Processing Centres (RCPCs) have been set
up.

In the area of Information technology, your Bank successfully completed
CBS implementation which is among the worlds largest. Your Bank has
implemented a secure, robust and scalable WAN architecture connecting
18,189 Branches/Offices and 21,485 ATMs of State Bank Group through
leased lines, VSATs and CDMA technology, supporting all critical
business applications. This has facilitated successful launch of many
important functionalities, such as, Defence Salary Package, ASBA,
Universal Passbook etc. to meet specific requirements of Government,
Corporate and individual customers. Keeping in view the requirement of
senior citizens, a Pension Management System has been introduced at
Contact Centre enabling the pensioners to make enquiry on their pension
details through Contact Centre. A host of Mobile Banking services, such
as funds transfers, enquiries, cheque book requests, bill payments,
Mobile Top-up, recharging of DTH services, Demat account enquiry are
currently being offered under mobile banking.

Your Bank is involved not only with business development but also with
care for the community and supports a range of socio-economic,
educational and health initiatives. In the field of education, for
better governance and standards, your Bank, in partnership with the
Municipal Corporation of Greater Mumbai (MCGM), has launched a project
to transform and upgrade the outcome of education and educational
infrastructure in 1300 schools run by the Municipal Corporation. The
Bank has agreed to support this project as a partner for a period of 2
years as this project may evolve as a model for replication across the
country.

To bridge the widening gulf between our youth in Metro/Urban areas and
Rural India, your Bank has drawn up a programme named SBI Indicorps,
a volunteer programme on the lines of the US Peace Corps, which would
give fresh graduates from colleges/institutions an opportunity to live
in villages and work on development projects with reputed NGOs.

It is gratifying that our efforts have received recognition and the
spate of awards is ample testimony to this fact. Among the awards, your
Bank was adjudged Bank of The Year 2009, India by The Banker Magazine
for the second year in succession; Awarded Best Bank - Large, and
Most Socially Responsible Bank from Business World Best Bank Awards
2009; Bagged the BEST BANK 2009 Award by Business India; Adjudged the
Most Trusted Brand 2009 - Economic Times, Brand Equity; Bagged the
awards for Most Preferred Bank, Most Preferred Credit Card and
Most Preferred Home Loan Brand from CNBC AWAAZ Consumer Awards;
Awarded Visionaries of Financial Inclusion - Year 2009 by Financial
Information Network & Operations Ltd. (FINO); Awarded Technology Bank
of the Year in recognition of outstanding achievements in banking
technology - IB A Banking Technology Awards 2009 and selected as the
winner of Golden Peacock National Training Award for the year 2009 by
the Golden Peacock Awards Jury.

I am happy to announce that the Board of Directors of your Bank has
declared a dividend of Rs 30 per share (@300%) for the year ended 31st
March 2010, inclusive of an interim dividend already paid of Rs 10 per
share (@100%).

Today, India remains among the fastest growing countries of the world
and is poised to play a greater role in the global economy in the years
to come. Your Bank sees this as an opportunity and a challenge and I
assure you that your Bank will try to capitalize on this and blaze a
new trail of growth in future.

 With warm regards,

 Yours sincerely,

 (OM PRAKASH BHATT)
Auditor's Report                                                           Year End : Mar '10

1. We, the undersigned Auditors of State Bank of India, appointed
 under Section 41(1) of the State Bank of India Act, 1955, do hereby
 report to the Central Government upon the Balance Sheet, Profit & Loss
 Account and the Cash Flow Statement of the Bank.

 2. We have audited the attached Balance Sheet of State Bank of India
 as at 31st March 2010, the Profit & Loss Account and the Cash Flow
 Statement of the Bank for the year ended on that date annexed thereto.
 Incorporated in the said financial statements are the accounts of:

 (i) The Central Office, fourteen Local Head Offices, Corporate Accounts
 Group (Central), Mid-Corporate Group (Central), Stressed Assets
 Management Group (Central) and forty two branches audited by us;

 (ii) 9827 Indian Branches audited by other auditors;

 (iii) 44 Foreign Branches audited by the local auditors; and

 (iv) 2632 other Indian Branches, the unaudited returns of which are
 certified by the Branch Managers. These unaudited branches account for
 0.89% of advances, 3.78% of deposits, 0.96% of interest income and
 4.33% of interest expenses.

 These financial statements are the responsibility of the Banks
 Management. Our responsibility is to express an opinion on these
 financial statements based on our audit.

 3. We conducted our audit in accordance with the auditing standards
 generally accepted in India. Those standards require that we plan and
 perform the audit to obtain reasonable assurance about whether the
 financial statements are free of material misstatement. An audit
 includes examining, on a test basis, evidence supporting the amounts
 and disclosures in the financial statements. An audit also includes
 assessing the accounting principles used and significant estimates made
 by the Management, as well as evaluating the overall financial
 statement presentation. We believe that our audit provides a reasonable
 basis for our opinion.

 4. The Balance Sheet and the Profit & Loss Account have been drawn up
 in Forms A and B respectively of the Third Schedule to the Banking
 Regulation Act, 1949 and these give information as required to be given
 by virtue of the provisions of the State Bank of India Act, 1955, and
 Regulations there under.

 5.   We report, read with paragraph 2 above:

 (a) We have obtained all the information and explanations which to the
best of our knowledge and belief, were necessary for the purposes of
our audit and have found them to be satisfactory.

(b) The transactions of the Bank, which have come to our notice, have
been within the powers of the Bank.

(c) The returns received from the offices and branches of the Bank have
been found adequate for the purposes of our audit.

6. In our opinion, the Balance Sheet, Profit and Loss Account and Cash
Flow Statement comply with the applicable accounting standards.

7. In our opinion and to the best of our information and according to
the explanations given to us and as shown by the books of the Bank;

(i) the Balance Sheet, read with the Principal Accounting Policies and
the Notes to Accounts, is a full and fair Balance Sheet containing all
the necessary particulars and is properly drawn up so as to exhibit a
true and fair view of state of affairs of the Bank as at 31* March
2010;

(ii) the Profit and Loss Account, read with the Principal Accounting
Policies and the Notes to Accounts, shows a true balance of Profit for
the year ended on that date; and

(iii) the Cash Flow Statement gives a true and fair view of the cash
flows for the year ended on that date, and are in conformity with the
Accounting Principles generally accepted in India.

STATUTORY CENTRAL AUDITORS

For Essveeyar,

Chartered Accountants

P. Manohara Gupta

M.No.   016444

Firm Regn. No.000671 S

For K. C. Mehta & Co.,

Chartered Accountants

Milin Mehta

Partner : M.No. 038665

Firm Regn. No.106237 W


For Kalyaniwalla & Mistry,

Chartered Accountants
Vinayak M. Padwal

 Partner : M.No.      049639

 Firm Regn. No.104607 W


 For M. Verma & Associates, Chartered Accountants

 Madan Verma

 Partner : M No. 080939 Firm Regn. No. 501433 C

 For Krishnamoortny & Krishnamoorthy,
 Chartered Accountants


 C. R. Rema
 Partner: M.No. 029182

 Firm Regn. No. 001488 S

 Kolkata

 14th May,     2010


Notes to Accounts                                                          Year End : Mar '10

1.   Share capital:

 a) During the year, the Bank has allotted 2422 equity shares of Rs 10
 each for cash at a premium of Rs 1580 per equity share aggregating to
 Rs 38,50,980 out of 88,278 shares kept in abeyance under Right Issue -
 2008. Out of the total subscription of Rs 38,50,980 received, Rs 24,220
 was transferred to Share Capital Account and Rs 38,26,760 was
 transferred to Share Premium Account.

 b) The Bank has kept in abeyance the allotment of 85,856 (Previous Year
 88,278) Equity Shares of Rs 10/- each issued as a part of Rights issue,
 since they are subject to title disputes or are subjudice.

 c) Disclosures on Risk Exposure in Derivatives (A) Qualitative
 Disclosure

 i. The Bank currently deals in over-the-counter (OTC) interest rate and
 currency derivatives as also in Interest Rate and Currency Futures.
 Interest Rate Derivatives dealt by the Bank are rupee interest rate
 swaps, foreign currency interest rate swaps and forward rate
 agreements. Currency derivatives dealt with by the Bank are currency
 swaps, rupee dollar options and cross-currency options. The products
 are offered to the Banks customers to hedge their exposures and the
 Bank enters into derivatives contracts to cover such exposures.
Derivatives are also used by the Bank both for trading as well as
hedging on-balance sheet items. The Bank also deals in a mix of these
generic instruments. The Bank has done Option deals and Structured
Products with customers, but they have been covered on a back to back
basis in inter -bank market.

ii. Derivative transactions carry market risk i.e. the probable loss
the Bank may incur as a result of adverse movements in interest rates /
exchange rates and credit risk as the probable loss the Bank may incur
if the counterparties fail to meet their obligations. The Banks
Policy for Derivatives which is duly approved by the Board mandates
the market risk parameters (cut-loss triggers, open position limits,
PV01 etc.) as well as customer eligibility criteria (credit rating,
tenure of relationship etc.) for entering into derivative
transactions.Credit risk is controlled by entering into derivative
transactions only with counterparties in respect of whom appropriate
limits are set for taking into account their ability to honour
obligations.The Bank enters into ISDA agreements with such
counterparties.

iii. The Asset Liability Management Committee (ALCO) of the Bank
oversees efficient management of these risks. Market Risk Management
Department (MRMD), independently identifies measures, monitors market
risk associated with derivative transactions, assists ALCO in
controlling and managing these risks and reports compliance with policy
prescriptions to the Risk Management Committee of the Board (RMCB) at
regular intervals.

iv. The accounting policy for derivatives has been drawn-up in ac-
cordance with RBI guidelines, the details of which are presented under
Schedule 17: Principal Accounting Policy (PAP) for the financial year
2009-10.

v. Interest Rate Swaps are mainly used at Foreign Offices for hedg- ing
of the assets and liabilities.

vi. Apart from hedging swaps, swaps at Foreign Offices consist of back
to back swaps done at our Foreign Offices which are done mainly for
hedging of FCNR deposits at Global Markets, Kolkata.

vii. Majority of our swaps were done with First class counterparty
banks.

b) Provisioning Coverage Ratio:

The Provisioning to Gross Non-Performing Assets of the Bank as on 31st
March 2010 is 59.23%. (Previous Year 56.76%) Additional provision
pursuant to RBI guidelines for augmentation to 70% coverage by
30.09.2010 (extension allowed upto 30.9.2011 subject to fulfilment of
specified conditions) has not been made during the year.

18.7 Disclosure Requirements as per Accounting Standards a) Changes in
Accounting Policy

The Bank has implemented a special home loan scheme for the period
December 2008 to June 2009, arising out of which one time insurance
premium has been paid covering the lives of the borrowers over the
tenure of the home loan availed. The total insurance premium paid
amounting to Rs. 151.37 crores on account of such scheme is charged off
over average loan period of 15 years and accordingly, l/15th of the
premium amount has been charged off during the year instead of fully
charging in the accounts.

Consequent to this change, the profit after tax has gone up by Rs 93.26
crores.

b. Employee Benefits

ii.    Employees Provident Fund

In terms of the guidance on implementing the AS-15 (Revised 2005)
issued by the Institute of the Chartered Accountants of India, the
Employees Provident Fund set up by the Bank is treated as a defined
benefit plan since the Bank has to meet the specified minimum rate of
return. As at the year-end, no shortfall remains unprovided for.
Accordingly, other related disclosures in respect of Provident Fund
have not been made and an amount of Rs. 351.59 Crores (Previous Year Rs
337.53 Crores) is recognised as an expense towards the Provident Fund
scheme of the Bank included under the head Payments to and provisions
for employees in Profit and Loss Account.

iii.    Other Long term Employee Benefits

Amount of Rs. 151.24 Crores (Previous Year write back of an amount of
Rs. 49.05 Crores) is provided towards Long Term Employee Benefits and
is included under the head Payments to and Provisions for Employees
in Profit and Loss Account.

c) Segment Reporting

1.    Segment identification

A) Primary (Business Segment)

The following are the primary segments of the Bank :

— Treasury

— Corporate / Wholesale Banking

— Retail Banking

— Other Banking Business

The present accounting and information system of the Bank does not
support capturing and extraction of the data in respect of the above
segments separately. However, based on the present internal,
organisational and management reporting structure and the nature of
their risk and returns, the data on the primary segments have been
computed as under:

a) Treasury - The Treasury Segment includes the entire investment
portfolio and trading in foreign exchange contracts and derivative
contracts. The revenue of the treasury segment primarily consists of
fees and gains or losses from trading operations and interest income on
the investment portfolio.

b) Corporate / Wholesale Banking - The Corporate / Wholesale Banking
segment comprises the lending activities of Corporate Accounts Group,
Mid Corporate Accounts Group and Stressed Assets Management Group.
These include providing loans and transaction services to corporate and
institutional clients and further include non-treasury operations of
foreign offices.

c) Retail Banking - The Retail Banking Segment comprises of branches in
National Banking Group, which primarily includes Personal Banking
activities including lending activities to corporate customers having
banking relations with branches in the National Banking Group. This
segment also includes agency business and ATMs.

d) Other Banking business - Segments not classified under (a) to (c)
above are classified under this primary segment.

B) Secondary (Geographical Segment)

i) Domestic Operations - Branches/Offices having operations in India
ii) Foreign Operations - Branches/Offices having operations outside
India and offshore Banking units having operations in India

C) Pricing of Inter-segmental transfers

The Retail Banking segment is the primary resource mobilising unit. The
Corporate/Wholesale Banking and Treasury segments are recipient of
funds from Retail Banking. Market related Funds Transfer Pricing
(MRFTP) is followed under which a separate unit called Funding Centre
has been created. The Funding Centre notionally buys funds that the
business units raise in the form of deposits or borrowings and
notionally sell funds to business units engaged in creating assets.

D) Allocation of Expenses, Assets and liabilities

Expenses incurred at Corporate Centre establishments directly
attributable either to Corporate / Wholesale and Retail Banking
Operations or to Treasury Operations segment, are allocated
accordingly. Expenses not directly attributable are allocated on the
basis of the ratio of number of employees in each segment/ratio of
directly attributable expenses. The Bank has certain common assets and
liabilities, which cannot be attributed to any segment, and the same
are treated as unallocated.

d) Related Party Disclosures

1.   Related Parties

A.   SUBSIDIARIES

i.   DOMESTIC BANKING SUBSIDIARIES

1.   State Bank of Bikaner & Jaipur

2.   State Bank of Hyderabad
3.    State Bank of Indore

4.    State Bank of Mysore

5.    State Bank of Patiala

6.    State Bank of Travancore

7.    SBI Commercial and International Bank Ltd.

ii.    FOREIGN BANKING SUBSIDIARIES

1.    SBI (Mauritius) Ltd.

2.    State Bank of India (Canada)

3.    State Bank of India (California)

4.    Commercial Bank of India LLC, Moscow (##)

5.    PT Bank SBI Indonesia

6.    Nepal SBI Bank Ltd.

iii.    DOMESTIC NON-BANKING SUBSIDIARIES

1.    SBI Capital Markets Limited

2.    SBI DFHI Limited

3.    SBI Mutual Funds Trustee Company Pvt. Ltd

4.    SBI CAP Securities Ltd.

5.    SBI CAPS Ventures Ltd.

6.    SBI CAP Trustees Co. Ltd.

7.    SBI Cards & Payment Services Pvt. Ltd. (##)

8.    SBI Funds Management Pvt. Ltd. (##)

9.    SBI Life Insurance Company Ltd. (##)

10.    SBI Pension Fund Private Limited

11.    SBI Custodial Services Private Limited (##)

12.    SBI Global Factors Ltd.

13.    SBI General Insurance Company Ltd (##)

14.    SBI Payment Services Pvt Ltd

iv.    FOREIGN NON-BANKING SUBSIDIARIES
1.    SBICAP (UK) Ltd.

2. SBI Funds Management (International) Private Ltd.(##) ## These
entities are jointly controlled.

B.    JOINTLY CONTROLLED ENTITIES

1.    GE Capital Business Process Management Services Pvt. Ltd

2.    C-Edge Technologies Ltd.

3.    Macquarie SBI Infrastructure Management Pte. Ltd.

4.    Macquarie SBI Infrastructure Trustees Ltd.

5.    SBI Macquarie Infrastructure Management Pvt Ltd.

6.    SBI Macquarie Infrastructure Trustees Pvt Ltd.

C.    ASSOCIATES

i.    Regional Rural Banks

1.    Andhra Pradesh Grameena Vikas Bank

2.    Arunachal Pradesh Rural Bank

3.    Cauvery Kalpatharu Grameena Bank

4.    Chhattisgarh Gramin Bank

5.    Deccan Grameena Bank

6.    Ellaquai Dehati Bank

7.    Meghalaya Rural Bank

8.    Krishna Grameena Bank

9.    Langpi Dehangi Rural Bank

10.    Madhya Bharat Gramin Bank

11.    Malwa Gramin Bank

12.    Marwar Ganganagar Bikaner Gramin Bank

13.    Mizoram Rural Bank

14.    Nagaland Rural Bank

15.    Parvatiya Gramin Bank

16.    Purvanchal Kshetriya Gramin Bank

17.    Samastipur Kshetriya Gramin Bank
18.    Saurashtra Gramin Bank

19.    Utkal Gramya Bank

20.    Uttaranchal Gramin Bank

21.    Vananchal Gramin Bank

22.    Vidisha Bhopal Kshetriya Gramin Bank

ii.    Others

1.    SBI Home Finance Limited

2.    Clearing Corporation of India Ltd.

3.    Bank of Bhutan

4.    UTI Asset Management Company Pvt. Ltd.   (upto 19.01.2010)

5.    S. S. Ventures Services Ltd.

6. Nepal SBI Bank Ltd (upto 13.06.2009)* * Became subsidiary of SBI
w.e.f. 14.06.2009

D.    Key Management Personnel of the Bank

1.    Shri O. P. Bhatt, Chairman

2.    Shri S. K. Bhattacharyya, Managing Director

3.    Shri R. Sridharan, Managing Director

2.    Parties with whom transactions were entered into during the year

No disclosure is required in respect of related parties, which are
State- controlled Enterprises as per paragraph 9 of Accounting
Standard (AS) 18. Further, in terms of paragraph 5 of AS 18,
transactions in the nature of Banker-Customer relationship are not
required to be disclosed in respect of Key Management Personnel and
relatives of Key Management Personnel. Other particulars are as under:

1.    C-Edge Technologies Ltd.

2.    GE Capital Business Process Management Services Pvt. Ltd.

3.    Macquarie SBI Infrastructure Management Pie. Ltd.

4.    Macquarie SBI Infrastructure Trustees Ltd.

5.    SBI Macquarie Infrastructure Management Pvt Ltd.

6.    SBI Macquarie Infrastructure Trustees Pvt Ltd.

7.    Bank of Bhutan

8.    Nepal SBI Bank Ltd (upto 13.06.2009)
9.    SBI Home Finance Ltd.

10.    S. S. Ventures Services Ltd

11.    Shri O. P. Bhatt, Chairman

12.    Shri S. K. Bhattacharyya, Managing Director

13.    Shri R. Sridharan, Managing Director

g) Accounting for Taxes on Income

i. During the year, Rs. 1407.75 Crores [Previous Year Rs. 1055.10
Crores] has been credited to Profit and Loss Account by way of
adjustment of deferred tax.

ii. The Bank has outstanding net deferred tax asset of Rs. 2512.09
Crores (Previous Year- Rs. 1026.89 Crores), which has been included in
other assets-others and other liabilities-others respectively. The
breakup of deferred tax assets and liabilities into major items is
given below:

j) Impairment of Assets

In the opinion of the Banks Management, there is no impairment to the
assets during the year to which Accounting Standard 28 - Impairment of
Assets applies.

k) Provisions, Contingent Liabilities & Contingent Assets

a) Break-up of Provisions

Particulars                          Current Year    Previous Year

Provision for Taxation

-Current Tax                             6166.62         5971.52

-Fringe Benefit Tax                         0.00          142.00

-Deferred Tax                           -1407.75        -1055.10

-Other Tax                                  1.16            1.00

Provision for Depreciation
on Investments                           -987.99          707.16

Provision on Non-Performing Assets       4622.33         2474.96

Provision on Restructured Assets          525.53            0.00

Provision for Agricultural Debt Waiver
& Relief Scheme                             0.00          140.00

Provision on Standard Assets               80.06          234.82
Provision for Other Assets            154.90            177.64

Total                                9154.86           8794.00

18.B Agricultural Debt Waiver and Debt Relief Scheme 2008

As per the Agricultural Debt Waiver and Debt Relief Scheme 2008, the
amount receivable from the Central Government on account of debt waiver
being Rs. 5307 Crores (net of receipts of Rs 3424 crores) and debt
relief being Rs. 903.31 crore (net of receipts of Rs 226.69 crores) are
treated as part of advances in accordance with the scheme read with
circular issued by RBI.

The Central Government has recently extended the last date of payment
by eligible farmers under Debt Relief Scheme from 31.12.2009 to
30.06.2010. In accordance with the scheme read with circular issued by
RBI in this regard the dues amounting to Rs 1068 crores by such
eligible farmers (net of recovery of Rs 2591 crores and write off of
Rs 284 crores) as of 31.03.2010 has been classified as Standard
Advances under IRAC norms.

18.9 Amalgamation of State Bank of Indore

Pursuant to a scheme of Amalgamation approved by the Central Board at
its meeting on 19th June 2009, State Bank of Indore, where SBI holds
98.05% stake, is to be merged with the Bank. The Government of India
has accorded sanction to the Bank for entering into negotiations for
acquiring the business, including assets and liabilities of State Bank
of Indore.

18.10 Inter Office Account

Inter Office Accounts between branches, controlling offices and local
head offices and corporate centre establishments have been reconciled
up to December 2009. Further, reconciliation is being done on an
ongoing basis and no material effect is expected on the profit and loss
account of die current year.

18.11 Pending Wage Agreement Implementation

The Eighth Bipartite Settlement entered into by the Indian Banks
Association on behalf of the member Banks with the All India Unions of
Workmen expired on 31st October 2007. The New Agreement has been
executed on 27th April 2010 to be effective from 1st November 2007 for
workers as well as officers. Pending receipt of detailed circular from
DBA regarding revisions after due approval from the Central Government
and detailed computations to be carried out by the Bank , a provision
of Rs.2559 Crores (including Rs 627 crores for the period from
1.11.2007 to 31.03.2009 on revision of estimated % from 13.25 to 17.50)
has been created during the year as against Rsl414 crores created in
the previous year and Rs 575 crores during 2007-08. The total provision
held on account of wage revision as on 31st March 2010 is Rs 4569.55
Crores (including Rs 21.55 crores transferred from eSBS).

18.12 Provisioning for Gratuity

The Payment of Gratuity (Amendment) Bill, 2010 has been passed by the
Parliament increasing the celing from Rs 3.50 lakh to Rs 10 lakh.
 However pending enactment and subsequent notification by the Central
 Government about applicability , effective date and the terms thereof
 and the finalisation of salaries and wage revision as refered in para
 18.11 above, the provision for Gratuity has been created actuarially in
 line with Accounting Policy No. ll-2(i)(c) during the year. The impact
 arising out of such proposed change is not ascertainable at present.

 18.13. The figures of the current period include the working results
 of the branches of erstwhile State Bank of Saurashtra (SBS), consequent
 to its merger with the Bank in August 2008. Hence, the figures of the
 previous period are strictly not comparable.

 18.14. In terms of RBI letter No. DBOD.BP.No. 19264/21.04.018/2009-10
 dated 11.05.2010,RBI has permitted to transfer entries in inter branch
 account outstanding for a period of 10 years i.e. pertaining to the
 year 1999-2000. Accordingly, a net credit of Rs 60.15 crores has been
 transferred to Profit and Loss account . An amount of Rs 29.51 crores
 (net of taxes and Statutory Reserves ) has therefore been transferred
 to General Reserve.

 18.15. During the year the Bank has contributed Rs 92 crores to SBI
 Retired Employees Medical Benefit Trust.

 18.16. Previous period figures have been regrouped/reclassified,
 wherever necessary, to conform to current period classification. In
 cases where disclosures have been made for the first time in terms of
 RBI guidelines /Accounting Standards, previous years figures have not
 been mentioned.


Accounting Policy                                                          Year : Mar '10

A.    Basis of Preparation

 The accompanying financial statements have been prepared under the
 historical cost convention as modified for derivatives and foreign
 currency transactions, as enumerated in Part C below. They conform to
 Generally Accepted Accounting Principles (GAAP) in India, which
 comprise the statutory provisions, guidelines of regulatory
 authorities, Reserve Bank of India (RBI), accounting standards/guidance
 notes issued by the Institute of Chartered Accountants of India (ICAI),
 and the practices prevalent in the banking industry in India.

 B.   Use of Estimates

 The preparation of financial statements requires the management to make
 estimates and assumptions considered in the reported amounts of assets
 and liabilities (including contingent liabilities) as of the date of
 the. financial statements and the reported income and expenses during
 the reporting period. Management believes that the estimates used in
 the preparation of the financial statements are prudent and reasonable.
 Future results could differ from these estimates. Any revision to the
 accounting estimates is recognised prospectively in the current and
 future periods.
C.   PRINCIPAL ACCOUNTING POLICIES 1.   Revenue recognition

1.1 Income and expenditure are accounted on accrual basis, except
otherwise stated below. In respect of banks foreign offices, income is
recognised as per the local laws of the country in which the respective
foreign office is located.

1.2 Interest income is recognised in the Profit and Loss Account as it
accrues except (i) income from non- performing assets (NPAs),
comprising .of advances, leases and investments, which is recognised
upon realisation, as per the prudential norms prescribed by the RBI/
respective country regulators (hereafter collectively referred to as
Regulatory Authorities), (ii) interest on application money on
investments (iii) overdue interest on investments and bills discounted,
(iv) Income on Rupee Derivatives designated as Trading

1.3 Profit or-loss on sale of investments is credited / debited to
Profit and Loss Account (Sale of Investments). Profit on sale of
investments in the Held to Maturity category shall be appropriated
net of applicable taxes to Capital Reserve Account. Loss on sale will
be recognized in the Profit and Loss Account.

1.4 Income from finance leases is calculated by applying the interest
rate implicit in the lease to the net investment outstanding on the
lease, over the primary lease period. Leases effective from April 1,
2001 are accounted as advances at an amount equal to the net investment
in the lease. The lease rentals are apportioned between principal and
finance income based on a pattern reflecting a constant periodic return
on the net investment outstanding in respect of finance leases. The
principal amount is utilized for reduction in balance of net investment
in lease and finance income is reported-as interest income.

1.5 Income (other than interest) on investments in Held to Maturity
(HTM) category acquired at a discount to the face value, is recognised
as follows :

a) On Interest bearing securities, it is recognised only at the time of
sale/ redemption.

b) On zero-coupon securities, it is accounted for over the balance
tenor of the security on a constant yield basis.

1.6 Dividend is accounted on an accrual basis where the right to
receive the dividend is established.

1.7 All other commission and fee incomes are recognised on their
realisation except for (i) Guarantee commission on deferred payment
guarantees, which is spread over the period of the guarantee and (ii)
Commission on Government Business, which is recognised as it accrues.

1.8 One time Insurance Premium paid under Special Home Loan Scheme
(December 2008 to June 2009) is amortised over average loan period of
15 years.

2.   Investments

Investments are accounted for in accordance with the extant regulatory
guidelines. The bank follows trade date method for accounting of its
investments.

2.1 Classification

Investments are classified into 3 categories, viz. Held to Maturity,
Available for Sale and Held for Trading categories (hereafter called
categories). Under each of these categories, investments are further
classified into the following six groups:

i.    Government Securities,

ii.    Other Approved Securities,

iii.    Shares,

iv.    Debentures and Bonds,

v.    Subsidiaries/Joint ventures and

vi.    Others.

2.2 Basis of classification

i. Investments that the Bank intends to hold till maturity are
classified as Held to Maturity.

ii. Investments that are held principally for resale within 90 days
from the date of purchase are classified as Held for Trading.

iii. Investments, which are not classified in the above two categories,
are classified as Available for Sale.

iv. An investment is classified as Held to Maturity, Available for Sale
or Held for Trading at the time of its purchase and subsequent shifting
amongst categories is done in conformity with regulatory guidelines.

v. Investments in subsidiaries, joint ventures and associates are
classified under Held to Maturity.

2.3 Valuation

i. In determining the acquisition cost of an investment:

(a) Brokerage/commission received on subscriptions is reduced from the
cost.

(b) Brokerage, commission, securities transaction tax etc. paid in
connection with acquisition of investments are expensed upfront and
excluded from cost.

(c) Broken period interest paid / received on debt instruments is
treated as interest expense/income and is excluded from cost/sale
consideration.

(d) Cost is determined on the weighted average cost method.
(e) The transfer of a security amongst the above three categories is
accounted for at the least of acquisition cost/book value/market value
on the date of transfer, and the depreciation, if any, on such transfer
is fully provided for.

ii. Treasury Bills and Commercial Papers are valued at carrying cost.

iii. Held to Maturity category: Each scrip under Held to Maturity
category is carried at its acquisition cost or at amortised cost, if
acquired at a premium over the face value. Any premium on acquisition
is amortised over the remaining maturity period of the security on
constant yield basis. Such amortisation of premium is adjusted against
income under the head interest on investments. A provision is made
for diminution, other than temporary. Investments in subsidiaries,
joint ventures and associates (both in India and abroad) are valued at
historical cost except for investments in Regional Rural Banks, which
are valued at carrying cost (i.e book value).

iv.   Available for Sale and Held for Trading categories:

Each scrip in the above two categories is revalued at the market price
or fair value determined as per Regulatory guidelines, and only the net
depreciation of each group for each category is provided for and net
appreciation, is ignored. On provision for depreciation, the book value
of the individual securities remains unchanged after marking to market.

v. Security receipts issued by an asset reconstruction company (ARC)
are valued in accordance with the guidelines applicable to non-SLR
instruments. Accordingly, in cases where the security receipts issued
by the ARC are limited to the actual realisation of the financial
assets assigned to the instruments in the concerned scheme, the Net
Asset Value, obtained from the ARC, is reckoned for valuation of such
investments.

vi. Investments are classified as performing and non- performing, based
on the guidelines issued by the RBI in case of domestic offices and
respective regulators in case of foreign offices. Investments of
domestic offices become non performing where:

(a) Interest/installment (including maturity proceeds) is due and
remains unpaid for more than 90 days.

(b) In the case of equity shares, in the event the investment in the
shares of any company is valued at Re. 1 per company on account of the
non availability of the latest balance sheet, those equity shares would
be reckoned as NPI.

(c) If any credit facility availed by the issuer is NPA in the books of
the bank, investment in any of the securities issued by the same issuer
would also be treated as NPI and vice versa.

(d) The above would apply mutatis-mutandis to preference shares where
the fixed dividend is not paid.

(e) The .investments in debentures/bonds, which are deemed to be in the
nature of advance, are also subjected to NPI norms as applicable to
investments.
(f) In respect of foreign offices, provisions for non performing
investments are made as per the local regulations or as per the norms
of RBI, whichever is higher.

vii. The Bank has adopted the Uniform Accounting Procedure prescribed
by the RBI for accounting of Repo and Reverse Repo transactions [other
than transactions Under the Liquidity Adjustment Facility (LAF) with
the RBI]. Accordingly, the securities sold/purchased under Repo/Reverse
repo are treated as outright sales/purchases and accounted for in the
Repo/Reverse Repo Accounts, and the entries are reversed on the date of
maturity. Costs and revenues are accounted as interest
expenditure/income, as , the case may be. Balance in Repo/Reverse Repo
Account is adjusted against the balance in the Investment Account.

viii. Securities purchased / sold under LAF with RBI are debited /
credited to Investment Account and reversed on maturity of the
transaction. Interest expended / earned thereon is accounted for as
expenditure / revenue.

3.   . Loans /Advances and Provisions thereon

3.1 Loans and Advances are classified as performing and non-performing,
based on the guidelines issued by the RBI. Loan assets become
non-performing where:

i. In respect of term loan, interest and/or instalment of principal
remains overdue for a period of more than 90 days;

ii. In respect of an Overdraft or Cash Credit advance, the account
remains out of order, i.e. if the outstanding balance exceeds the
sanctioned limit/ drawing power continuously for a period of 90 days,
or if there are no credits continuously for 90 days as on the date of
balance-sheet, or if the credits are not adequate to cover the interest
due during the same period;

iii. In respect of bills purchased/discounted, the bill remains overdue
for a period of more than 90 days;

iv. In respect of agricultural advances for short duration crops, where
the instalment of principal or interest remains overdue for 2 crop
seasons;

v. In respect of agricultural advances for long duration crops, where
the principal or interest remains overdue for one crop season.

3.2 Non-Performing advances are classified into sub- standard, doubtful
and loss assets, based on the following criteria stipulated by RBI:

i. Sub-standard: A loan asset that has remained non-performing for a
period less than or equal to 12 months.

ii. Doubtful: A loan asset that has remained in the sub-standard
category for a period of 12 months.

iii. Loss: A loan asset where loss has been identified but the amount
has not been fully written off.
3-4 ,In respect of foreign offices, provisions for non performing
advances are made as per the local regulations or as per the norms of
RBI, whichever is higher.

3.5 The Sale of NPAs is accounted as per guidelines   prescribed by the
RBI, which requires provisions to

- .be made for any-deficit (where sale price is lower than the net book
value), while surplus (where sale price is higher than the net book
value) is ignored. Net book Value is outstandings as reduced by
specific provisions held and ECGC. claims received.

3.6 Advances are net of specific .loan loss provisions, unrealised
interest, ECGC claims received and bills redisCounted.

3.7 For restructured/rescheduled assets, provisions are made in
accordance with the guidelines issued by RBI, which requires that the
present value of future interest due as per the. original loan
agreement, compared with the present value of the interest expected to
be earned under the restructuring package, be provided in addition to
provision for NPAs. The provision for interest sacrifice, arising put
of the above, is reduced from advances.

3.8 In the Gase of loan accounts classified as NPAs, an account may be
reclassified as a performing account if it conforms to the guidelines
prescribed by the regulators.

3.9 Amounts recovered against debts written t>ff in earlier ¦ years,
arerecognised as revenue,.

3.10 Unrealised Interest recognised in the previous year on advances
which have become non-performing during the current year, is provided
for.

3.11 In addition to the specific provision on NPAs, general provisions
are also made for standard assets as per the extant guidelines
prescribed by the RBI. The provisions on standard assets are not
reckoned for arriving at net NPAs. These provisions are reflected in
Schedule 5 of thebalance sheet under the head Other Liabilities &
Provisions - Others.

4.   Floating Provisions

In accordance with the Reserve* Bank of India guidelines, (he-bank has
an approved policy for creation.and utilisation of floating provisions
separately for advances, investments and general purpose. The quantum
of floating provisions to be created would be assessed, at, the end of
each financial year. The floating provisions would be utilised only
for contingencies under extra ordinary circumstances specified in the
policy with prior permission of Reserve Bank of India.

5.   Provision for Country Exposure

In addition to the specific provisions held according to the asset
classification status, provisions are held for individual country
exposures (other than the home country). Countries are categorised into
seven risk categories, namely, insignificant, low, moderate, high, very
high, restricted and off-credit, and provisioning made as - per extant
RBI guidelines. If the country exposure Inet) Of the bank in respect of
each country does not exceed 1% of the total funded assets, no
provision is maintained on such country, exposures. The provision is
reflected in schedule 5 of the balance sheet under the Other
liabilities & Provisions - Others.

6.   Derivatives

6.1 The Bank enters into derivative contracts, such as , ; foreign
currency options, interest rate swaps, currency swaps, and cross
currency interest rate swaps and forward rate agreements in order to
hedge on-balance sheet/ off-balance sheet assets and liabilities or for
trading purposes. The swap contracts: entered to hedge on-balance sheet
assets and liabilities are structured in such a way that they bear an
opposite and offsetting ¦ impact with; the underlying on-balance
sheet items. The impact of such derivative instruments is correlated
with the. movement of the underlying assets and accounted in accordance
with the principles of hedge accounting.

6.2 Derivative contracts classified as hedge are recorded oil accrual
basis. Hedge contracts are not marked to market unless the underlying
Assets / Liabilities are also marked to .market.,

6.3 Except as mentioned above, all other derivative contracts are
marked to market as per the generally accepted practices prevalent in
the industry. In respect of derivative contracts that are marked to
market, changes in the market value are recognised in the profit and
loss account in the period of change. Any receivable under derivatives
contracts, which remain overdue for more than 90 days, are reversed
through profit and loss account,

6.4 Option premium paid or received is recorded in profit and loss
account at the expiry of the option. The Balance in the premium
received on options sold and premium paid on options bought have been
considered t& arrive at Mark to Market value for forex Over the Counter
options,

6.5 ,Exchange Traded Foreign Exchange and Interest Rate Futures entered
into for trading purposes are valued at prevailing market rates based
on quoted and observable market prices and the resultant gains and
tosses are,recognized in the Profit and Loss Account.

7.   Fixed Assets and Depreciation

7.1 Fixed assets are carried at cost less accumulated depreciation.

7.2 Cost-- inchides cost of purchase and all expenditure such as -site
preparation, installation costs and professional fees incurred on the
asset before it is put to use. Subsequent expenditure incurred on
assets put to use is capitalised only when it increases the future
benefits from such assets or their functioning capability.

7.4 In respect of assets acquired for domestic operations during the
year, depreciation is charged for half an year in respect of assets
used for upto 182 days and for the full year in respect of assets used
for more than 182 days, except depreciation on computers, ATM and
software, which is charged for the full year irrespective of the period
for which the asset was put to use.

7.5 Items costing less than Rs. 1,000 each are charged off in the year
of purchase.

7.6 In respect of leasehold premises, the lease premium, if any, is
amortised over the period of lease and the lease rent is charged in the
respective year.

7.7 In respect of assets given on lease by the Bank on or before 311
March 2001, the value of the assets given on lease is disclosed as
Leased Assets under fixed assets, and the difference between the annual
lease charge (capital recovery) and the depreciation is taken to Lease
Equalisation Account.

7.8 In respect of fixed assets held at foreign offices, depreciation is
provided as per the regulations /norms of the respective countries.

8.    Leases

The asset classification and provisioning norms applicable to advances,
as laid down in Para 3 above, are applied to financial leases also.

9.    Impairment of Assets

Fixed Assets are reviewed for impairment whenever events or changes in
circumstances warrant that the carrying amount of an asset may not be
recoverable. Recoverability of assets to be held and used is measured
by a comparison of the carrying amount of an asset to future net
discounted cash flows expected to be generated by the asset. If such
assets are considered to be impaired, the impairment to be recognised
is measured by the amount by which the carrying amount of the asset
exceeds the fair value of the asset.

10.    Effect of changes in the foreign exchange rate

10.1 Foreign Currency Transactions

i. Foreign currency transactions are recorded on initial recognition
in the reporting currency by applying to the foreign currency amount
the exchange rate between the reporting currency and the foreign
currency on the date of transaction.

ii. Foreign currency monetary items are reported using the Foreign
Exchange Dealers Association of India (FEDAI) closing spot/forward
rates.

iii. Foreign currency non-monetary items, which are carried in terms at
historical cost, are reported using the exchange rate at the date of
the transaction.

iv. Contingent liabilities denominated in foreign currency are reported
using the FEDAI closing spot rates.

v. Outstanding foreign exchange spot and forward contracts held for
trading are revalued at the exchange rates notified by FEDAI for
specified maturities, and the resulting profit or loss is included in
the Profit and Loss account.

vi. Foreign exchange forward contracts which are not intended for
trading and are outstanding at the balance sheet date, are valued at
the closing spot rate. The premium or discount arising at the inception
of such a forward exchange contract is amortised as expense or income
over the life of the contract.

vii. Exchange differences arising on the settlement of monetary items
at rates different from those at which they were initially recorded are
recognised as income or as expense in the period in which they arise.

viii. Gains / Losses on account of changes in exchange rates of open
position in currency futures trades are settled with the exchange
clearing house on daily basis and such gains / losses are recognised in
the profit and loss account.

10.2 Foreign Operations

Foreign Branches of the Bank and Offshore Banking Units have been
classified as Non-integral Operations and Representative Offices have
been classified as Integral Operations.

a.   Non-integral Operations

i. Both monetary and non-monetary foreign currency assets and
liabilities including contingent liabilities of non-integral foreign
operations, are translated at closing exchange rates notified by FEDAI
at the balance sheet date.

ii. Income and expenditure of non-integral foreign operations ace
translated at quarterly average closing rates.

iii. Exchange differences arising on net investment in non-integral
foreign operations are . accumulated in Foreign Currency Translation
Reserve until the disposal of the net investment.

iv. The Assets and Liabilities of foreign offices in foreign currency
(other than local currency of the foreign offices) are translated into
local currency using spot rates applicable to that country.

b.   Integral Operations

i. Foreign currency transactions are recorded on initial recognition in
the reporting currency by applying to the foreign currency amount the
exchange rate between the reporting currency and the foreign currency
on the date of transaction.

ii. Monetary foreign currency assets and liabilities of integral
foreign operations are translated at closing exchange rates notified by
FEDAI at the balance sheet date and the resulting profit/ loss is
included in the profit and loss account.

iii. Foreign currency non-monetary items which are carried in terms of
historical cost are reported using the exchange rate at the date of the
transaction.

11.    Employee Benefits

11.1 Short Term Employee Benefits

The undiscounted amount of short-term employee benefits, such as
medical benefits, casual leave etc. which are expected to be paid in
exchange for the services rendered by employees are recognised during
the period when the employee renders the service.

11.2 Post Employment Benefits

i.    Defined Benefit Plan

a. The Bank operates a Provident Fund scheme. All eligible employees
are entitled to receive benefits under the Banks Provident Fund
scheme. The Bank contributes monthly at a determined rate (currently
10% of employees basic pay plus eligible allowance). These
contributions are remitted to a trust established for this purpose and
are charged to Profit and Loss Account. The trust funds are retained as
deposits in the bank. The bank is liable for annual contributions and
interest on deposits held by the bank, which is payable at Government
specified minimum rate of interest on provident fund balances of
Government Employees. The bank recognises such annual contributions and
interest as an expense in the year to which they relate.

b. The bank operates gratuity and pension schemes which are defined
benefit plans.

c. The Bank provides for gratuity to all eligible employees. The
benefit is in the form of lump sum payments to vested employees on
retirement, on death while in employment, or on termination of
employment, for an amount equivalent to 15 days basic salary payable
for each completed year of service, subject to a maximum amount of Rs.
350,000. Vesting occurs upon completion of five years of service. The
Bank makes annual contributions to a fund administered by trustees
based on an independent external actuarial valuation carried out
annually.

d. The Bank provides for pension to all eligible employees. The
benefit is in the form of monthly payments as per rules and regular
payments to vested employees on retirement, on death while in
employment, or on termination of employment. Vesting occurs at
different stages as per rules. The pension liability is reckoned based
on an independent actuarial valuation carried out annually. The Bank
makes annual contribution to the pension fund at 10% of salary in terms
of SBI Pension Fund Rules. The balance is retained in the special
provision account to be utilised at the time of settlement.

e. The cost of providing defined benefits is determined using the
projected unit credit method, with actuarial valuations being carried
out at each balance sheet date. Actuarial gains/losses are immediately
recognised in the statement of profit and loss and are not deferred.

ii.    Other Long Term Employee benefits
a. All eligible employees of the bank are eligible for compensated
absences, silver jubilee award, leave travel concession, retirement
award and resettlement allowance. The costs of such long term employee
benefits are internally funded by the Bank.

b. The cost of providing other long term benefits is determined using
the projected unit credit method with actuarial valuations being
carried out at each balance sheet date. Past service cost is
immediately recognised in the statement of profit and loss and is not
deferred.

12.   Provision for Taxation

12.1 Income tax expense is the aggregate amount of current tax and
deferred tax. Current year taxes are determined in accordance with the
provisions of Accounting Standard 22 and tax laws prevailing in India
after taking into account taxes of foreign offices, which are based on
the tax laws of respective jurisdiction. Deferred tax adjustments
comprise of changes in the deferred tax assets or liabilities during
the period.

12.2 Deferred tax assets and liabilities are measured using tax rates
and tax laws that have been enacted or substantially enacted prior to
the balance sheet date. Deferred tax assets and liabilities are
recognised on a prudent basis for the future tax consequences of timing
differences arising between the carrying values of assets and
liabilities and their respective tax basis, and carry forward losses.
The impact of changes in the deferred tax assets and liabilities is
recognised in the profit and loss account,

12.3 Deferred tax assets are recognised and reassessed at each
reporting date, based upon managements judgement as to whether
realisation is considered certain. Deferred tax assets are recognised
on carry forward of unabsorbed depreciation and tax losses only if
there is virtual certainty that such deferred tax assets can be
realised against future profits.

13.   Earning per Share

13.1 The Bank reports basic and diluted earnings per share in
accordance with AS 20 -Earnings per Share issued by the ICAI. Basic
earnings per share are computed by dividing the net profit after tax by
the weighted average number of equity shares outstanding for the year.

13.2 Diluted earnings per share reflect the potential dilution that
could occur if securities or other contracts to issue equity shares
were exercised or converted during the year. Diluted earnings per share
are computed using the weighted average number of equity shares and
dilutive potential equity shares outstanding at year end.

14. Accounting for Provisions, Contingent Liabilities and Contingent
Assets

14.1 In conformity with AS 29, Provisions,   Contingent Liabilities and
Contingent Assets, issued by the Institute   of Chartered Accountants of
India, the Bank recognises provisions only   when it has a present
obligation as a result of a past event, it   is probable that an outflow
of resources embodying economic benefits will be required to settle the
 obligation, and when a reliable estimate of the amount of the
 obligation can be made.

 14.2 No provision is recognised for

 i. any possible obligation that arises from past events and the
 existence of which will be confirmed only by the occurrence or
 non-occurrence of one or more uncertain future events not wholly within
 the control of the Bank; or

 ii. any present obligation that arises from past events but is not
 recognised because

 a. it is not probable that an outflow of resources embodying economic
 benefits will be required to settle the obligation; or

 b.    a reliable estimate of the amount of obligation cannot be made.

 Such obligations are recorded as Contingent Liabilities. These are
 assessed at regular intervals and only that part of the obligation for
 which an outflow of resources embodying economic benefits is probable,
 is provided for, except in the extremely rare circumstances where no
 reliable estimate can be made.

 14.3 Contingent Assets are not recognised in the financial statements
 as this may result in the recognition of income that may never be
 realised.

 15.    Cash and cash equivalents

 Cash and cash equivalents include cash on hand and in ATMs, and gold
 in hand, balances with RBI, balances with other banks, and money at
 call and short notice.

 16.    Employee Share Purchase Scheme

 In accordance with the Employee Stock Option Scheme and Employee Stock
 Purchase Scheme Guidelines, 1999 issued by the Securities and Exchange
 Board of India (SEBI), the excess of market price one day prior to
 the date of issue of the shares over the price at which they are issued
 is recognised as employee compensation cost.

 17.    Share Issue Expenses

 Share issue expenses are charged to the Share Premium Account.


                                               --------------------------- in Rs. Cr.
Finished Products                                                                                  Mar 2010
                                               ---------------------------

Product Name                            Unit   Installed           Production           Sales      Sales
                                               Capacity            Quantity             Quantity   Value

Interest & Discount on Advances & Bills -      NA                  NA                   NA         50,632.64
Income From Investment                  -                 NA               NA        NA          17,736.30

Income From Brokerage & Commission -                      NA               NA        NA          9,640.86

Income From Sale Of Share & Securities -                  NA               NA        NA          2,116.79

Interest On Balances with RBI and       -                 NA               NA        NA          1,511.92
Other Inter-Bank Funds

Interest                                -                 NA               NA        NA          1,113.06

Income From Dividend                    -                 NA               NA        NA          573.48

Lease Rentals                           -                 NA               NA        NA          9.19

Income From Finance                     -                 NA               NA        NA          0.00

Lease / H.P Management Fees             -                 NA               NA        NA          0.00

Others                                  -                 NA               NA        NA          0.00


Total                                                                                            83,334.24

Competition

                           Last Price       Market Cap.        Net Interest     Net Profit   Total Assets
                                            (Rs. cr.)          Income

SBI                        2,265.05         143,804.09         70,993.92        9,166.05     964,432.08

PNB                        1,046.20         32,986.95          21,466.91        3,905.35     296,632.79

Bank of Baroda             715.55           26,155.50          16,698.34        3,058.33     278,316.71

Bank of India              357.00           18,774.99          17,877.99        1,741.07     274,966.46

Canara Bank                451.25           18,501.25          18,751.96        3,021.43     264,741.09

Union Bank                 310.80           15,699.06          13,302.68        2,074.92     195,161.85

Indian Bank                220.70           9,485.02           7,857.06         1,554.99     84,121.74

IDBI Bank                  119.25           8,643.98           15,272.63        1,031.13     233,572.01

Oriental Bank              320.30           8,024.79           8,856.47         905.42       137,431.00
Corporation Ban                514.90            7,385.73             7,294.60        1,170.25   111,667.30


Company Facts - SBI
Registered Address
State Bank Bhavan,
Central Office,,8th Floor, Madame Cama Marg,
Mumbai
Maharashtra
400021


Tel: 022-22883888 22022678
Fax: 022-22855348
Email: investor.complaints@sbi.co.in
Website: http://www.sbi.co.in
Group: SBI Group

Explore SBI connections
Registrars
Datamatics Financial Services Ltd. Plot Nos. A-16 & 17,
MIDC Part-B, Cross Lane,
Marol,
Andheri (E)


Tel: 66712151, 66712152, 66712153, 66712154, 66712155,
Fax: 66712161, 66712230
Email: Investorsqry@dfssl.com
Website: http://www.dfssl.com


Management - SBI
Name                                                        Designation
O P Bhatt                                                   Chairman / Chair Person
R Sridharan                                                 Managing Director
Dileep C Choksi                                             Director
D Sundaram                                                  Director
Md. Salahuddin Ansari                                       Director
Rajiv Kumar                                                 Director
Shyamala Gopinath                                           Director
Name                                                        Designation
S K Bhattacharyya                                           Managing Director
Ashok Jhunjhunwala                                          Director
S Venkatachalam                                             Director
Deva Nand Balodhi                                           Director
Vasantha Bharucha                                           Director
Ashok Chawla                                                Director
Listing Details - State Bank of India


Key Dates


Year Ending Month                                              Mar

AGM Date (Month)                                               Jun

Book Closure Date (Month)                                      Jun


Listing Information

Face Value Of Equity Shares                                    10

Market Lot Of Equity Shares                                    1

BSE Code                                                       500112

NSE Code                                                       SBIN

BSE Group                                                      A


Whether The Company Forms A Part Of The Following Indices -
Sensex                                                         Yes
Nifty                                                          Yes
BSE-100                                                        Yes
BSE-200                                                        Yes
S&P CNX 500                                                    Yes
CNX Midcap                                                     No
CNX FMCG                                                       No

Listing On

                                                               The Stock Exchange, Mumbai, National Stock Exchange of India
Listed On
                                                               Ltd., London Stock Exchange


AGM/EGM
Announcement       Purpose                Date              Book Closure         Remarks
Date                                                    From             To
11-05-2010         AGM                  16-06-2010   11-06-2010     16-06-2010   Rs.20.00 per share(200%)Dividend
18-05-2009         AGM                  19-06-2009   12-06-2009     19-06-2009   290% Dividend
01-12-2008         EGM                  12-01-2009        -               -      To elect one Director to the Central Board of the
                                                                                 Bank under the provisions of Section 19(c) read
                                                                                 with Section 25(2) of the State Bank of India Act,
                                                                                 1955.
Balance sheet of state bank of india (1)

Contenu connexe

Tendances

Presentation on state bank of india
Presentation on state bank of indiaPresentation on state bank of india
Presentation on state bank of indiaShaikh Mussaddik
 
SIP on Goods and Service Tax
SIP on Goods and Service TaxSIP on Goods and Service Tax
SIP on Goods and Service TaxLucky
 
Reverse mortgage at sbi mba finance project report
Reverse mortgage  at sbi mba finance project reportReverse mortgage  at sbi mba finance project report
Reverse mortgage at sbi mba finance project reportBabasab Patil
 
Project report on Wealth Management
Project report on Wealth ManagementProject report on Wealth Management
Project report on Wealth ManagementKhushbu Malara
 
REPORT on IT industry
REPORT on IT industry REPORT on IT industry
REPORT on IT industry Hitesh Gupta
 
FINANCIAL PERFORMANCE ANALYSIS OF BHARTI AIRTEL LIMITED
FINANCIAL PERFORMANCE ANALYSIS OF BHARTI AIRTEL LIMITEDFINANCIAL PERFORMANCE ANALYSIS OF BHARTI AIRTEL LIMITED
FINANCIAL PERFORMANCE ANALYSIS OF BHARTI AIRTEL LIMITEDyashmin khatun
 
Project on Bank of Baroda
Project on Bank of BarodaProject on Bank of Baroda
Project on Bank of BarodaAshish1004
 
Finance project report on a study on financial derivatives ...
Finance project report on a study on  financial derivatives                  ...Finance project report on a study on  financial derivatives                  ...
Finance project report on a study on financial derivatives ...Mba projects free
 
Summer internship project on home loans
Summer internship project on home loansSummer internship project on home loans
Summer internship project on home loansSomendra Singh
 
Fundamental analysis of banking sector SBI AND HDFC BANK
Fundamental analysis of banking sector SBI AND HDFC BANKFundamental analysis of banking sector SBI AND HDFC BANK
Fundamental analysis of banking sector SBI AND HDFC BANKJeetu Matta
 
Equity analysis of telecom sector for anand rathi securities by shilpa mandhan
Equity analysis of telecom sector for anand rathi securities by shilpa mandhanEquity analysis of telecom sector for anand rathi securities by shilpa mandhan
Equity analysis of telecom sector for anand rathi securities by shilpa mandhanINDUS EXIMTECH PVT. LTD
 
A project report on fundamental analysis of mahindra&mahindra company
A project report on fundamental analysis of mahindra&mahindra companyA project report on fundamental analysis of mahindra&mahindra company
A project report on fundamental analysis of mahindra&mahindra companyBabasab Patil
 
FINANCIAL ANALYSIS OF RELIANCE JIO PDF.pdf
FINANCIAL ANALYSIS OF RELIANCE JIO PDF.pdfFINANCIAL ANALYSIS OF RELIANCE JIO PDF.pdf
FINANCIAL ANALYSIS OF RELIANCE JIO PDF.pdfVismayTyagi
 
Tata Motors – Ratio Analysis
Tata Motors – Ratio AnalysisTata Motors – Ratio Analysis
Tata Motors – Ratio AnalysisJitendra
 
A project report on investment strategies and portfolio management at standar...
A project report on investment strategies and portfolio management at standar...A project report on investment strategies and portfolio management at standar...
A project report on investment strategies and portfolio management at standar...Projects Kart
 
Analysis of Financial Statements of Tata Consultancy Services in 2020
Analysis of Financial Statements of Tata Consultancy Services in 2020Analysis of Financial Statements of Tata Consultancy Services in 2020
Analysis of Financial Statements of Tata Consultancy Services in 2020GurbaniLuthra
 

Tendances (20)

Presentation on state bank of india
Presentation on state bank of indiaPresentation on state bank of india
Presentation on state bank of india
 
SIP on Goods and Service Tax
SIP on Goods and Service TaxSIP on Goods and Service Tax
SIP on Goods and Service Tax
 
BHAFIN 1QFY18
BHAFIN 1QFY18BHAFIN 1QFY18
BHAFIN 1QFY18
 
Reverse mortgage at sbi mba finance project report
Reverse mortgage  at sbi mba finance project reportReverse mortgage  at sbi mba finance project report
Reverse mortgage at sbi mba finance project report
 
Project report on Wealth Management
Project report on Wealth ManagementProject report on Wealth Management
Project report on Wealth Management
 
REPORT on IT industry
REPORT on IT industry REPORT on IT industry
REPORT on IT industry
 
FINANCIAL PERFORMANCE ANALYSIS OF BHARTI AIRTEL LIMITED
FINANCIAL PERFORMANCE ANALYSIS OF BHARTI AIRTEL LIMITEDFINANCIAL PERFORMANCE ANALYSIS OF BHARTI AIRTEL LIMITED
FINANCIAL PERFORMANCE ANALYSIS OF BHARTI AIRTEL LIMITED
 
Project on Bank of Baroda
Project on Bank of BarodaProject on Bank of Baroda
Project on Bank of Baroda
 
Finance project report on a study on financial derivatives ...
Finance project report on a study on  financial derivatives                  ...Finance project report on a study on  financial derivatives                  ...
Finance project report on a study on financial derivatives ...
 
Summer internship project on home loans
Summer internship project on home loansSummer internship project on home loans
Summer internship project on home loans
 
Blackbook project
Blackbook projectBlackbook project
Blackbook project
 
Fundamental analysis of banking sector SBI AND HDFC BANK
Fundamental analysis of banking sector SBI AND HDFC BANKFundamental analysis of banking sector SBI AND HDFC BANK
Fundamental analysis of banking sector SBI AND HDFC BANK
 
Equity analysis of telecom sector for anand rathi securities by shilpa mandhan
Equity analysis of telecom sector for anand rathi securities by shilpa mandhanEquity analysis of telecom sector for anand rathi securities by shilpa mandhan
Equity analysis of telecom sector for anand rathi securities by shilpa mandhan
 
Bajaj finance ltd.
Bajaj finance ltd.Bajaj finance ltd.
Bajaj finance ltd.
 
Synopsis
SynopsisSynopsis
Synopsis
 
A project report on fundamental analysis of mahindra&mahindra company
A project report on fundamental analysis of mahindra&mahindra companyA project report on fundamental analysis of mahindra&mahindra company
A project report on fundamental analysis of mahindra&mahindra company
 
FINANCIAL ANALYSIS OF RELIANCE JIO PDF.pdf
FINANCIAL ANALYSIS OF RELIANCE JIO PDF.pdfFINANCIAL ANALYSIS OF RELIANCE JIO PDF.pdf
FINANCIAL ANALYSIS OF RELIANCE JIO PDF.pdf
 
Tata Motors – Ratio Analysis
Tata Motors – Ratio AnalysisTata Motors – Ratio Analysis
Tata Motors – Ratio Analysis
 
A project report on investment strategies and portfolio management at standar...
A project report on investment strategies and portfolio management at standar...A project report on investment strategies and portfolio management at standar...
A project report on investment strategies and portfolio management at standar...
 
Analysis of Financial Statements of Tata Consultancy Services in 2020
Analysis of Financial Statements of Tata Consultancy Services in 2020Analysis of Financial Statements of Tata Consultancy Services in 2020
Analysis of Financial Statements of Tata Consultancy Services in 2020
 

En vedette

Sbi statement jan,13 to jun,13
Sbi statement jan,13 to jun,13Sbi statement jan,13 to jun,13
Sbi statement jan,13 to jun,13Ritesh Mitra
 
Comparitive and common size
Comparitive and common sizeComparitive and common size
Comparitive and common sizeJaswinder Singh
 
Punjab National Bank Q1FY15: Sane performance sanity in the quarter
 Punjab National Bank Q1FY15: Sane performance sanity in the quarter Punjab National Bank Q1FY15: Sane performance sanity in the quarter
Punjab National Bank Q1FY15: Sane performance sanity in the quarterIndiaNotes.com
 
Investment Funds Advisory Today- Buy Stock of State Bank of India and neutral...
Investment Funds Advisory Today- Buy Stock of State Bank of India and neutral...Investment Funds Advisory Today- Buy Stock of State Bank of India and neutral...
Investment Funds Advisory Today- Buy Stock of State Bank of India and neutral...NARNOLIA SECURITIES LIMITED
 
Project on equity analysis on banking sector
Project on equity analysis on banking sectorProject on equity analysis on banking sector
Project on equity analysis on banking sectorHIMANI PADIA
 
Comparitive analysis of sbi bank and icici bank
Comparitive analysis of sbi bank and icici bankComparitive analysis of sbi bank and icici bank
Comparitive analysis of sbi bank and icici bankshweta248001
 
Report on financial statement for five years using trend, comparative & comm...
Report on financial statement for five years using trend, comparative  & comm...Report on financial statement for five years using trend, comparative  & comm...
Report on financial statement for five years using trend, comparative & comm...Sayen Upreti
 
A project report on financial statement analysis
A project report on financial statement analysisA project report on financial statement analysis
A project report on financial statement analysisProjects Kart
 
Employment News 11 - 17 February 2012(CIVIL SERVICES EXAMINATION, 2012)
Employment News 11 - 17 February 2012(CIVIL SERVICES EXAMINATION, 2012)Employment News 11 - 17 February 2012(CIVIL SERVICES EXAMINATION, 2012)
Employment News 11 - 17 February 2012(CIVIL SERVICES EXAMINATION, 2012)Consultant
 
2012 upsc-civil-services-preliminary-examination-notification
2012 upsc-civil-services-preliminary-examination-notification2012 upsc-civil-services-preliminary-examination-notification
2012 upsc-civil-services-preliminary-examination-notificationJames Rousseau
 
Projectonequityanalysisonbankingsector 131209101944-phpapp01
Projectonequityanalysisonbankingsector 131209101944-phpapp01Projectonequityanalysisonbankingsector 131209101944-phpapp01
Projectonequityanalysisonbankingsector 131209101944-phpapp012002199115
 
Final Croda Internation Plc (1)
Final Croda Internation Plc (1)Final Croda Internation Plc (1)
Final Croda Internation Plc (1)David Hanrahan
 
Samridhi business plan
Samridhi business planSamridhi business plan
Samridhi business planprabhat_rbl
 
SEBI - Insider Trading
SEBI - Insider TradingSEBI - Insider Trading
SEBI - Insider TradingBFSICM
 

En vedette (20)

Sbi statement jan,13 to jun,13
Sbi statement jan,13 to jun,13Sbi statement jan,13 to jun,13
Sbi statement jan,13 to jun,13
 
SBI -CSP- PPT
SBI -CSP- PPTSBI -CSP- PPT
SBI -CSP- PPT
 
Rural Banking
Rural BankingRural Banking
Rural Banking
 
Comparitive and common size
Comparitive and common sizeComparitive and common size
Comparitive and common size
 
Punjab National Bank Q1FY15: Sane performance sanity in the quarter
 Punjab National Bank Q1FY15: Sane performance sanity in the quarter Punjab National Bank Q1FY15: Sane performance sanity in the quarter
Punjab National Bank Q1FY15: Sane performance sanity in the quarter
 
Investment Funds Advisory Today- Buy Stock of State Bank of India and neutral...
Investment Funds Advisory Today- Buy Stock of State Bank of India and neutral...Investment Funds Advisory Today- Buy Stock of State Bank of India and neutral...
Investment Funds Advisory Today- Buy Stock of State Bank of India and neutral...
 
Project on equity analysis on banking sector
Project on equity analysis on banking sectorProject on equity analysis on banking sector
Project on equity analysis on banking sector
 
Comparitive analysis of sbi bank and icici bank
Comparitive analysis of sbi bank and icici bankComparitive analysis of sbi bank and icici bank
Comparitive analysis of sbi bank and icici bank
 
Report on financial statement for five years using trend, comparative & comm...
Report on financial statement for five years using trend, comparative  & comm...Report on financial statement for five years using trend, comparative  & comm...
Report on financial statement for five years using trend, comparative & comm...
 
A project report on financial statement analysis
A project report on financial statement analysisA project report on financial statement analysis
A project report on financial statement analysis
 
Employment News 11 - 17 February 2012(CIVIL SERVICES EXAMINATION, 2012)
Employment News 11 - 17 February 2012(CIVIL SERVICES EXAMINATION, 2012)Employment News 11 - 17 February 2012(CIVIL SERVICES EXAMINATION, 2012)
Employment News 11 - 17 February 2012(CIVIL SERVICES EXAMINATION, 2012)
 
2012 upsc-civil-services-preliminary-examination-notification
2012 upsc-civil-services-preliminary-examination-notification2012 upsc-civil-services-preliminary-examination-notification
2012 upsc-civil-services-preliminary-examination-notification
 
Projectonequityanalysisonbankingsector 131209101944-phpapp01
Projectonequityanalysisonbankingsector 131209101944-phpapp01Projectonequityanalysisonbankingsector 131209101944-phpapp01
Projectonequityanalysisonbankingsector 131209101944-phpapp01
 
CSP 2015 EXAM
CSP 2015 EXAMCSP 2015 EXAM
CSP 2015 EXAM
 
Final Croda Internation Plc (1)
Final Croda Internation Plc (1)Final Croda Internation Plc (1)
Final Croda Internation Plc (1)
 
Introducation of SBI
Introducation of SBI Introducation of SBI
Introducation of SBI
 
Samridhi business plan
Samridhi business planSamridhi business plan
Samridhi business plan
 
SEBI ACT 1992
SEBI ACT 1992SEBI ACT 1992
SEBI ACT 1992
 
Financial planning
Financial planningFinancial planning
Financial planning
 
SEBI - Insider Trading
SEBI - Insider TradingSEBI - Insider Trading
SEBI - Insider Trading
 

Similaire à Balance sheet of state bank of india (1)

Similaire à Balance sheet of state bank of india (1) (20)

Bank of rajasthan
Bank of rajasthanBank of rajasthan
Bank of rajasthan
 
MBL Infrastructure IPO
MBL Infrastructure IPOMBL Infrastructure IPO
MBL Infrastructure IPO
 
Cipla 20-09-2010
Cipla   20-09-2010Cipla   20-09-2010
Cipla 20-09-2010
 
Harpreet
HarpreetHarpreet
Harpreet
 
Jsw Ipo
Jsw IpoJsw Ipo
Jsw Ipo
 
Hul balance sheet
Hul balance sheetHul balance sheet
Hul balance sheet
 
Credit Analysis of HCC Excel
Credit Analysis of HCC ExcelCredit Analysis of HCC Excel
Credit Analysis of HCC Excel
 
Abch group results booklet 2010
Abch group results booklet 2010Abch group results booklet 2010
Abch group results booklet 2010
 
Financial Statement Analysis
Financial Statement AnalysisFinancial Statement Analysis
Financial Statement Analysis
 
Rahul Mehrotra Presentation on Reliance Financial Ratio
Rahul Mehrotra Presentation on Reliance Financial RatioRahul Mehrotra Presentation on Reliance Financial Ratio
Rahul Mehrotra Presentation on Reliance Financial Ratio
 
Competitor analysis
Competitor analysisCompetitor analysis
Competitor analysis
 
Pantaloon 2008 2009
Pantaloon 2008 2009Pantaloon 2008 2009
Pantaloon 2008 2009
 
regions SUPP 3Q 07.v6
regions SUPP 3Q 07.v6regions SUPP 3Q 07.v6
regions SUPP 3Q 07.v6
 
regions SUPP3Q/07.v6
regions SUPP3Q/07.v6regions SUPP3Q/07.v6
regions SUPP3Q/07.v6
 
regions SUPP 1Q 07 FINAL
regions SUPP 1Q 07 FINALregions SUPP 1Q 07 FINAL
regions SUPP 1Q 07 FINAL
 
regions SUPP 1Q 07 FINAL
regions SUPP 1Q 07 FINALregions SUPP 1Q 07 FINAL
regions SUPP 1Q 07 FINAL
 
regions SUPP 1Q 07FINAL
regions SUPP 1Q 07FINALregions SUPP 1Q 07FINAL
regions SUPP 1Q 07FINAL
 
regions SUPP 1Q 07FINAL
regions SUPP 1Q 07FINALregions SUPP 1Q 07FINAL
regions SUPP 1Q 07FINAL
 
Afs banking
Afs bankingAfs banking
Afs banking
 
Jobin
JobinJobin
Jobin
 

Dernier

mini mental status format.docx
mini    mental       status     format.docxmini    mental       status     format.docx
mini mental status format.docxPoojaSen20
 
SOCIAL AND HISTORICAL CONTEXT - LFTVD.pptx
SOCIAL AND HISTORICAL CONTEXT - LFTVD.pptxSOCIAL AND HISTORICAL CONTEXT - LFTVD.pptx
SOCIAL AND HISTORICAL CONTEXT - LFTVD.pptxiammrhaywood
 
Introduction to ArtificiaI Intelligence in Higher Education
Introduction to ArtificiaI Intelligence in Higher EducationIntroduction to ArtificiaI Intelligence in Higher Education
Introduction to ArtificiaI Intelligence in Higher Educationpboyjonauth
 
Contemporary philippine arts from the regions_PPT_Module_12 [Autosaved] (1).pptx
Contemporary philippine arts from the regions_PPT_Module_12 [Autosaved] (1).pptxContemporary philippine arts from the regions_PPT_Module_12 [Autosaved] (1).pptx
Contemporary philippine arts from the regions_PPT_Module_12 [Autosaved] (1).pptxRoyAbrique
 
Activity 01 - Artificial Culture (1).pdf
Activity 01 - Artificial Culture (1).pdfActivity 01 - Artificial Culture (1).pdf
Activity 01 - Artificial Culture (1).pdfciinovamais
 
18-04-UA_REPORT_MEDIALITERAСY_INDEX-DM_23-1-final-eng.pdf
18-04-UA_REPORT_MEDIALITERAСY_INDEX-DM_23-1-final-eng.pdf18-04-UA_REPORT_MEDIALITERAСY_INDEX-DM_23-1-final-eng.pdf
18-04-UA_REPORT_MEDIALITERAСY_INDEX-DM_23-1-final-eng.pdfssuser54595a
 
How to Make a Pirate ship Primary Education.pptx
How to Make a Pirate ship Primary Education.pptxHow to Make a Pirate ship Primary Education.pptx
How to Make a Pirate ship Primary Education.pptxmanuelaromero2013
 
“Oh GOSH! Reflecting on Hackteria's Collaborative Practices in a Global Do-It...
“Oh GOSH! Reflecting on Hackteria's Collaborative Practices in a Global Do-It...“Oh GOSH! Reflecting on Hackteria's Collaborative Practices in a Global Do-It...
“Oh GOSH! Reflecting on Hackteria's Collaborative Practices in a Global Do-It...Marc Dusseiller Dusjagr
 
Call Girls in Dwarka Mor Delhi Contact Us 9654467111
Call Girls in Dwarka Mor Delhi Contact Us 9654467111Call Girls in Dwarka Mor Delhi Contact Us 9654467111
Call Girls in Dwarka Mor Delhi Contact Us 9654467111Sapana Sha
 
Hybridoma Technology ( Production , Purification , and Application )
Hybridoma Technology  ( Production , Purification , and Application  ) Hybridoma Technology  ( Production , Purification , and Application  )
Hybridoma Technology ( Production , Purification , and Application ) Sakshi Ghasle
 
The Most Excellent Way | 1 Corinthians 13
The Most Excellent Way | 1 Corinthians 13The Most Excellent Way | 1 Corinthians 13
The Most Excellent Way | 1 Corinthians 13Steve Thomason
 
Accessible design: Minimum effort, maximum impact
Accessible design: Minimum effort, maximum impactAccessible design: Minimum effort, maximum impact
Accessible design: Minimum effort, maximum impactdawncurless
 
Industrial Policy - 1948, 1956, 1973, 1977, 1980, 1991
Industrial Policy - 1948, 1956, 1973, 1977, 1980, 1991Industrial Policy - 1948, 1956, 1973, 1977, 1980, 1991
Industrial Policy - 1948, 1956, 1973, 1977, 1980, 1991RKavithamani
 
Z Score,T Score, Percential Rank and Box Plot Graph
Z Score,T Score, Percential Rank and Box Plot GraphZ Score,T Score, Percential Rank and Box Plot Graph
Z Score,T Score, Percential Rank and Box Plot GraphThiyagu K
 
URLs and Routing in the Odoo 17 Website App
URLs and Routing in the Odoo 17 Website AppURLs and Routing in the Odoo 17 Website App
URLs and Routing in the Odoo 17 Website AppCeline George
 
Introduction to AI in Higher Education_draft.pptx
Introduction to AI in Higher Education_draft.pptxIntroduction to AI in Higher Education_draft.pptx
Introduction to AI in Higher Education_draft.pptxpboyjonauth
 
Interactive Powerpoint_How to Master effective communication
Interactive Powerpoint_How to Master effective communicationInteractive Powerpoint_How to Master effective communication
Interactive Powerpoint_How to Master effective communicationnomboosow
 
Employee wellbeing at the workplace.pptx
Employee wellbeing at the workplace.pptxEmployee wellbeing at the workplace.pptx
Employee wellbeing at the workplace.pptxNirmalaLoungPoorunde1
 

Dernier (20)

mini mental status format.docx
mini    mental       status     format.docxmini    mental       status     format.docx
mini mental status format.docx
 
SOCIAL AND HISTORICAL CONTEXT - LFTVD.pptx
SOCIAL AND HISTORICAL CONTEXT - LFTVD.pptxSOCIAL AND HISTORICAL CONTEXT - LFTVD.pptx
SOCIAL AND HISTORICAL CONTEXT - LFTVD.pptx
 
Introduction to ArtificiaI Intelligence in Higher Education
Introduction to ArtificiaI Intelligence in Higher EducationIntroduction to ArtificiaI Intelligence in Higher Education
Introduction to ArtificiaI Intelligence in Higher Education
 
Contemporary philippine arts from the regions_PPT_Module_12 [Autosaved] (1).pptx
Contemporary philippine arts from the regions_PPT_Module_12 [Autosaved] (1).pptxContemporary philippine arts from the regions_PPT_Module_12 [Autosaved] (1).pptx
Contemporary philippine arts from the regions_PPT_Module_12 [Autosaved] (1).pptx
 
INDIA QUIZ 2024 RLAC DELHI UNIVERSITY.pptx
INDIA QUIZ 2024 RLAC DELHI UNIVERSITY.pptxINDIA QUIZ 2024 RLAC DELHI UNIVERSITY.pptx
INDIA QUIZ 2024 RLAC DELHI UNIVERSITY.pptx
 
Activity 01 - Artificial Culture (1).pdf
Activity 01 - Artificial Culture (1).pdfActivity 01 - Artificial Culture (1).pdf
Activity 01 - Artificial Culture (1).pdf
 
18-04-UA_REPORT_MEDIALITERAСY_INDEX-DM_23-1-final-eng.pdf
18-04-UA_REPORT_MEDIALITERAСY_INDEX-DM_23-1-final-eng.pdf18-04-UA_REPORT_MEDIALITERAСY_INDEX-DM_23-1-final-eng.pdf
18-04-UA_REPORT_MEDIALITERAСY_INDEX-DM_23-1-final-eng.pdf
 
How to Make a Pirate ship Primary Education.pptx
How to Make a Pirate ship Primary Education.pptxHow to Make a Pirate ship Primary Education.pptx
How to Make a Pirate ship Primary Education.pptx
 
Mattingly "AI & Prompt Design: The Basics of Prompt Design"
Mattingly "AI & Prompt Design: The Basics of Prompt Design"Mattingly "AI & Prompt Design: The Basics of Prompt Design"
Mattingly "AI & Prompt Design: The Basics of Prompt Design"
 
“Oh GOSH! Reflecting on Hackteria's Collaborative Practices in a Global Do-It...
“Oh GOSH! Reflecting on Hackteria's Collaborative Practices in a Global Do-It...“Oh GOSH! Reflecting on Hackteria's Collaborative Practices in a Global Do-It...
“Oh GOSH! Reflecting on Hackteria's Collaborative Practices in a Global Do-It...
 
Call Girls in Dwarka Mor Delhi Contact Us 9654467111
Call Girls in Dwarka Mor Delhi Contact Us 9654467111Call Girls in Dwarka Mor Delhi Contact Us 9654467111
Call Girls in Dwarka Mor Delhi Contact Us 9654467111
 
Hybridoma Technology ( Production , Purification , and Application )
Hybridoma Technology  ( Production , Purification , and Application  ) Hybridoma Technology  ( Production , Purification , and Application  )
Hybridoma Technology ( Production , Purification , and Application )
 
The Most Excellent Way | 1 Corinthians 13
The Most Excellent Way | 1 Corinthians 13The Most Excellent Way | 1 Corinthians 13
The Most Excellent Way | 1 Corinthians 13
 
Accessible design: Minimum effort, maximum impact
Accessible design: Minimum effort, maximum impactAccessible design: Minimum effort, maximum impact
Accessible design: Minimum effort, maximum impact
 
Industrial Policy - 1948, 1956, 1973, 1977, 1980, 1991
Industrial Policy - 1948, 1956, 1973, 1977, 1980, 1991Industrial Policy - 1948, 1956, 1973, 1977, 1980, 1991
Industrial Policy - 1948, 1956, 1973, 1977, 1980, 1991
 
Z Score,T Score, Percential Rank and Box Plot Graph
Z Score,T Score, Percential Rank and Box Plot GraphZ Score,T Score, Percential Rank and Box Plot Graph
Z Score,T Score, Percential Rank and Box Plot Graph
 
URLs and Routing in the Odoo 17 Website App
URLs and Routing in the Odoo 17 Website AppURLs and Routing in the Odoo 17 Website App
URLs and Routing in the Odoo 17 Website App
 
Introduction to AI in Higher Education_draft.pptx
Introduction to AI in Higher Education_draft.pptxIntroduction to AI in Higher Education_draft.pptx
Introduction to AI in Higher Education_draft.pptx
 
Interactive Powerpoint_How to Master effective communication
Interactive Powerpoint_How to Master effective communicationInteractive Powerpoint_How to Master effective communication
Interactive Powerpoint_How to Master effective communication
 
Employee wellbeing at the workplace.pptx
Employee wellbeing at the workplace.pptxEmployee wellbeing at the workplace.pptx
Employee wellbeing at the workplace.pptx
 

Balance sheet of state bank of india (1)

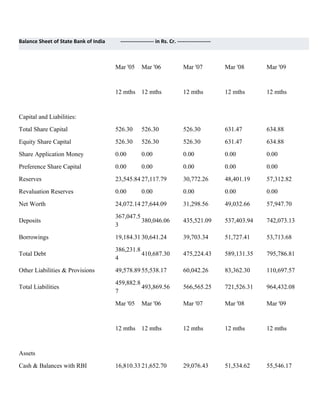
  • 1. Balance Sheet of State Bank of India ------------------- in Rs. Cr. ------------------- Mar '05 Mar '06 Mar '07 Mar '08 Mar '09 12 mths 12 mths 12 mths 12 mths 12 mths Capital and Liabilities: Total Share Capital 526.30 526.30 526.30 631.47 634.88 Equity Share Capital 526.30 526.30 526.30 631.47 634.88 Share Application Money 0.00 0.00 0.00 0.00 0.00 Preference Share Capital 0.00 0.00 0.00 0.00 0.00 Reserves 23,545.84 27,117.79 30,772.26 48,401.19 57,312.82 Revaluation Reserves 0.00 0.00 0.00 0.00 0.00 Net Worth 24,072.14 27,644.09 31,298.56 49,032.66 57,947.70 367,047.5 Deposits 380,046.06 435,521.09 537,403.94 742,073.13 3 Borrowings 19,184.31 30,641.24 39,703.34 51,727.41 53,713.68 386,231.8 Total Debt 410,687.30 475,224.43 589,131.35 795,786.81 4 Other Liabilities & Provisions 49,578.89 55,538.17 60,042.26 83,362.30 110,697.57 459,882.8 Total Liabilities 493,869.56 566,565.25 721,526.31 964,432.08 7 Mar '05 Mar '06 Mar '07 Mar '08 Mar '09 12 mths 12 mths 12 mths 12 mths 12 mths Assets Cash & Balances with RBI 16,810.33 21,652.70 29,076.43 51,534.62 55,546.17
  • 2. Balance with Banks, Money at Call 22,511.77 22,907.30 22,892.27 15,931.72 48,857.63 202,374.4 Advances 261,641.53 337,336.49 416,768.20 542,503.20 5 197,097.9 Investments 162,534.24 149,148.88 189,501.27 275,953.96 1 Gross Block 6,691.09 7,424.84 8,061.92 8,988.35 10,403.06 Accumulated Depreciation 4,114.67 4,751.73 5,385.01 5,849.13 6,828.65 Net Block 2,576.42 2,673.11 2,676.91 3,139.22 3,574.41 Capital Work In Progress 121.27 79.82 141.95 234.26 263.44 Other Assets 18,390.71 22,380.84 25,292.31 44,417.03 37,733.27 459,882.8 Total Assets 493,869.54 566,565.24 721,526.32 964,432.08 6 131,325.4 Contingent Liabilities 191,819.34 259,536.57 736,087.59 614,603.47 0 Bills for collection 44,794.10 57,618.44 70,418.15 93,652.89 152,964.06 Book Value (Rs) 457.39 525.25 594.69 776.48 912.73 Profit & Loss account of State Bank of ------------------- in Rs. Cr. ------------------- India Mar '05 Mar '06 Mar '07 Mar '08 Mar '09 12 mths 12 mths 12 mths 12 mths 12 mths Income Interest Earned 32,428.0035,794.93 39,491.03 48,950.31 63,788.43
  • 3. Other Income 7,119.90 7,388.69 7,446.76 9,398.43 12,691.35 Total Income 39,547.9043,183.62 46,937.79 58,348.74 76,479.78 Expenditure Interest expended 18,483.3820,159.29 23,436.82 31,929.08 42,915.29 Employee Cost 6,907.35 8,123.04 7,932.58 7,785.87 9,747.31 Selling and Admin Expenses 2,634.64 1,853.32 3,251.14 4,165.94 5,122.06 Depreciation 752.21 729.13 602.39 679.98 763.14 Miscellaneous Expenses 6,465.82 7,912.15 7,173.55 7,058.75 8,810.75 Preoperative Exp Capitalised 0.00 0.00 0.00 0.00 0.00 Operating Expenses 11,278.1811,872.89 13,251.78 14,609.55 18,123.66 Provisions & Contingencies 5,481.84 6,744.75 5,707.88 5,080.99 6,319.60 Total Expenses 35,243.4038,776.93 42,396.48 51,619.62 67,358.55 Mar '05 Mar '06 Mar '07 Mar '08 Mar '09 12 mths 12 mths 12 mths 12 mths 12 mths Net Profit for the Year 4,304.52 4,406.67 4,541.31 6,729.12 9,121.23 Extraordionary Items 0.00 0.00 0.00 0.00 0.00 Profit brought forward 0.34 0.34 0.34 0.34 0.34 Total 4,304.86 4,407.01 4,541.65 6,729.46 9,121.57 Preference Dividend 0.00 0.00 0.00 0.00 0.00 Equity Dividend 657.87 736.82 736.82 1,357.66 1,841.15 Corporate Dividend Tax 93.75 103.34 125.22 165.87 248.03 Per share data (annualised) Earning Per Share (Rs) 81.79 83.73 86.29 106.56 143.67 Equity Dividend (%) 125.00 140.00 140.00 215.00 290.00 Book Value (Rs) 457.39 525.25 594.69 776.48 912.73
  • 4. Appropriations Transfer to Statutory Reserves 3,552.89 3,566.51 3,682.15 5,205.69 6,725.15 Transfer to Other Reserves 0.01 0.00 -2.88 -0.10 306.90 Proposed Dividend/Transfer to Govt 751.62 840.16 862.04 1,523.53 2,089.18 Balance c/f to Balance Sheet 0.34 0.34 0.34 0.34 0.34 Total 4,304.86 4,407.01 4,541.65 6,729.46 9,121.57 Cash Flow of State Bank of India ------------------- in Rs. Cr. ------------------- Mar '06 Mar '07 Mar '08 Mar '09 Mar '10 12 mths 12 mths 12 mths 12 mths 12 mths Net Profit Before Tax 6837.36 7625.08 10438.90 14180.64 13926.10 Net Cash From Operating Activities 6039.14 -1776.07 -856.87 29479.73 -1804.99 Net Cash (used in)/from -1134.18 -284.56 -2798.01 -1651.93 -1761.52 Investing Activities Net Cash (used in)/from Financing 461.98 9494.11 19371.12 5097.38 -3359.67 Activities Net (decrease)/increase In Cash and Cash 5366.94 7433.49 15716.24 32925.18 -6926.18 Equivalents Opening Cash & Cash Equivalents 39322.10 44535.20 51968.69 71478.62 103110.02 Closing Cash & Cash Equivalents 44689.04 51968.69 67466.34 104403.80 96183.84 Key Financial Ratios of State Bank of India ------------------- in Rs. Cr. ------------------- Mar Mar '07 Mar '08 Mar '09 Mar '10
  • 5. '06 Investment Valuation Ratios Face Value 10.00 10.00 10.00 10.00 10.00 Dividend Per Share 14.00 14.00 21.50 29.00 30.00 Operating Profit Per Share (Rs) 124.77147.72 173.61 230.04 229.63 Net Operating Profit Per Share (Rs) 719.54833.38 899.83 1,179.45 1,353.15 Free Reserves Per Share (Rs) 178.33184.43 356.61 373.99 412.36 Bonus in Equity Capital -- -- -- -- -- Profitability Ratios Interest Spread 4.31 4.20 4.32 4.34 3.82 Adjusted Cash Margin(%) 13.06 11.43 12.81 13.04 11.62 Net Profit Margin 11.21 10.12 11.65 12.03 10.54 Return on Long Term Fund(%) 97.89 99.20 86.83 100.35 95.02 Return on Net Worth(%) 15.94 14.50 13.72 15.74 13.89 Adjusted Return on Net Worth(%) 15.93 14.47 13.70 15.74 13.91 Return on Assets Excluding Revaluations 525.25594.69 0.93 912.73 1,038.76 Return on Assets Including Revaluations 525.25594.69 0.93 912.73 1,038.76 Management Efficiency Ratios Interest Income / Total Funds 7.94 8.27 8.82 8.88 8.52 Net Interest Income / Total Funds 3.71 3.85 3.87 3.79 3.82 Non Interest Income / Total Funds 0.30 0.19 0.14 0.11 0.10 Interest Expended / Total Funds 4.23 4.42 4.96 5.09 4.69 Operating Expense / Total Funds 2.34 2.39 2.16 2.06 2.38 Profit Before Provisions / Total Funds 1.52 1.54 1.74 1.75 1.46 Net Profit / Total Funds 0.92 0.86 1.04 1.08 0.91 Loans Turnover 0.16 0.15 0.15 0.16 0.15
  • 6. Total Income / Capital Employed(%) 8.24 8.46 8.96 8.99 8.62 Interest Expended / Capital Employed(%) 4.23 4.42 4.96 5.09 4.69 Total Assets Turnover Ratios 0.08 0.08 0.09 0.09 0.09 Asset Turnover Ratio 5.10 5.44 6.32 7.20 7.26 Profit And Loss Account Ratios Interest Expended / Interest Earned 56.32 59.35 65.23 67.28 66.66 Other Income / Total Income 3.60 2.25 1.56 1.18 1.21 Operating Expense / Total Income 28.37 28.19 24.13 22.91 27.61 Selling Distribution Cost Composition 0.28 0.20 0.30 0.33 0.26 Balance Sheet Ratios Capital Adequacy Ratio 11.88 12.34 13.47 14.25 13.39 Advances / Loans Funds(%) 65.66 76.16 78.31 78.34 74.22 Debt Coverage Ratios Credit Deposit Ratio 62.11 73.44 77.51 74.97 75.96 Investment Deposit Ratio 48.14 38.22 34.81 36.38 36.33 Cash Deposit Ratio 5.15 6.22 8.29 8.37 7.56 Total Debt to Owners Fund 13.75 13.92 10.96 12.81 12.19 Financial Charges Coverage Ratio 1.40 1.37 1.37 1.36 1.33 Financial Charges Coverage Ratio Post Tax 1.25 1.22 1.23 1.23 1.21 Leverage Ratios Current Ratio 0.05 0.05 0.07 0.04 0.04 Quick Ratio 5.50 6.52 6.15 5.74 9.07 Cash Flow Indicator Ratios Dividend Payout Ratio Net Profit 19.06 18.98 22.64 22.90 23.36 Dividend Payout Ratio Cash Profit 16.35 16.75 20.56 21.13 21.20 Earning Retention Ratio 80.93 80.97 77.33 77.11 76.67 Cash Earning Retention Ratio 83.64 83.21 79.41 78.88 78.82
  • 7. AdjustedCash Flow Times 74.03 84.87 72.64 75.05 79.54 Yearly Results of State Bank of India ------------------- in Rs. Cr. ------------------- Mar '06 Mar '07 Mar '08 Mar '09 Mar '10 Sales Turnover 35,794.93 39,491.02 48,950.31 63,788.43 70,993.92 Other Income 7,388.69 5,769.25 8,694.93 12,690.79 14,968.15 Total Income 43,183.62 45,260.27 57,645.24 76,479.22 85,962.07 Total Expenses 16,118.18 14,233.15 15,277.26 19,383.27 24,713.51 Operating Profit 19,676.75 25,257.87 33,673.05 44,405.16 46,280.41 Profit On Sale Of Assets -- -- -- -- -- Profit On Sale Of Investments -- -- -- -- -- Gain/Loss On Foreign Exchange -- -- -- -- -- VRS Adjustment -- -- -- -- -- Other Extraordinary Income/Expenses -- -- -- -- -- Total Extraordinary Income/Expenses -- -- -- -- -- Tax On Extraordinary Items -- -- -- -- -- Net Extra Ordinary Income/Expenses -- -- -- -- -- Gross Profit 27,065.44 31,027.12 42,367.98 57,095.95 61,248.56 Interest 20,159.29 23,436.82 31,929.08 42,915.29 47,322.48 PBDT 6,906.15 7,590.30 10,438.90 14,180.66 13,926.08 Depreciation -- -- -- -- -- Depreciation On Revaluation Of Assets -- -- -- -- -- PBT 6,906.15 7,590.30 10,438.90 14,180.66 13,926.08 Tax 2,499.48 3,048.99 3,709.78 5,059.42 4,760.03 Net Profit 4,406.67 4,541.31 6,729.12 9,121.24 9,166.05 Prior Years Income/Expenses -- -- -- -- --
  • 8. Depreciation for Previous Years Written -- -- -- -- -- Back/ Provided Dividend -- -- -- -- -- Dividend Tax -- -- -- -- -- Dividend (%) -- -- -- -- -- Earnings Per Share 83.73 86.29 106.56 143.67 144.37 Book Value -- -- -- -- -- Equity 526.30 526.30 631.47 634.88 634.88 Reserves 27,117.79 30,503.66 48,401.19 57,312.81 65,314.32 Face Value 10.00 10.00 10.00 10.00 10.00 Capital Structure Period Instrument Authorized CapitalIssued Capital -PAIDUP- From To (Rs. cr) (Rs. cr) Shares (nos) Face Value Capital 2009 2010 Equity Share 214.75 214.75 634882644 10 214.75 2008 2009 Equity Share 214.75 214.75 634880222 10 214.75 2007 2008 Equity Share 214.75 214.75 631470376 10 214.75 2006 2007 Equity Share 214.75 214.75 526298878 10 214.75 2005 2006 Equity Share 214.75 214.75 526298878 10 214.75 2004 2005 Equity Share 214.75 214.75 526298878 10 214.75 2003 2004 Equity Share 214.75 214.75 526298878 10 214.75 2002 2003 Equity Share 214.75 214.75 526298878 10 214.75 2001 2002 Equity Share 214.75 214.75 526298878 10 214.75 2000 2001 Equity Share 214.75 214.75 526298878 10 214.75 1999 2000 Equity Share 214.75 214.75 526298878 10 214.75 1996 2000 Equity Share 214.75 214.75 526298878 10 214.75 1995 1996 Equity Share 214.75 214.75 474009872 10 214.75 1994 1995 Equity Share 214.75 214.75 474009189 10 214.75 1993 1994 Equity Share 214.75 214.75 473828726 10 214.75
  • 9. 1991 1993 Equity Share 214.75 200 20000000 100 200 Directors Report Year End : Mar '10 V. CREDIT POLICY AND PROCEDURES DEPARTMENT (CPPD) PERFORMANCE HIGHLIGHTS : - Loan Policy of the Bank, has been reviewed and current RBI guidelines have been incorporated. - Increase in the Term Loan exposure limit to Infrastructure sector to 15% from 10%. . - Appointment of Nominee Directors Review and Authority Structure. - Prudential Norms on Unsecured Advances. - Guidelines on Restructuring of Advances by Banks. - Review of Grievances redressal mechanism under Guidelines on Fair Practice Codes for Lending. - Accounting procedures for sale of NPAs / Securitisatibn Companies / Asset Reconstruction Companies. - Operational guidelines on Forward Exchange Contracts and Derivatives. - Competitive Pricing - Review. - CP linked rates for discounting of Bills under LCs. - Policy for financing Corporates on Unsecured basis to attract new business. - As part of the Banks Green Banking Policy, initiatives like plantation of fruit bearing trees across the Banks premises, implementation of energy saving measures, encouraging customers on reduction of Green House gases by way of extending project loans on concessionary interest rates, assisting in CDM Registration and securitization of CER receivables etc. were undertaken. - Under the captive windmill project, the Bank has gone in for 10 windmills (1.5 MW each) which have been set up in three States viz. Maharashtra, Gujarat and Tamilnadu. Power generated from the windmills shall be set-off against the power consumption of identified offices / branches of those States. State Bank of India is the first Bank in India to have conceived the idea of Green Power generation for captive use in the Banking Industry. NEW PRODUCT : - Financing to Shipbreaking Units.
  • 10. Responsibility Statement The Board of Directors hereby states : i, that in the preparation of the annual accounts, the applicable accounting standards have been followed along with proper explanation relating to material departures; ii>. that they have selected such accounting policies and applied them consistently and made judgements and estimates as are reasonable and prudent, so as to give a true and fair view of the state of affairs of the Bank as on the 31st March 2010, and of the profit and loss of the Bank for the year ended on that date; iii. that they have taken proper and sufficient care for the maintenance of adequate accounting records in accordance with the provisions of the Banking Regulation Act, 1949 and State Bank of India Act, 1955 for safeguarding the assets of the Bank and preventing and detecting frauds and other irregularities; and iv. that they have prepared the annual accounts on a going concern basis. Acknowledgement During the year, Shri Ashok Chawla, Finance Secretary, Govt, of India was nominated to the Board under Section 19 (e) with effect from 13th May 2009, in place of Shri Arun Ramanathan, who retired on 30th April 2009. The Directors express their gratitude for the guidance and cooperation received from the Government of India, RBI, SEBI, IRDA and other government and regulatory agencies. The Directors also thank all the valued clients, shareholders, banks and financial institutions, stock exchanges, rating agencies and other stakeholders for their patronage and support, and take this opportunity to express their appreciation of the dedicated and committed team of employees of the Bank. For and on behalf of the Central Board of Directors O.P. Bhatt Date : 14th May, 2010 Chairman Chairman's Speech Year : Mar '10 I feel honoured to present, for the fourth time, details of your Banks performance and in this connection, your Banks Annual Report for the year 2009-10 detailing some of the significant initiatives and achievements during the year is enclosed. The world economy has been through a severe recession, the worst in the
  • 11. last 70 years, marked by financial turmoil, large-scale destruction of wealth, and declines in global output and trade. The global crisis, which began in the financial sector in the developed countries exposed a number of unresolved fragilities within the increasingly integrated financial system and affected the real economy. Global economic conditions appear to have improved on the back of co-ordinated fiscal and monetary policy measures taken by governments and central banks across the world. While some countries especially USA, now seem to be showing some signs of coming out of one of the largest financial crises in history, the recent threat of a sovereign default has tempered the green shoots of optimism that things are beginning to get back to normal. Continuing bank failures, macroeconomic weakness, widespread unemployment and recent tremors in Dubai, Portugal, Ireland, Iceland, Greece, Spain and other countries indicate that the crisis is not yet completely out of fuel. Also, even though the outlook for global growth has improved, the world is wary of a double dip, given the several risks and uncertainties that still persist. In sharp contrast, the Indian economy is trending up with strong GDP growth expected at 7.2% in FY 2010, rising to over 8% in FY 2011 and moving on to 9-10% in the medium term. The resurgence of manufacturing sector is driven by continuing growth in capital goods and consumer goods, as well as capacity additions across industry. At the same time, inflation has been rising. This complex global and domestic economic backdrop has posed its own set of challenges for policymakers in India and maintaining interest rates that are not out of sync with global rates, while supporting the growth momentum and also keeping a check on inflation remains a great challenge for the economy. Against this background, in the year gone by, the State Bank Group has performed well. Associate Banks Net Profit increased by 17.74% from Rs.2,774 crores in FY 2009 to Rs.3,266 crores in FY 2010. Operating profit of all Associate Banks increased by 2008% from Rs.5,495 crores to Rs.6,598 crores. SBI Group Net Profit for FY 2010 at Rs.11,734 crores was up by 7.11% from Rs.10,955 crores in FY 2009. Within a short span, SBI Life has recorded a profit of Rs.276 crores in FY 2010 as against a loss of Rs.26 crores in FY 2009. AUM of the company as on March 31, 2010 stood at Rs.28,703 crores, a YoY growth of 94%. Market share of SBI Life amongst private insurers increased to 18.34% from 16.00% in March 2009. SBI Capital Markets Ltd has posted a PAT of Rs.150 crores during FY 2010 as against Rs.75 crores in FY 2009 (excluding extraordinary income of Rs.74.98 crores), a YoY growth of 100%, driven by an increase of 73% in fee income. I am happy to place on record that SBI Capital Markets has crossed the milestone of Rs.1,00,000 crores in syndication. Another subsidiary, SBI DFHI Ltd., has recorded a net profit of Rs.89 crores during FY 2010 which is the highest in the last six years. SBI Cards has emerged as the most trusted brand by being the undisputed Gold Award winner in the Readers Digest Trusted Brands Survey 2009 in the Credit Card category. Net loss before tax during FY 2010 is down by 17% to Rs. 154 crores against a loss of Rs.185 crores during FY 2009. As you are aware, we ended last year with a liquidity surplus of Rs»83,991 crores, causing a drag on our profitability. Since credit off-take was poor, we consciously decided to shed high cost bulk deposits. You will be happy to see that in this competitive and
  • 12. challenging scenario, despite shedding high cost bulk deposits of Rs.77,679 crores (-50.15%), your Banks deposits went up by Rs.62,043 crores in FY 2010, driven by CASA growth of 26.76% and retail term deposits growth of 17.64%, resulting in a YoY growth of 8.36% in deposits from Rs.7,42,073 crores in March 2009 to Rs.8,04,116 crores in March 2010. Savings Bank deposits grew at an average of Rs.4,897 crores per month during FY 2010, total CASA growth during the year being Rs.73,168 crores. While market share in deposits in March 2010 at 16.31% (17.70% in March 2009), declined by 139 bps YoY, market share in low cost demand deposits at 17.51% (17.43% in March 2009) was up by 8 bps. Gross Advances of your Bank rose by Rs.92,940 crores, a growth of 16.94% from Rs.5,48,540 crores in March 2009 to Rs.6,41,480 crores in March 2010. Market share in advances in March 2010 at 16.28% (15.99% in March 2009) registered an increase of 29 bps YoY. Your Bank registered an impressive rise in Credit Deposit Ratio to 73.56% as at the end of March 2010 from 66.63% at the end of March 2009, an increase of 693 bps, bucking the industry trend as the credit deposit ratio for ASCB has come down from 72.32% in March 2009 to 72.22% in March 2010. Your Banks prudent lending policies have ensured balanced growth, with credit flowing across a wide range of sectors in the economy. Large and Mid Corporate advances have grown from Rs. 1,93,351 crores in March 2009 to Rs.2,21,892 crores in March 2010, registering a growth of 14.76%. Your Bank was No.l in retail lending in FY 2009 and continues to be No.l in FY 2010, driven by robust growth in Home, Auto and Education loans. Home loans grew by 31.68% YoY from a level of Rs.54,063 crores in March 2009 to Rs.71,193 crores in March 2010. Almost 95% of our customers (in rural, semi urban and urban areas) are first time home buyers. SBI Home Loans is Indias No.l Home Loan brand. It has maintained its position as Indias Most Preferred Home Loan brand in CNBC-Awaaz consumer awards continuously for four years since 2006. SBI Home Loans has been rated as The Best Home Loan in India by the panel of eminent jury in NDTV-Outlook Money awards continuously since 2008. Auto Loans went up by 45.44% YoY and Education Loans grew by 34.61% between March 2009 and March 2010. Your Bank remains a leader in Auto loans with its market share in Auto loans going up by 180 bps from 15% in March 2009 to 16.80% in March 2010. The Bank continues to be number one in financing Maruti cars pan India for two consecutive years in a row and has increased its presence in the market with higher penetration in the major brands like Chevrolet, Hyundai, Tata Motors and Honda Siel cars. Currently, your Bank is the market leader in Education Loans with a market share of 25% amongst PSU banks underpinning its belief in the future of India and that the youth will be the face of India in the coming years. Agriculture advances have grown by 16.54% between March 2009 and March 2010 and total disbursements under Agri Advances were Rs.34,179 crores during FY 2010, covering 12.32 lakh new farmers during the year. International advances increased by 12.49% from Rs.86,301 crores in March 2009 to Rs.97,071 crores in March 2010 despite hardening of the rupee.
  • 13. Along with increase in credit, your Banks conscious efforts to improve asset quality have borne fruit. The economic slowdown led to a rise in Gross NPAs from 2.86% in March 2009 to 3.11% in December 2009, but the same has been contained and declined to 3.05% by March 2010. During this period, Net NPAs rose from 1.79% to 1.88% but declined to 1.72%. Your Banks capital adequacy is well above the 9% norm stipulated by RBI. As per Basel II the CRAR of your Bank stood at 13.39% as at the end of March 2010, compared to 14.25% last year. As per Basel I the CRAR was 12.00% and Tier I was 8.46% as on March 2010. Operating Expenses were up by 29.84% in FY 2010 over FY 2009, driven by five key costs, as the Bank invested heavily in laying the foundation for future growth: (i) sharp increase in number of employees in various categories, the full impact of which on staff expenses was felt during FY 2010; (ii) Rs.627 crores arrears for wage revision pertaining to previous years provided during FY 2010; (iii) Additional contribution for pension at Rs.1998 crores against Rs.1,469 crores last year; (iv) Additional expenses of Rs.59 crores on Financial Inclusion; and (v) An expenditure of Rs.347 crores incurred on opening of 1,049 new branches and installing 7,788 new ATMs during the year. Bulk of these got back ended to the last quarter of the year. Our profits for Q4, therefore, went down by Rs.875.69 crores or 31.93% and the profit for the year remained flat at Rs.9166.05 crores. Your Bank remains committed to the customer and has taken several new initiatives to expand the bouquet of choices for its customers. As you are aware, over the last four years, your Bank has been seeking out new growth opportunities and has successfully forayed into related areas. I am happy to announce that your Bank has tirelessly persevered in this direction and several new initiatives were launched during 2009-10. Mobile Banking Services launched on 31.03.2009, have been extended to all branches during FY 2010. There are more than 2,18,000 registered users on date. Financial Planning & Wealth Management application has gone live and Financial Planning & Advisory Services have been rolled out in 924 branches across the Bank. Merchant Acquiring business has commenced on select basis and around 200 PoS terminals have been deployed. Your Bank is expected to deploy 1.50 lac PoS temiinals and enrol over 100 merchants for online purchases during the year. Your Bank has selected a consortium of Visa International and Elavon for a joint venture, which aims to set up 6 lac PoS terminals. SBI-SG Global Securities Services Pvt Ltd. has commenced operations in March 2010, which provides Custodial Services comprising Settlement, Depository Services, Safekeeping, Corporate Action, Fund Accounting etc. Your Bank has established SBI General Insurance Co. and limited commercial operations have been launched in March 2010. By August 2010, the Company would be ready for pan India operations with IT backed support. As the Countrys Premier Financial Conglomerate providing financial resources and services to clients pan India, your Bank has a role to play in addressing the issue of global warming. Your Banks Green Banking policy aims to reduce the Banks own carbon footprint and to sensitise its clients to adopt low carbon emission practices. First of its kind in the entire Banking, Finance and Insurance Sector (BFIS), your Bank has conceptualised generation of energy through renewable energy resources and therefore, resolved to install windmills for the
  • 14. Banks captive use with a view to substitute polluting power with green power besides initiating several measures like switching over to energy efficient lighting systems, installation of energy savers, efficient water management systems, waste disposal, tree plantation, etc. Out of 1,049 branches opened during the financial year 2009-10, 354 branches were opened in metro and urban areas with a view to increase our reach and be more accessible to customers. As at the end of March 2010, the Bank had 12,496 branches and 21,485 Group ATMs. As part of our endeavour to provide increased access to banking facilities across the country, your Bank simultaneously opened 154 branches and 1,540 new ATMs on 12th July 2009, the largest by any Bank, anywhere in the world, and the countrywide inauguration was done by the Honble Finance Minister, Shri Pranab Mukherjee. Further, the 1000th new SBI branch and 10,000th new group ATM of the year were inaugurated by the Secretary, Department of Financial Services, Ministry of Finance, Govt, of India. The need to give the Bank a modern look and feel was necessary and hence, special focus was placed on alternate banking channels such as ATMs, Internet Banking and Mobile Banking which offer customers hassle free banking anytime anywhere. The State Bank Group has a total of 21,485 ATMs across India as on 31st March 2010 of which 16,294 ATMs are of the State Bank of India alone. Along with an increase in number of ATMs, there has also been an increase in the number of debit cards issued by the Bank, which rose by more than 40% during the year. In the area of Micro Finance and Financial Inclusion, your Bank remains the market leader with market share of around 31% in SHG-Bank Credit Linkage programme having credit linked so far 17.13 lakh SHGs and disbursed loans to the extent of Rs.l 1,562 crores. Your Bank has rolled out several unique products like SHG Credit Card, SHG Sahayog Niwas and SHG Gold Card, a new scheme for financing NGOs/ MFIs for on-leading to SHGs, a Micro Insurance product - Grameen-Shakti has been rolled out which has covered one million lives by March 2010. Your Bank has been rated as the Best Public Sector Bank for Rural Reach by Dun and Bradstreet and has been awarded the Best Microfinance Award for the year 2009 by the Asian Banker for financial institutions across the Asia Pacific, Gulf and Central Asia regions. Coverage of unbanked villages increased from 53,000 in March 2009 to 1,03,938 by March 2010. Your Bank has gone beyond the usual domains of technology in terms of platform, solution, operational details and service content in a very aggressive manner to serve the excluded common citizen with minimal costs including SBI Tiny Card. Your Bank has rolled out Kiosk Banking, operated at internet enabled PC (Kiosk) % with bio-metric validation, in 7 Circles across 7 States and 49 districts. Major Service Centre Agencies (SCAs) like SREI Sahaj, 3-i Infotech have been engaged as Business Correspondents besides appointing about 26,800 Customer Service Point (CSP)/ outlets of Business Correspondents / Business Facilitators (BC/BFs). Some of the national level BC/BFs are India Post, ITC, National Bulk Handling Corporation and Reliance Dairy. To increase its outreach, the Bank has opened about 695 new branches in rural and semi urban areas during 2009-10. To improve the processing capacity, 314 Rural Central Processing Centres (RCPCs) have been set up. In the area of Information technology, your Bank successfully completed
  • 15. CBS implementation which is among the worlds largest. Your Bank has implemented a secure, robust and scalable WAN architecture connecting 18,189 Branches/Offices and 21,485 ATMs of State Bank Group through leased lines, VSATs and CDMA technology, supporting all critical business applications. This has facilitated successful launch of many important functionalities, such as, Defence Salary Package, ASBA, Universal Passbook etc. to meet specific requirements of Government, Corporate and individual customers. Keeping in view the requirement of senior citizens, a Pension Management System has been introduced at Contact Centre enabling the pensioners to make enquiry on their pension details through Contact Centre. A host of Mobile Banking services, such as funds transfers, enquiries, cheque book requests, bill payments, Mobile Top-up, recharging of DTH services, Demat account enquiry are currently being offered under mobile banking. Your Bank is involved not only with business development but also with care for the community and supports a range of socio-economic, educational and health initiatives. In the field of education, for better governance and standards, your Bank, in partnership with the Municipal Corporation of Greater Mumbai (MCGM), has launched a project to transform and upgrade the outcome of education and educational infrastructure in 1300 schools run by the Municipal Corporation. The Bank has agreed to support this project as a partner for a period of 2 years as this project may evolve as a model for replication across the country. To bridge the widening gulf between our youth in Metro/Urban areas and Rural India, your Bank has drawn up a programme named SBI Indicorps, a volunteer programme on the lines of the US Peace Corps, which would give fresh graduates from colleges/institutions an opportunity to live in villages and work on development projects with reputed NGOs. It is gratifying that our efforts have received recognition and the spate of awards is ample testimony to this fact. Among the awards, your Bank was adjudged Bank of The Year 2009, India by The Banker Magazine for the second year in succession; Awarded Best Bank - Large, and Most Socially Responsible Bank from Business World Best Bank Awards 2009; Bagged the BEST BANK 2009 Award by Business India; Adjudged the Most Trusted Brand 2009 - Economic Times, Brand Equity; Bagged the awards for Most Preferred Bank, Most Preferred Credit Card and Most Preferred Home Loan Brand from CNBC AWAAZ Consumer Awards; Awarded Visionaries of Financial Inclusion - Year 2009 by Financial Information Network & Operations Ltd. (FINO); Awarded Technology Bank of the Year in recognition of outstanding achievements in banking technology - IB A Banking Technology Awards 2009 and selected as the winner of Golden Peacock National Training Award for the year 2009 by the Golden Peacock Awards Jury. I am happy to announce that the Board of Directors of your Bank has declared a dividend of Rs 30 per share (@300%) for the year ended 31st March 2010, inclusive of an interim dividend already paid of Rs 10 per share (@100%). Today, India remains among the fastest growing countries of the world and is poised to play a greater role in the global economy in the years to come. Your Bank sees this as an opportunity and a challenge and I assure you that your Bank will try to capitalize on this and blaze a
  • 16. new trail of growth in future. With warm regards, Yours sincerely, (OM PRAKASH BHATT) Auditor's Report Year End : Mar '10 1. We, the undersigned Auditors of State Bank of India, appointed under Section 41(1) of the State Bank of India Act, 1955, do hereby report to the Central Government upon the Balance Sheet, Profit & Loss Account and the Cash Flow Statement of the Bank. 2. We have audited the attached Balance Sheet of State Bank of India as at 31st March 2010, the Profit & Loss Account and the Cash Flow Statement of the Bank for the year ended on that date annexed thereto. Incorporated in the said financial statements are the accounts of: (i) The Central Office, fourteen Local Head Offices, Corporate Accounts Group (Central), Mid-Corporate Group (Central), Stressed Assets Management Group (Central) and forty two branches audited by us; (ii) 9827 Indian Branches audited by other auditors; (iii) 44 Foreign Branches audited by the local auditors; and (iv) 2632 other Indian Branches, the unaudited returns of which are certified by the Branch Managers. These unaudited branches account for 0.89% of advances, 3.78% of deposits, 0.96% of interest income and 4.33% of interest expenses. These financial statements are the responsibility of the Banks Management. Our responsibility is to express an opinion on these financial statements based on our audit. 3. We conducted our audit in accordance with the auditing standards generally accepted in India. Those standards require that we plan and perform the audit to obtain reasonable assurance about whether the financial statements are free of material misstatement. An audit includes examining, on a test basis, evidence supporting the amounts and disclosures in the financial statements. An audit also includes assessing the accounting principles used and significant estimates made by the Management, as well as evaluating the overall financial statement presentation. We believe that our audit provides a reasonable basis for our opinion. 4. The Balance Sheet and the Profit & Loss Account have been drawn up in Forms A and B respectively of the Third Schedule to the Banking Regulation Act, 1949 and these give information as required to be given by virtue of the provisions of the State Bank of India Act, 1955, and Regulations there under. 5. We report, read with paragraph 2 above: (a) We have obtained all the information and explanations which to the
  • 17. best of our knowledge and belief, were necessary for the purposes of our audit and have found them to be satisfactory. (b) The transactions of the Bank, which have come to our notice, have been within the powers of the Bank. (c) The returns received from the offices and branches of the Bank have been found adequate for the purposes of our audit. 6. In our opinion, the Balance Sheet, Profit and Loss Account and Cash Flow Statement comply with the applicable accounting standards. 7. In our opinion and to the best of our information and according to the explanations given to us and as shown by the books of the Bank; (i) the Balance Sheet, read with the Principal Accounting Policies and the Notes to Accounts, is a full and fair Balance Sheet containing all the necessary particulars and is properly drawn up so as to exhibit a true and fair view of state of affairs of the Bank as at 31* March 2010; (ii) the Profit and Loss Account, read with the Principal Accounting Policies and the Notes to Accounts, shows a true balance of Profit for the year ended on that date; and (iii) the Cash Flow Statement gives a true and fair view of the cash flows for the year ended on that date, and are in conformity with the Accounting Principles generally accepted in India. STATUTORY CENTRAL AUDITORS For Essveeyar, Chartered Accountants P. Manohara Gupta M.No. 016444 Firm Regn. No.000671 S For K. C. Mehta & Co., Chartered Accountants Milin Mehta Partner : M.No. 038665 Firm Regn. No.106237 W For Kalyaniwalla & Mistry, Chartered Accountants
  • 18. Vinayak M. Padwal Partner : M.No. 049639 Firm Regn. No.104607 W For M. Verma & Associates, Chartered Accountants Madan Verma Partner : M No. 080939 Firm Regn. No. 501433 C For Krishnamoortny & Krishnamoorthy, Chartered Accountants C. R. Rema Partner: M.No. 029182 Firm Regn. No. 001488 S Kolkata 14th May, 2010 Notes to Accounts Year End : Mar '10 1. Share capital: a) During the year, the Bank has allotted 2422 equity shares of Rs 10 each for cash at a premium of Rs 1580 per equity share aggregating to Rs 38,50,980 out of 88,278 shares kept in abeyance under Right Issue - 2008. Out of the total subscription of Rs 38,50,980 received, Rs 24,220 was transferred to Share Capital Account and Rs 38,26,760 was transferred to Share Premium Account. b) The Bank has kept in abeyance the allotment of 85,856 (Previous Year 88,278) Equity Shares of Rs 10/- each issued as a part of Rights issue, since they are subject to title disputes or are subjudice. c) Disclosures on Risk Exposure in Derivatives (A) Qualitative Disclosure i. The Bank currently deals in over-the-counter (OTC) interest rate and currency derivatives as also in Interest Rate and Currency Futures. Interest Rate Derivatives dealt by the Bank are rupee interest rate swaps, foreign currency interest rate swaps and forward rate agreements. Currency derivatives dealt with by the Bank are currency swaps, rupee dollar options and cross-currency options. The products are offered to the Banks customers to hedge their exposures and the Bank enters into derivatives contracts to cover such exposures.
  • 19. Derivatives are also used by the Bank both for trading as well as hedging on-balance sheet items. The Bank also deals in a mix of these generic instruments. The Bank has done Option deals and Structured Products with customers, but they have been covered on a back to back basis in inter -bank market. ii. Derivative transactions carry market risk i.e. the probable loss the Bank may incur as a result of adverse movements in interest rates / exchange rates and credit risk as the probable loss the Bank may incur if the counterparties fail to meet their obligations. The Banks Policy for Derivatives which is duly approved by the Board mandates the market risk parameters (cut-loss triggers, open position limits, PV01 etc.) as well as customer eligibility criteria (credit rating, tenure of relationship etc.) for entering into derivative transactions.Credit risk is controlled by entering into derivative transactions only with counterparties in respect of whom appropriate limits are set for taking into account their ability to honour obligations.The Bank enters into ISDA agreements with such counterparties. iii. The Asset Liability Management Committee (ALCO) of the Bank oversees efficient management of these risks. Market Risk Management Department (MRMD), independently identifies measures, monitors market risk associated with derivative transactions, assists ALCO in controlling and managing these risks and reports compliance with policy prescriptions to the Risk Management Committee of the Board (RMCB) at regular intervals. iv. The accounting policy for derivatives has been drawn-up in ac- cordance with RBI guidelines, the details of which are presented under Schedule 17: Principal Accounting Policy (PAP) for the financial year 2009-10. v. Interest Rate Swaps are mainly used at Foreign Offices for hedg- ing of the assets and liabilities. vi. Apart from hedging swaps, swaps at Foreign Offices consist of back to back swaps done at our Foreign Offices which are done mainly for hedging of FCNR deposits at Global Markets, Kolkata. vii. Majority of our swaps were done with First class counterparty banks. b) Provisioning Coverage Ratio: The Provisioning to Gross Non-Performing Assets of the Bank as on 31st March 2010 is 59.23%. (Previous Year 56.76%) Additional provision pursuant to RBI guidelines for augmentation to 70% coverage by 30.09.2010 (extension allowed upto 30.9.2011 subject to fulfilment of specified conditions) has not been made during the year. 18.7 Disclosure Requirements as per Accounting Standards a) Changes in Accounting Policy The Bank has implemented a special home loan scheme for the period December 2008 to June 2009, arising out of which one time insurance premium has been paid covering the lives of the borrowers over the
  • 20. tenure of the home loan availed. The total insurance premium paid amounting to Rs. 151.37 crores on account of such scheme is charged off over average loan period of 15 years and accordingly, l/15th of the premium amount has been charged off during the year instead of fully charging in the accounts. Consequent to this change, the profit after tax has gone up by Rs 93.26 crores. b. Employee Benefits ii. Employees Provident Fund In terms of the guidance on implementing the AS-15 (Revised 2005) issued by the Institute of the Chartered Accountants of India, the Employees Provident Fund set up by the Bank is treated as a defined benefit plan since the Bank has to meet the specified minimum rate of return. As at the year-end, no shortfall remains unprovided for. Accordingly, other related disclosures in respect of Provident Fund have not been made and an amount of Rs. 351.59 Crores (Previous Year Rs 337.53 Crores) is recognised as an expense towards the Provident Fund scheme of the Bank included under the head Payments to and provisions for employees in Profit and Loss Account. iii. Other Long term Employee Benefits Amount of Rs. 151.24 Crores (Previous Year write back of an amount of Rs. 49.05 Crores) is provided towards Long Term Employee Benefits and is included under the head Payments to and Provisions for Employees in Profit and Loss Account. c) Segment Reporting 1. Segment identification A) Primary (Business Segment) The following are the primary segments of the Bank : — Treasury — Corporate / Wholesale Banking — Retail Banking — Other Banking Business The present accounting and information system of the Bank does not support capturing and extraction of the data in respect of the above segments separately. However, based on the present internal, organisational and management reporting structure and the nature of their risk and returns, the data on the primary segments have been computed as under: a) Treasury - The Treasury Segment includes the entire investment portfolio and trading in foreign exchange contracts and derivative contracts. The revenue of the treasury segment primarily consists of
  • 21. fees and gains or losses from trading operations and interest income on the investment portfolio. b) Corporate / Wholesale Banking - The Corporate / Wholesale Banking segment comprises the lending activities of Corporate Accounts Group, Mid Corporate Accounts Group and Stressed Assets Management Group. These include providing loans and transaction services to corporate and institutional clients and further include non-treasury operations of foreign offices. c) Retail Banking - The Retail Banking Segment comprises of branches in National Banking Group, which primarily includes Personal Banking activities including lending activities to corporate customers having banking relations with branches in the National Banking Group. This segment also includes agency business and ATMs. d) Other Banking business - Segments not classified under (a) to (c) above are classified under this primary segment. B) Secondary (Geographical Segment) i) Domestic Operations - Branches/Offices having operations in India ii) Foreign Operations - Branches/Offices having operations outside India and offshore Banking units having operations in India C) Pricing of Inter-segmental transfers The Retail Banking segment is the primary resource mobilising unit. The Corporate/Wholesale Banking and Treasury segments are recipient of funds from Retail Banking. Market related Funds Transfer Pricing (MRFTP) is followed under which a separate unit called Funding Centre has been created. The Funding Centre notionally buys funds that the business units raise in the form of deposits or borrowings and notionally sell funds to business units engaged in creating assets. D) Allocation of Expenses, Assets and liabilities Expenses incurred at Corporate Centre establishments directly attributable either to Corporate / Wholesale and Retail Banking Operations or to Treasury Operations segment, are allocated accordingly. Expenses not directly attributable are allocated on the basis of the ratio of number of employees in each segment/ratio of directly attributable expenses. The Bank has certain common assets and liabilities, which cannot be attributed to any segment, and the same are treated as unallocated. d) Related Party Disclosures 1. Related Parties A. SUBSIDIARIES i. DOMESTIC BANKING SUBSIDIARIES 1. State Bank of Bikaner & Jaipur 2. State Bank of Hyderabad
  • 22. 3. State Bank of Indore 4. State Bank of Mysore 5. State Bank of Patiala 6. State Bank of Travancore 7. SBI Commercial and International Bank Ltd. ii. FOREIGN BANKING SUBSIDIARIES 1. SBI (Mauritius) Ltd. 2. State Bank of India (Canada) 3. State Bank of India (California) 4. Commercial Bank of India LLC, Moscow (##) 5. PT Bank SBI Indonesia 6. Nepal SBI Bank Ltd. iii. DOMESTIC NON-BANKING SUBSIDIARIES 1. SBI Capital Markets Limited 2. SBI DFHI Limited 3. SBI Mutual Funds Trustee Company Pvt. Ltd 4. SBI CAP Securities Ltd. 5. SBI CAPS Ventures Ltd. 6. SBI CAP Trustees Co. Ltd. 7. SBI Cards & Payment Services Pvt. Ltd. (##) 8. SBI Funds Management Pvt. Ltd. (##) 9. SBI Life Insurance Company Ltd. (##) 10. SBI Pension Fund Private Limited 11. SBI Custodial Services Private Limited (##) 12. SBI Global Factors Ltd. 13. SBI General Insurance Company Ltd (##) 14. SBI Payment Services Pvt Ltd iv. FOREIGN NON-BANKING SUBSIDIARIES
  • 23. 1. SBICAP (UK) Ltd. 2. SBI Funds Management (International) Private Ltd.(##) ## These entities are jointly controlled. B. JOINTLY CONTROLLED ENTITIES 1. GE Capital Business Process Management Services Pvt. Ltd 2. C-Edge Technologies Ltd. 3. Macquarie SBI Infrastructure Management Pte. Ltd. 4. Macquarie SBI Infrastructure Trustees Ltd. 5. SBI Macquarie Infrastructure Management Pvt Ltd. 6. SBI Macquarie Infrastructure Trustees Pvt Ltd. C. ASSOCIATES i. Regional Rural Banks 1. Andhra Pradesh Grameena Vikas Bank 2. Arunachal Pradesh Rural Bank 3. Cauvery Kalpatharu Grameena Bank 4. Chhattisgarh Gramin Bank 5. Deccan Grameena Bank 6. Ellaquai Dehati Bank 7. Meghalaya Rural Bank 8. Krishna Grameena Bank 9. Langpi Dehangi Rural Bank 10. Madhya Bharat Gramin Bank 11. Malwa Gramin Bank 12. Marwar Ganganagar Bikaner Gramin Bank 13. Mizoram Rural Bank 14. Nagaland Rural Bank 15. Parvatiya Gramin Bank 16. Purvanchal Kshetriya Gramin Bank 17. Samastipur Kshetriya Gramin Bank
  • 24. 18. Saurashtra Gramin Bank 19. Utkal Gramya Bank 20. Uttaranchal Gramin Bank 21. Vananchal Gramin Bank 22. Vidisha Bhopal Kshetriya Gramin Bank ii. Others 1. SBI Home Finance Limited 2. Clearing Corporation of India Ltd. 3. Bank of Bhutan 4. UTI Asset Management Company Pvt. Ltd. (upto 19.01.2010) 5. S. S. Ventures Services Ltd. 6. Nepal SBI Bank Ltd (upto 13.06.2009)* * Became subsidiary of SBI w.e.f. 14.06.2009 D. Key Management Personnel of the Bank 1. Shri O. P. Bhatt, Chairman 2. Shri S. K. Bhattacharyya, Managing Director 3. Shri R. Sridharan, Managing Director 2. Parties with whom transactions were entered into during the year No disclosure is required in respect of related parties, which are State- controlled Enterprises as per paragraph 9 of Accounting Standard (AS) 18. Further, in terms of paragraph 5 of AS 18, transactions in the nature of Banker-Customer relationship are not required to be disclosed in respect of Key Management Personnel and relatives of Key Management Personnel. Other particulars are as under: 1. C-Edge Technologies Ltd. 2. GE Capital Business Process Management Services Pvt. Ltd. 3. Macquarie SBI Infrastructure Management Pie. Ltd. 4. Macquarie SBI Infrastructure Trustees Ltd. 5. SBI Macquarie Infrastructure Management Pvt Ltd. 6. SBI Macquarie Infrastructure Trustees Pvt Ltd. 7. Bank of Bhutan 8. Nepal SBI Bank Ltd (upto 13.06.2009)
  • 25. 9. SBI Home Finance Ltd. 10. S. S. Ventures Services Ltd 11. Shri O. P. Bhatt, Chairman 12. Shri S. K. Bhattacharyya, Managing Director 13. Shri R. Sridharan, Managing Director g) Accounting for Taxes on Income i. During the year, Rs. 1407.75 Crores [Previous Year Rs. 1055.10 Crores] has been credited to Profit and Loss Account by way of adjustment of deferred tax. ii. The Bank has outstanding net deferred tax asset of Rs. 2512.09 Crores (Previous Year- Rs. 1026.89 Crores), which has been included in other assets-others and other liabilities-others respectively. The breakup of deferred tax assets and liabilities into major items is given below: j) Impairment of Assets In the opinion of the Banks Management, there is no impairment to the assets during the year to which Accounting Standard 28 - Impairment of Assets applies. k) Provisions, Contingent Liabilities & Contingent Assets a) Break-up of Provisions Particulars Current Year Previous Year Provision for Taxation -Current Tax 6166.62 5971.52 -Fringe Benefit Tax 0.00 142.00 -Deferred Tax -1407.75 -1055.10 -Other Tax 1.16 1.00 Provision for Depreciation on Investments -987.99 707.16 Provision on Non-Performing Assets 4622.33 2474.96 Provision on Restructured Assets 525.53 0.00 Provision for Agricultural Debt Waiver & Relief Scheme 0.00 140.00 Provision on Standard Assets 80.06 234.82
  • 26. Provision for Other Assets 154.90 177.64 Total 9154.86 8794.00 18.B Agricultural Debt Waiver and Debt Relief Scheme 2008 As per the Agricultural Debt Waiver and Debt Relief Scheme 2008, the amount receivable from the Central Government on account of debt waiver being Rs. 5307 Crores (net of receipts of Rs 3424 crores) and debt relief being Rs. 903.31 crore (net of receipts of Rs 226.69 crores) are treated as part of advances in accordance with the scheme read with circular issued by RBI. The Central Government has recently extended the last date of payment by eligible farmers under Debt Relief Scheme from 31.12.2009 to 30.06.2010. In accordance with the scheme read with circular issued by RBI in this regard the dues amounting to Rs 1068 crores by such eligible farmers (net of recovery of Rs 2591 crores and write off of Rs 284 crores) as of 31.03.2010 has been classified as Standard Advances under IRAC norms. 18.9 Amalgamation of State Bank of Indore Pursuant to a scheme of Amalgamation approved by the Central Board at its meeting on 19th June 2009, State Bank of Indore, where SBI holds 98.05% stake, is to be merged with the Bank. The Government of India has accorded sanction to the Bank for entering into negotiations for acquiring the business, including assets and liabilities of State Bank of Indore. 18.10 Inter Office Account Inter Office Accounts between branches, controlling offices and local head offices and corporate centre establishments have been reconciled up to December 2009. Further, reconciliation is being done on an ongoing basis and no material effect is expected on the profit and loss account of die current year. 18.11 Pending Wage Agreement Implementation The Eighth Bipartite Settlement entered into by the Indian Banks Association on behalf of the member Banks with the All India Unions of Workmen expired on 31st October 2007. The New Agreement has been executed on 27th April 2010 to be effective from 1st November 2007 for workers as well as officers. Pending receipt of detailed circular from DBA regarding revisions after due approval from the Central Government and detailed computations to be carried out by the Bank , a provision of Rs.2559 Crores (including Rs 627 crores for the period from 1.11.2007 to 31.03.2009 on revision of estimated % from 13.25 to 17.50) has been created during the year as against Rsl414 crores created in the previous year and Rs 575 crores during 2007-08. The total provision held on account of wage revision as on 31st March 2010 is Rs 4569.55 Crores (including Rs 21.55 crores transferred from eSBS). 18.12 Provisioning for Gratuity The Payment of Gratuity (Amendment) Bill, 2010 has been passed by the
  • 27. Parliament increasing the celing from Rs 3.50 lakh to Rs 10 lakh. However pending enactment and subsequent notification by the Central Government about applicability , effective date and the terms thereof and the finalisation of salaries and wage revision as refered in para 18.11 above, the provision for Gratuity has been created actuarially in line with Accounting Policy No. ll-2(i)(c) during the year. The impact arising out of such proposed change is not ascertainable at present. 18.13. The figures of the current period include the working results of the branches of erstwhile State Bank of Saurashtra (SBS), consequent to its merger with the Bank in August 2008. Hence, the figures of the previous period are strictly not comparable. 18.14. In terms of RBI letter No. DBOD.BP.No. 19264/21.04.018/2009-10 dated 11.05.2010,RBI has permitted to transfer entries in inter branch account outstanding for a period of 10 years i.e. pertaining to the year 1999-2000. Accordingly, a net credit of Rs 60.15 crores has been transferred to Profit and Loss account . An amount of Rs 29.51 crores (net of taxes and Statutory Reserves ) has therefore been transferred to General Reserve. 18.15. During the year the Bank has contributed Rs 92 crores to SBI Retired Employees Medical Benefit Trust. 18.16. Previous period figures have been regrouped/reclassified, wherever necessary, to conform to current period classification. In cases where disclosures have been made for the first time in terms of RBI guidelines /Accounting Standards, previous years figures have not been mentioned. Accounting Policy Year : Mar '10 A. Basis of Preparation The accompanying financial statements have been prepared under the historical cost convention as modified for derivatives and foreign currency transactions, as enumerated in Part C below. They conform to Generally Accepted Accounting Principles (GAAP) in India, which comprise the statutory provisions, guidelines of regulatory authorities, Reserve Bank of India (RBI), accounting standards/guidance notes issued by the Institute of Chartered Accountants of India (ICAI), and the practices prevalent in the banking industry in India. B. Use of Estimates The preparation of financial statements requires the management to make estimates and assumptions considered in the reported amounts of assets and liabilities (including contingent liabilities) as of the date of the. financial statements and the reported income and expenses during the reporting period. Management believes that the estimates used in the preparation of the financial statements are prudent and reasonable. Future results could differ from these estimates. Any revision to the accounting estimates is recognised prospectively in the current and future periods.
  • 28. C. PRINCIPAL ACCOUNTING POLICIES 1. Revenue recognition 1.1 Income and expenditure are accounted on accrual basis, except otherwise stated below. In respect of banks foreign offices, income is recognised as per the local laws of the country in which the respective foreign office is located. 1.2 Interest income is recognised in the Profit and Loss Account as it accrues except (i) income from non- performing assets (NPAs), comprising .of advances, leases and investments, which is recognised upon realisation, as per the prudential norms prescribed by the RBI/ respective country regulators (hereafter collectively referred to as Regulatory Authorities), (ii) interest on application money on investments (iii) overdue interest on investments and bills discounted, (iv) Income on Rupee Derivatives designated as Trading 1.3 Profit or-loss on sale of investments is credited / debited to Profit and Loss Account (Sale of Investments). Profit on sale of investments in the Held to Maturity category shall be appropriated net of applicable taxes to Capital Reserve Account. Loss on sale will be recognized in the Profit and Loss Account. 1.4 Income from finance leases is calculated by applying the interest rate implicit in the lease to the net investment outstanding on the lease, over the primary lease period. Leases effective from April 1, 2001 are accounted as advances at an amount equal to the net investment in the lease. The lease rentals are apportioned between principal and finance income based on a pattern reflecting a constant periodic return on the net investment outstanding in respect of finance leases. The principal amount is utilized for reduction in balance of net investment in lease and finance income is reported-as interest income. 1.5 Income (other than interest) on investments in Held to Maturity (HTM) category acquired at a discount to the face value, is recognised as follows : a) On Interest bearing securities, it is recognised only at the time of sale/ redemption. b) On zero-coupon securities, it is accounted for over the balance tenor of the security on a constant yield basis. 1.6 Dividend is accounted on an accrual basis where the right to receive the dividend is established. 1.7 All other commission and fee incomes are recognised on their realisation except for (i) Guarantee commission on deferred payment guarantees, which is spread over the period of the guarantee and (ii) Commission on Government Business, which is recognised as it accrues. 1.8 One time Insurance Premium paid under Special Home Loan Scheme (December 2008 to June 2009) is amortised over average loan period of 15 years. 2. Investments Investments are accounted for in accordance with the extant regulatory
  • 29. guidelines. The bank follows trade date method for accounting of its investments. 2.1 Classification Investments are classified into 3 categories, viz. Held to Maturity, Available for Sale and Held for Trading categories (hereafter called categories). Under each of these categories, investments are further classified into the following six groups: i. Government Securities, ii. Other Approved Securities, iii. Shares, iv. Debentures and Bonds, v. Subsidiaries/Joint ventures and vi. Others. 2.2 Basis of classification i. Investments that the Bank intends to hold till maturity are classified as Held to Maturity. ii. Investments that are held principally for resale within 90 days from the date of purchase are classified as Held for Trading. iii. Investments, which are not classified in the above two categories, are classified as Available for Sale. iv. An investment is classified as Held to Maturity, Available for Sale or Held for Trading at the time of its purchase and subsequent shifting amongst categories is done in conformity with regulatory guidelines. v. Investments in subsidiaries, joint ventures and associates are classified under Held to Maturity. 2.3 Valuation i. In determining the acquisition cost of an investment: (a) Brokerage/commission received on subscriptions is reduced from the cost. (b) Brokerage, commission, securities transaction tax etc. paid in connection with acquisition of investments are expensed upfront and excluded from cost. (c) Broken period interest paid / received on debt instruments is treated as interest expense/income and is excluded from cost/sale consideration. (d) Cost is determined on the weighted average cost method.
  • 30. (e) The transfer of a security amongst the above three categories is accounted for at the least of acquisition cost/book value/market value on the date of transfer, and the depreciation, if any, on such transfer is fully provided for. ii. Treasury Bills and Commercial Papers are valued at carrying cost. iii. Held to Maturity category: Each scrip under Held to Maturity category is carried at its acquisition cost or at amortised cost, if acquired at a premium over the face value. Any premium on acquisition is amortised over the remaining maturity period of the security on constant yield basis. Such amortisation of premium is adjusted against income under the head interest on investments. A provision is made for diminution, other than temporary. Investments in subsidiaries, joint ventures and associates (both in India and abroad) are valued at historical cost except for investments in Regional Rural Banks, which are valued at carrying cost (i.e book value). iv. Available for Sale and Held for Trading categories: Each scrip in the above two categories is revalued at the market price or fair value determined as per Regulatory guidelines, and only the net depreciation of each group for each category is provided for and net appreciation, is ignored. On provision for depreciation, the book value of the individual securities remains unchanged after marking to market. v. Security receipts issued by an asset reconstruction company (ARC) are valued in accordance with the guidelines applicable to non-SLR instruments. Accordingly, in cases where the security receipts issued by the ARC are limited to the actual realisation of the financial assets assigned to the instruments in the concerned scheme, the Net Asset Value, obtained from the ARC, is reckoned for valuation of such investments. vi. Investments are classified as performing and non- performing, based on the guidelines issued by the RBI in case of domestic offices and respective regulators in case of foreign offices. Investments of domestic offices become non performing where: (a) Interest/installment (including maturity proceeds) is due and remains unpaid for more than 90 days. (b) In the case of equity shares, in the event the investment in the shares of any company is valued at Re. 1 per company on account of the non availability of the latest balance sheet, those equity shares would be reckoned as NPI. (c) If any credit facility availed by the issuer is NPA in the books of the bank, investment in any of the securities issued by the same issuer would also be treated as NPI and vice versa. (d) The above would apply mutatis-mutandis to preference shares where the fixed dividend is not paid. (e) The .investments in debentures/bonds, which are deemed to be in the nature of advance, are also subjected to NPI norms as applicable to investments.
  • 31. (f) In respect of foreign offices, provisions for non performing investments are made as per the local regulations or as per the norms of RBI, whichever is higher. vii. The Bank has adopted the Uniform Accounting Procedure prescribed by the RBI for accounting of Repo and Reverse Repo transactions [other than transactions Under the Liquidity Adjustment Facility (LAF) with the RBI]. Accordingly, the securities sold/purchased under Repo/Reverse repo are treated as outright sales/purchases and accounted for in the Repo/Reverse Repo Accounts, and the entries are reversed on the date of maturity. Costs and revenues are accounted as interest expenditure/income, as , the case may be. Balance in Repo/Reverse Repo Account is adjusted against the balance in the Investment Account. viii. Securities purchased / sold under LAF with RBI are debited / credited to Investment Account and reversed on maturity of the transaction. Interest expended / earned thereon is accounted for as expenditure / revenue. 3. . Loans /Advances and Provisions thereon 3.1 Loans and Advances are classified as performing and non-performing, based on the guidelines issued by the RBI. Loan assets become non-performing where: i. In respect of term loan, interest and/or instalment of principal remains overdue for a period of more than 90 days; ii. In respect of an Overdraft or Cash Credit advance, the account remains out of order, i.e. if the outstanding balance exceeds the sanctioned limit/ drawing power continuously for a period of 90 days, or if there are no credits continuously for 90 days as on the date of balance-sheet, or if the credits are not adequate to cover the interest due during the same period; iii. In respect of bills purchased/discounted, the bill remains overdue for a period of more than 90 days; iv. In respect of agricultural advances for short duration crops, where the instalment of principal or interest remains overdue for 2 crop seasons; v. In respect of agricultural advances for long duration crops, where the principal or interest remains overdue for one crop season. 3.2 Non-Performing advances are classified into sub- standard, doubtful and loss assets, based on the following criteria stipulated by RBI: i. Sub-standard: A loan asset that has remained non-performing for a period less than or equal to 12 months. ii. Doubtful: A loan asset that has remained in the sub-standard category for a period of 12 months. iii. Loss: A loan asset where loss has been identified but the amount has not been fully written off.
  • 32. 3-4 ,In respect of foreign offices, provisions for non performing advances are made as per the local regulations or as per the norms of RBI, whichever is higher. 3.5 The Sale of NPAs is accounted as per guidelines prescribed by the RBI, which requires provisions to - .be made for any-deficit (where sale price is lower than the net book value), while surplus (where sale price is higher than the net book value) is ignored. Net book Value is outstandings as reduced by specific provisions held and ECGC. claims received. 3.6 Advances are net of specific .loan loss provisions, unrealised interest, ECGC claims received and bills redisCounted. 3.7 For restructured/rescheduled assets, provisions are made in accordance with the guidelines issued by RBI, which requires that the present value of future interest due as per the. original loan agreement, compared with the present value of the interest expected to be earned under the restructuring package, be provided in addition to provision for NPAs. The provision for interest sacrifice, arising put of the above, is reduced from advances. 3.8 In the Gase of loan accounts classified as NPAs, an account may be reclassified as a performing account if it conforms to the guidelines prescribed by the regulators. 3.9 Amounts recovered against debts written t>ff in earlier ¦ years, arerecognised as revenue,. 3.10 Unrealised Interest recognised in the previous year on advances which have become non-performing during the current year, is provided for. 3.11 In addition to the specific provision on NPAs, general provisions are also made for standard assets as per the extant guidelines prescribed by the RBI. The provisions on standard assets are not reckoned for arriving at net NPAs. These provisions are reflected in Schedule 5 of thebalance sheet under the head Other Liabilities & Provisions - Others. 4. Floating Provisions In accordance with the Reserve* Bank of India guidelines, (he-bank has an approved policy for creation.and utilisation of floating provisions separately for advances, investments and general purpose. The quantum of floating provisions to be created would be assessed, at, the end of each financial year. The floating provisions would be utilised only for contingencies under extra ordinary circumstances specified in the policy with prior permission of Reserve Bank of India. 5. Provision for Country Exposure In addition to the specific provisions held according to the asset classification status, provisions are held for individual country exposures (other than the home country). Countries are categorised into
  • 33. seven risk categories, namely, insignificant, low, moderate, high, very high, restricted and off-credit, and provisioning made as - per extant RBI guidelines. If the country exposure Inet) Of the bank in respect of each country does not exceed 1% of the total funded assets, no provision is maintained on such country, exposures. The provision is reflected in schedule 5 of the balance sheet under the Other liabilities & Provisions - Others. 6. Derivatives 6.1 The Bank enters into derivative contracts, such as , ; foreign currency options, interest rate swaps, currency swaps, and cross currency interest rate swaps and forward rate agreements in order to hedge on-balance sheet/ off-balance sheet assets and liabilities or for trading purposes. The swap contracts: entered to hedge on-balance sheet assets and liabilities are structured in such a way that they bear an opposite and offsetting ¦ impact with; the underlying on-balance sheet items. The impact of such derivative instruments is correlated with the. movement of the underlying assets and accounted in accordance with the principles of hedge accounting. 6.2 Derivative contracts classified as hedge are recorded oil accrual basis. Hedge contracts are not marked to market unless the underlying Assets / Liabilities are also marked to .market., 6.3 Except as mentioned above, all other derivative contracts are marked to market as per the generally accepted practices prevalent in the industry. In respect of derivative contracts that are marked to market, changes in the market value are recognised in the profit and loss account in the period of change. Any receivable under derivatives contracts, which remain overdue for more than 90 days, are reversed through profit and loss account, 6.4 Option premium paid or received is recorded in profit and loss account at the expiry of the option. The Balance in the premium received on options sold and premium paid on options bought have been considered t& arrive at Mark to Market value for forex Over the Counter options, 6.5 ,Exchange Traded Foreign Exchange and Interest Rate Futures entered into for trading purposes are valued at prevailing market rates based on quoted and observable market prices and the resultant gains and tosses are,recognized in the Profit and Loss Account. 7. Fixed Assets and Depreciation 7.1 Fixed assets are carried at cost less accumulated depreciation. 7.2 Cost-- inchides cost of purchase and all expenditure such as -site preparation, installation costs and professional fees incurred on the asset before it is put to use. Subsequent expenditure incurred on assets put to use is capitalised only when it increases the future benefits from such assets or their functioning capability. 7.4 In respect of assets acquired for domestic operations during the year, depreciation is charged for half an year in respect of assets used for upto 182 days and for the full year in respect of assets used
  • 34. for more than 182 days, except depreciation on computers, ATM and software, which is charged for the full year irrespective of the period for which the asset was put to use. 7.5 Items costing less than Rs. 1,000 each are charged off in the year of purchase. 7.6 In respect of leasehold premises, the lease premium, if any, is amortised over the period of lease and the lease rent is charged in the respective year. 7.7 In respect of assets given on lease by the Bank on or before 311 March 2001, the value of the assets given on lease is disclosed as Leased Assets under fixed assets, and the difference between the annual lease charge (capital recovery) and the depreciation is taken to Lease Equalisation Account. 7.8 In respect of fixed assets held at foreign offices, depreciation is provided as per the regulations /norms of the respective countries. 8. Leases The asset classification and provisioning norms applicable to advances, as laid down in Para 3 above, are applied to financial leases also. 9. Impairment of Assets Fixed Assets are reviewed for impairment whenever events or changes in circumstances warrant that the carrying amount of an asset may not be recoverable. Recoverability of assets to be held and used is measured by a comparison of the carrying amount of an asset to future net discounted cash flows expected to be generated by the asset. If such assets are considered to be impaired, the impairment to be recognised is measured by the amount by which the carrying amount of the asset exceeds the fair value of the asset. 10. Effect of changes in the foreign exchange rate 10.1 Foreign Currency Transactions i. Foreign currency transactions are recorded on initial recognition in the reporting currency by applying to the foreign currency amount the exchange rate between the reporting currency and the foreign currency on the date of transaction. ii. Foreign currency monetary items are reported using the Foreign Exchange Dealers Association of India (FEDAI) closing spot/forward rates. iii. Foreign currency non-monetary items, which are carried in terms at historical cost, are reported using the exchange rate at the date of the transaction. iv. Contingent liabilities denominated in foreign currency are reported using the FEDAI closing spot rates. v. Outstanding foreign exchange spot and forward contracts held for
  • 35. trading are revalued at the exchange rates notified by FEDAI for specified maturities, and the resulting profit or loss is included in the Profit and Loss account. vi. Foreign exchange forward contracts which are not intended for trading and are outstanding at the balance sheet date, are valued at the closing spot rate. The premium or discount arising at the inception of such a forward exchange contract is amortised as expense or income over the life of the contract. vii. Exchange differences arising on the settlement of monetary items at rates different from those at which they were initially recorded are recognised as income or as expense in the period in which they arise. viii. Gains / Losses on account of changes in exchange rates of open position in currency futures trades are settled with the exchange clearing house on daily basis and such gains / losses are recognised in the profit and loss account. 10.2 Foreign Operations Foreign Branches of the Bank and Offshore Banking Units have been classified as Non-integral Operations and Representative Offices have been classified as Integral Operations. a. Non-integral Operations i. Both monetary and non-monetary foreign currency assets and liabilities including contingent liabilities of non-integral foreign operations, are translated at closing exchange rates notified by FEDAI at the balance sheet date. ii. Income and expenditure of non-integral foreign operations ace translated at quarterly average closing rates. iii. Exchange differences arising on net investment in non-integral foreign operations are . accumulated in Foreign Currency Translation Reserve until the disposal of the net investment. iv. The Assets and Liabilities of foreign offices in foreign currency (other than local currency of the foreign offices) are translated into local currency using spot rates applicable to that country. b. Integral Operations i. Foreign currency transactions are recorded on initial recognition in the reporting currency by applying to the foreign currency amount the exchange rate between the reporting currency and the foreign currency on the date of transaction. ii. Monetary foreign currency assets and liabilities of integral foreign operations are translated at closing exchange rates notified by FEDAI at the balance sheet date and the resulting profit/ loss is included in the profit and loss account. iii. Foreign currency non-monetary items which are carried in terms of historical cost are reported using the exchange rate at the date of the
  • 36. transaction. 11. Employee Benefits 11.1 Short Term Employee Benefits The undiscounted amount of short-term employee benefits, such as medical benefits, casual leave etc. which are expected to be paid in exchange for the services rendered by employees are recognised during the period when the employee renders the service. 11.2 Post Employment Benefits i. Defined Benefit Plan a. The Bank operates a Provident Fund scheme. All eligible employees are entitled to receive benefits under the Banks Provident Fund scheme. The Bank contributes monthly at a determined rate (currently 10% of employees basic pay plus eligible allowance). These contributions are remitted to a trust established for this purpose and are charged to Profit and Loss Account. The trust funds are retained as deposits in the bank. The bank is liable for annual contributions and interest on deposits held by the bank, which is payable at Government specified minimum rate of interest on provident fund balances of Government Employees. The bank recognises such annual contributions and interest as an expense in the year to which they relate. b. The bank operates gratuity and pension schemes which are defined benefit plans. c. The Bank provides for gratuity to all eligible employees. The benefit is in the form of lump sum payments to vested employees on retirement, on death while in employment, or on termination of employment, for an amount equivalent to 15 days basic salary payable for each completed year of service, subject to a maximum amount of Rs. 350,000. Vesting occurs upon completion of five years of service. The Bank makes annual contributions to a fund administered by trustees based on an independent external actuarial valuation carried out annually. d. The Bank provides for pension to all eligible employees. The benefit is in the form of monthly payments as per rules and regular payments to vested employees on retirement, on death while in employment, or on termination of employment. Vesting occurs at different stages as per rules. The pension liability is reckoned based on an independent actuarial valuation carried out annually. The Bank makes annual contribution to the pension fund at 10% of salary in terms of SBI Pension Fund Rules. The balance is retained in the special provision account to be utilised at the time of settlement. e. The cost of providing defined benefits is determined using the projected unit credit method, with actuarial valuations being carried out at each balance sheet date. Actuarial gains/losses are immediately recognised in the statement of profit and loss and are not deferred. ii. Other Long Term Employee benefits
  • 37. a. All eligible employees of the bank are eligible for compensated absences, silver jubilee award, leave travel concession, retirement award and resettlement allowance. The costs of such long term employee benefits are internally funded by the Bank. b. The cost of providing other long term benefits is determined using the projected unit credit method with actuarial valuations being carried out at each balance sheet date. Past service cost is immediately recognised in the statement of profit and loss and is not deferred. 12. Provision for Taxation 12.1 Income tax expense is the aggregate amount of current tax and deferred tax. Current year taxes are determined in accordance with the provisions of Accounting Standard 22 and tax laws prevailing in India after taking into account taxes of foreign offices, which are based on the tax laws of respective jurisdiction. Deferred tax adjustments comprise of changes in the deferred tax assets or liabilities during the period. 12.2 Deferred tax assets and liabilities are measured using tax rates and tax laws that have been enacted or substantially enacted prior to the balance sheet date. Deferred tax assets and liabilities are recognised on a prudent basis for the future tax consequences of timing differences arising between the carrying values of assets and liabilities and their respective tax basis, and carry forward losses. The impact of changes in the deferred tax assets and liabilities is recognised in the profit and loss account, 12.3 Deferred tax assets are recognised and reassessed at each reporting date, based upon managements judgement as to whether realisation is considered certain. Deferred tax assets are recognised on carry forward of unabsorbed depreciation and tax losses only if there is virtual certainty that such deferred tax assets can be realised against future profits. 13. Earning per Share 13.1 The Bank reports basic and diluted earnings per share in accordance with AS 20 -Earnings per Share issued by the ICAI. Basic earnings per share are computed by dividing the net profit after tax by the weighted average number of equity shares outstanding for the year. 13.2 Diluted earnings per share reflect the potential dilution that could occur if securities or other contracts to issue equity shares were exercised or converted during the year. Diluted earnings per share are computed using the weighted average number of equity shares and dilutive potential equity shares outstanding at year end. 14. Accounting for Provisions, Contingent Liabilities and Contingent Assets 14.1 In conformity with AS 29, Provisions, Contingent Liabilities and Contingent Assets, issued by the Institute of Chartered Accountants of India, the Bank recognises provisions only when it has a present obligation as a result of a past event, it is probable that an outflow
  • 38. of resources embodying economic benefits will be required to settle the obligation, and when a reliable estimate of the amount of the obligation can be made. 14.2 No provision is recognised for i. any possible obligation that arises from past events and the existence of which will be confirmed only by the occurrence or non-occurrence of one or more uncertain future events not wholly within the control of the Bank; or ii. any present obligation that arises from past events but is not recognised because a. it is not probable that an outflow of resources embodying economic benefits will be required to settle the obligation; or b. a reliable estimate of the amount of obligation cannot be made. Such obligations are recorded as Contingent Liabilities. These are assessed at regular intervals and only that part of the obligation for which an outflow of resources embodying economic benefits is probable, is provided for, except in the extremely rare circumstances where no reliable estimate can be made. 14.3 Contingent Assets are not recognised in the financial statements as this may result in the recognition of income that may never be realised. 15. Cash and cash equivalents Cash and cash equivalents include cash on hand and in ATMs, and gold in hand, balances with RBI, balances with other banks, and money at call and short notice. 16. Employee Share Purchase Scheme In accordance with the Employee Stock Option Scheme and Employee Stock Purchase Scheme Guidelines, 1999 issued by the Securities and Exchange Board of India (SEBI), the excess of market price one day prior to the date of issue of the shares over the price at which they are issued is recognised as employee compensation cost. 17. Share Issue Expenses Share issue expenses are charged to the Share Premium Account. --------------------------- in Rs. Cr. Finished Products Mar 2010 --------------------------- Product Name Unit Installed Production Sales Sales Capacity Quantity Quantity Value Interest & Discount on Advances & Bills - NA NA NA 50,632.64
  • 39. Income From Investment - NA NA NA 17,736.30 Income From Brokerage & Commission - NA NA NA 9,640.86 Income From Sale Of Share & Securities - NA NA NA 2,116.79 Interest On Balances with RBI and - NA NA NA 1,511.92 Other Inter-Bank Funds Interest - NA NA NA 1,113.06 Income From Dividend - NA NA NA 573.48 Lease Rentals - NA NA NA 9.19 Income From Finance - NA NA NA 0.00 Lease / H.P Management Fees - NA NA NA 0.00 Others - NA NA NA 0.00 Total 83,334.24 Competition Last Price Market Cap. Net Interest Net Profit Total Assets (Rs. cr.) Income SBI 2,265.05 143,804.09 70,993.92 9,166.05 964,432.08 PNB 1,046.20 32,986.95 21,466.91 3,905.35 296,632.79 Bank of Baroda 715.55 26,155.50 16,698.34 3,058.33 278,316.71 Bank of India 357.00 18,774.99 17,877.99 1,741.07 274,966.46 Canara Bank 451.25 18,501.25 18,751.96 3,021.43 264,741.09 Union Bank 310.80 15,699.06 13,302.68 2,074.92 195,161.85 Indian Bank 220.70 9,485.02 7,857.06 1,554.99 84,121.74 IDBI Bank 119.25 8,643.98 15,272.63 1,031.13 233,572.01 Oriental Bank 320.30 8,024.79 8,856.47 905.42 137,431.00
  • 40. Corporation Ban 514.90 7,385.73 7,294.60 1,170.25 111,667.30 Company Facts - SBI Registered Address State Bank Bhavan, Central Office,,8th Floor, Madame Cama Marg, Mumbai Maharashtra 400021 Tel: 022-22883888 22022678 Fax: 022-22855348 Email: investor.complaints@sbi.co.in Website: http://www.sbi.co.in Group: SBI Group Explore SBI connections Registrars Datamatics Financial Services Ltd. Plot Nos. A-16 & 17, MIDC Part-B, Cross Lane, Marol, Andheri (E) Tel: 66712151, 66712152, 66712153, 66712154, 66712155, Fax: 66712161, 66712230 Email: Investorsqry@dfssl.com Website: http://www.dfssl.com Management - SBI Name Designation O P Bhatt Chairman / Chair Person R Sridharan Managing Director Dileep C Choksi Director D Sundaram Director Md. Salahuddin Ansari Director Rajiv Kumar Director Shyamala Gopinath Director Name Designation S K Bhattacharyya Managing Director Ashok Jhunjhunwala Director S Venkatachalam Director Deva Nand Balodhi Director Vasantha Bharucha Director Ashok Chawla Director
  • 41. Listing Details - State Bank of India Key Dates Year Ending Month Mar AGM Date (Month) Jun Book Closure Date (Month) Jun Listing Information Face Value Of Equity Shares 10 Market Lot Of Equity Shares 1 BSE Code 500112 NSE Code SBIN BSE Group A Whether The Company Forms A Part Of The Following Indices - Sensex Yes Nifty Yes BSE-100 Yes BSE-200 Yes S&P CNX 500 Yes CNX Midcap No CNX FMCG No Listing On The Stock Exchange, Mumbai, National Stock Exchange of India Listed On Ltd., London Stock Exchange AGM/EGM Announcement Purpose Date Book Closure Remarks Date From To 11-05-2010 AGM 16-06-2010 11-06-2010 16-06-2010 Rs.20.00 per share(200%)Dividend 18-05-2009 AGM 19-06-2009 12-06-2009 19-06-2009 290% Dividend 01-12-2008 EGM 12-01-2009 - - To elect one Director to the Central Board of the Bank under the provisions of Section 19(c) read with Section 25(2) of the State Bank of India Act, 1955.