TRMM observation for global rainfall prediction and flood monitoring study
•
5 j'aime•843 vues


Recommandé
Contenu connexe
Tendances
Tendances (20)
Similaire à TRMM observation for global rainfall prediction and flood monitoring study
Similaire à TRMM observation for global rainfall prediction and flood monitoring study (20)
Plus de Shristi Pradhan
Plus de Shristi Pradhan (8)
Dernier
Dernier (20)
TRMM observation for global rainfall prediction and flood monitoring study
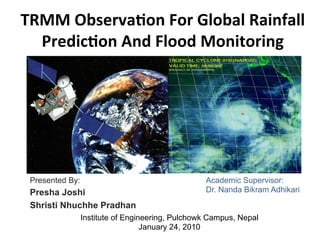
- 1. TRMM Observa,on For Global Rainfall Predic,on And Flood Monitoring Presented By: Presha Joshi Shristi Nhuchhe Pradhan Academic Supervisor: Dr. Nanda Bikram Adhikari Institute of Engineering, Pulchowk Campus, Nepal January 24, 2010
- 2. INTRODUCTION • Tropical Rainfall Measuring Mission (TRMM) • Before TRMM global distribu8on of rainfall at the Earth's surface had uncertain8es of the order of 50% • Measures the ver8cal distribu8on of precipita8on over the tropics in a band between 35 degrees north and south la8tudes • Improves modelling of tropical rainfall processes and their influence on global circula8on
- 3. INSTRUMENTS IN TRMM § Precipita8on Radar (PR) Ø Horizontal resolu8on: 3.1 miles (5 km) Ø Swath width: 154 miles (247 km) Ø Ver8cal profiles: about 12 miles (20 km). Ø Radar frequency : 3 8mes greater than a ground radar § TRMM microwave imager (TMI) Ø Passive microwave sensor Ø Provide quan8ta8ve rainfall informa8on over a wide swath under the TRMM satellite. Ø Quan8fy the water vapour, the cloud water, and the rainfall intensity in the atmosphere http://trmm.gsfc.nasa.gov
- 4. INSTRUMENTS IN TRMM (contd...) § Visible and InfraRed Scanner (VIRS) Ø Senses radia8on coming up from the Earth in five spectral regions, ranging from visible to infrared Ø Can be used to determine the brightness (visible and near infrared) or temperature (infrared) of the source. § Cloud and Earth Radiant Energy Sensors (CERES) Ø Study the energy exchanged between the Sun; the Earth’s atmosphere, surface and clouds; and space. Ø Es8mate energy levels within the atmosphere and at the Earth’s surface. § Lightning Imaging Sensor (LIS) Ø Detects and locates lightning over the tropical region of the globe.
- 6. AVERAGE RAINFALL OF PAST 3 DAYS http://precip.gsfc.nasa.gov
- 7. Rain informa8on from Real-‐Time TRMM Mul8-‐Satellite Precipita8on Analysis
- 9. ASIA Disaster Watch Early May 2008 Cyclone Nargis at Burma • Worst natural disaster in the history of Burma • Deadliest named cyclone in the North Indian Ocean Basin • Category 4 cyclone(very severe) • Landfall on May 2, 2008 • Wind speed: 132 mph Rainfall analysis derived from TRMM's Precipita,on Radar (PR) and TRMM Microwave Imager instruments (TMI) overlaid on infrared and visible images from TRMM's Visible and Infrared Scanner (VIRS).
- 10. Flood inunda,on maps of Burma as tropical cyclone NARGIS moved in from Bay of Bengal from April 25 to May 5, 2008 Cyclone NARGIS track • >1,38,000 death • >1 million homeless • Damage: $10 billion http://earthobservatory.nasa.gov
- 11. • Flooding and landslides due to heavy rainfall • The TRMM-‐based, near-‐real ,me Mul,-‐satellite Precipita,on Analysis (MPA) at the NASA Goddard Space Flight Center monitors rainfall over the global Tropics. • Rainfall amounts upwards of 400 mm (15.7 Inches) are shown in red over southern Burma.
- 12. The most populous division and most affected division of Burma, Ayeyarwady Near landfall on Burma Seen from MODIS on the Terra Satellite, May2 The low lying Irrawady Delta was the hardest hit region. Eleva,on data is based on NASA Shu_le Radar Topography Mission (SRTM) http://www.nasa.govhttp://en.wikipedia.org
- 13. Homes destroyed in the city of Yangon, Burma An aerial view of destruc,on caused by Nargis People devastated Satellite photography: Before and Aaer Nargis http://earthobservatory.nasa.gov
- 14. OBSERVATION ON May 5, 2008 • Image by Moderate Resolu,on Imaging Spectroradiometer (MODIS) sensors on NASA’s Terra and Aqua satellites. • Cloud-‐free observa,ons to get the clearest possible picture • Flooded areas are blue, ci,es are red, and tree cover appears in shades of green (dense tree cover) to pale yellow (sparse tree cover) • Flooding appears to be more intense in areas with fewer trees • Cyclone Nargis flooded about 14,402 square kilometers in the Irrawaddy River Delta in Burma
- 15. CONCLUSION • TRMM observa8ons helped in the modeling of tropical rainfall processes and their influence on global circula8on leading to beber predic8ons of rainfall and its variability at various 8me scales. • Remote sensing techniques are used to measure and monitor the extent of flooded areas and es8mate the amount of land and infrastructure affected.
- 16. THANK YOU !
- 17. QUESTIONS ?