HTML Injection Attacks: Impact and Mitigation Strategies
water surveys and designs
1. Water Surveys and Designs
Explains survey techniques and gives standard designs
with average costs on water supply structures
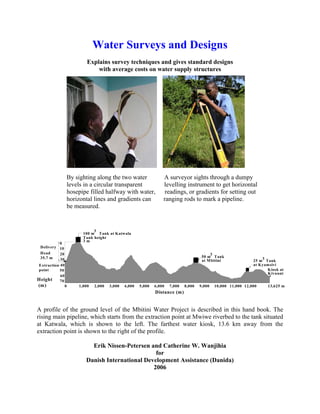
By sighting along the two water A surveyor sights through a dumpy
levels in a circular transparent levelling instrument to get horizontal
hosepipe filled halfway with water, readings, or gradients for setting out
horizontal lines and gradients can ranging rods to mark a pipeline.
be measured.
3
100 m Tank at Katwala
Tank height
3m
0
Delivery 10
Head 20 3
35.7 m 50 m Tank 3
30 at Mbitini 25 m Tank
Extraction 40 at Kyamsivi
point 50 Kiosk at
Kivuuni
60
Height 70
(m) 0 1,000 2,000 3,000 4,000 5,000 6,000 7,000 8,000 9,000 10,000 11,000 12,000 13,625 m
Distance (m)
A profile of the ground level of the Mbitini Water Project is described in this hand book. The
rising main pipeline, which starts from the extraction point at Mwiwe riverbed to the tank situated
at Katwala, which is shown to the left. The farthest water kiosk, 13.6 km away from the
extraction point is shown to the right of the profile.
Erik Nissen-Petersen and Catherine W. Wanjihia
for
Danish International Development Assistance (Danida)
2006
2. Technical handbooks in this series :
Titles Contents
1 Water for rural communities Lessons learnt from Kitui pilot projects
2 Water supply by rural builders Procedures for being rural contractors
3 Water surveys and designs Survey, design and cost of water projects
4 Water from rock outcrops Rock catchment tanks, masonry and earth dams
5 Water from dry riverbeds Wells, subsurface dams, weirs and sand dams
6 Water from roads Rainwater harvesting from roads
7 Water from small dams Ponds and small earth dams built manually
8 Water from roofs Various types of roof catchments for domestic use
These handbooks can be obtained free of charge by either collecting them from the office of ASAL
Consultants Ltd., or by paying through bank transfer the cost of sending the manuals by courier. For
further details, please contact: asal@wananchi.com with copy to asalconsultants@yahoo.com
Published by
ASAL Consultants Ltd. for
the Danish International Development Assistance (Danida) in Kenya
Text by
Erik Nissen-Petersen and Catherine W. Wanjihia
Photos and sketches by
Erik Nissen-Petersen
Computer drawings and tracing by
Catherine W. Wanjihia
Editing by
Prof. Elijah K. Biamah
Proofs by
Prof. Elijah K. Biamah, Amin Verjee and Steen S. Larsen
Printer
Modern Lithographic (K) Ltd., P.O. Box 52810-00200, Nairobi, Kenya
Website by
Edwin Ondako
Distribution by
ASAL Consultants Ltd. P.O. Box 739, Sarit 00606, Nairobi, Kenya
asal@wananchi.com asalconsultants@yahoo.com
Fax/Tel : 254 020 2710296 and 4766144 Mobiles: 0733 619 066 and 0722 599 165
Website : www.waterforaridland.com
Copyright.
The copyright of this handbook is the property of the Royal Danish Embassy in Kenya.
Downloading from the internet and photocopying of the handbooks is permitted provided the
source is acknowledged.
ii
3. Contents
Acknowledgement ……………………………………………………………….. v
Acronyms …………………………………………………………………………. vi
Foreword ………………………………………………………………………….. vii
Chapter 1. Surveys, designs and proposals ………………………………… 1
1.1 Purpose of surveys ………………………………………………… 1
1.2 Brief surveys for draft proposals …………………………………... 2
1.3 Water Services Boards ……………………………………….……. 3
1.4 Simple equipment for brief surveys ………………………….…… 4
1.5 Guidelines for writing draft proposals ……………………………. 5
1.6 Construction costs of structures built to the MoWI designs ………. 6
1.7 Surveyor’s information to communities ………………………….. 7
1.8 Categories of surveyors …………………………………………… 7
1.9 Satellite surveys …………………………………………………… 8
Chapter 2. Surveys and designs of rising main pipeline…………………….. 10
2.1 The project area to be surveyed……………………………………. 10
2.2 A surveyor’s equipment …………………………………………… 11
2.3 Description of survey procedure for the rising main ……….……... 13
2.4 Technical description of surveying rising mains …………….……. 16
2.5 Rising main ………………………………………………………... 21
2.6 Required size and type of pipe for the rising main………………… 21
2.6 Required capacity of pumps and generators ………………………. 22
Chapter 3. Design, BQ and cost of the rising main for Mbitini Project…… 24
3.1 A hand-dug well…………………………………………………… 24
3.2 Infiltration pipes …………………………………………………… 25
3.3 A sand dam ……………………………………….……………….. 26
3.4 An elevated Mbitini pump house………………………….……….. 28
3.5 The rising main ……………………………………………………. 31
3.6 The head tank……………………………………………… ……… 32
Chapter 4. Main gravity distribution line……………………………………. 35
4.1 Gravity flow of water in pipes …………………………………….. 35
4.2 Survey of Mbitini gravity distribution pipeline …………………… 36
4.3 Hydraulic calculations on the main gravity distribution pipeline…. 37
4.4 uPVC water pressure pipes ……………………………………….. 38
4.5 Sizes, types, friction losses and hydraulic gradients for pipes .……. 39
4.6 Air valves …………………………………………………………. 41
4.7 Wash outs …………………………………………………………. 41
4.8 Precast concrete plates …………………………………………….. 41
4.9 Valve chambers ……………………………………………………. 42
Chapter 5. Designs, BQs and costs of water structures …………………… 43
5.1 Water kiosk ………………………………………………………. 43
5.2 50 cubic metres water tank ………………………………………. 47
5.3 25 cubic metres water tank ………………………………………. 50
5.4 Gravity main pipeline ……………………………………………. 54
iii
4. Chapter 6. Economic viability of Mbitini water project…………………… 55
6.1 Baseline data on Mbitini community……………………………… 55
6.2 Mbitini water project’s structure …………………………………. 55
6.3 Mbitini water project’s cost……………………………………….. 55
6.4 Income from water sales ………………………………………….. 56
6.4 Recurrent monthly expenditure …………………………………….56
6.6 Monthly income, expenditure and balance………………………… 56
Chapter 7. Legal requirements for professional personnel………………. 57
7.1 Registered Engineer……………………………………………… 57
7.2 Registered Architects and Quantity Surveyors…………………….. 57
7.3 Registered Surveyors………………………………………………..58
7.4 Registered Contractors……………..……………………………… 58
iv
5. Acknowledgements
Sincere thanks are due to Birgit Madsen of the Royal Danish Embassy in Kenya who
saw the importance of documenting the techniques and experiences of sustainable and
affordable structures for various water supply systems.
Many thanks are also due to the engineers and economists of the Ministry of
Agriculture and the Ministry of Water and Irrigation in Kenya and other countries
with whom we have developed sustainable water projects for more than three
decades.
Also many thanks are due to the hundreds of builders and thousands of community
members we worked together with on building reliable water supplies based mainly
on rainwater harvesting in the arid and semi-arid (ASAL) regions of Africa.
Special thanks are due to the team that assisted me in producing this series of
handbooks. The team consisted of Catherine W. Wanjihia, who computerised the
technical drawings and compiled bills of quantities. To Mr Amin Verjee and Steen
Larsen who proof-read the text several times and to Prof. Elijah K. Biamah and Mr.
Gabriel Mukolwe who edited the handbooks. Thanks are also due to Mr Oliver who
supervised the printing and Mr Edwin Ondako who loaded the handbooks onto the
internet.
Erik Nissen-Petersen
Managing Director
ASAL Consultants Ltd.
P.O. Box 739, 00606, Nairobi, Kenya
Tel/fax 254 (0)20 2710296 / 4766144
Mobile 0733 619066 / 0722 599144
v
6. Acronyms and Abbreviations
ASAL - Arid and Semi-arid Land
BQ - Bill of Quantities
BS - British Standard
cm - Centimetres
g - gauge
GS - Galvanized steel
GI - Galvanized iron
GL - Ground level
Hardcore - Crushed stones
HGL - Hydraulic Grade line
km - Kilometre
KVA - Kilo Volts Ampere
kW - Kilo Watt
KWSP - Kenya Water and Sanitation Programme
m - Metre
mm - Millimetre
m2 - Square metre
m3 - Cubic metre
MoWI - Ministry of Water and Irrigation
PVC - Poly Vinyl Conduits
RWSS - Rural Water Supply and Sanitation
uPVC - Ultra Poly Vinyl Conduits
Y8 - 8 mm twisted iron bar
Y10 - 10 mm twisted iron bar
WL - Water level
WSBs - Water Service Boards
WSP - Water Service Provider
Measurements and Conversions
Length 1 metre = 3.28 feet
1 km = 0.62 miles
Area 1 acre = 4,047 m2 = 0.4047 hectares (ha)
1 ha = 10,000 m2 = 2.471 acres
2
1km = 100 ha = 247.1 acres
Volume 1 litre = 1.75 pints = 0.22 Imp gallons (or 0.26 US galls)
1 m3 = 1,000 litres (l) = 220 Imp gallons (or 260 US gallons)
1 Imperial gallon = 4.550 l
1 US gallon = 3.785 l
Weight 1 tonne = 1,000 kg
1 British ton = 1,016 kg
1 US ton = 907 kg
Volumes and weight of materials
1 m3 water = 1,000 kg
1 m3 dry soil = 1,230 to 2,000 kg
1 m3 compacted soil = 2,180 kg, approximately
1 m3 loose gravel = 1,745 kg, approximately
1 m3 stones = 2,400 kg to 2,900 kg
vi
7. Foreword
The concept of water availability is very crucial especially in arid and semi arid lands.
It is therefore inevitable to explore sustainable water sources like shallow
wells/boreholes, runoff water harvesting, sand storage dams, earth dams and pumping
of water from permanent rivers. The exploitation of these water sources has cost
implications, which must be considered at the design stage. That is the reason for
having to choose a reasonably affordable option. When doing so, it is obvious that the
water demand is high and the beneficiaries are low-income earners.
It is with these prevailing environmental conditions that many communities living in
these areas of water scarcity opt for community based water projects to collectively
achieve this goal of sustainable water availability. Donor funded projects usually
simplify this endeavour through their support in terms of provision of cheap labour,
available local materials and cost sharing.
This booklet contains some fundamental applications of water surveys and designs of
piped water. The techniques and procedures of surveying and implementation of a
water project including the equipment used are well discussed. Cost is revealed in
bills of quantities, purchase of pipes, choice of pump, water tanks and other
accessories. Economic viability and legal aspects of personnel involved are laid out
for the project in this booklet while the stakeholders who are mainly the beneficiaries
are also articulated. The main aim of this booklet is to raise awareness to have an
overview of what it entails to have clean water at a water kiosk facility for instance
and the cost implications of labour, material and equipment. The procedural
techniques of surveys of the pipeline are elaborated in detail including the standard
designs of the structures and recommendations of ideal scenarios.
A case study of the Mbitini Water Project has been used to explain the procedural
requirements when surveying and designing a community water project. A stretch of
over 12 km was surveyed, implemented and a longitudinal profile developed in which
water was pumped from a river with a head of over 71 m to the highest point in the
project area and stored in water tanks such that it could serve the downstream
beneficiaries by gravity. Other storage tanks were strategically placed for storage and
distribution to over ten water kiosks. The efforts of planning and implementing this
project, if well taken into account can transform the entire arid lands from water
scarcity to water security areas in Kenya.
Eng. F.K. Kyengo
Programme Coordinator
Kenya Water and Sanitation Programme (KWSP)
Ministry of Water and Irrigation
P.O. Box 49720
Nairobi, Kenya
vii
8. Chapter 1. Surveys, designs and proposals
1.1 Purpose of surveys
Surveys of proposed water projects are required for several purposes, such as establishing
whether a proposed water project can supply the required volume of water for its
intended users (water demand), if a proposed water project is financially viable, and for
writing a proposal to the Water Services Boards for financial and technical assistance.
In the past, many water projects were built without considering their financial viability
and without training the project committees in financial management. The result of that
policy is the many abandoned water projects all over Africa.
Surveys of proposed water projects should provide the following data:
1) The capacity of the water source, i.e. the number of people it can serve. It is
important to know the volume of water that can be extracted from a water source
throughout the year. Otherwise water may not reach people living towards the end
of a pipeline. Also, if the construction cost is too high per unit volume of water
supplied from the project, nobody may have an interest in funding the project.
2) Data for designing the structures required for constructing the water project. It is
equally important to install the correct size and type of pump, pipes and tanks for
the water source. If a water project is over-designed, it may not be financed
because it is too expensive per unit of water it can deliver. On the other hand, if
the pump, pipes and tanks are under-designed, the cost ratio will look good, but
water will be wasted at the source, instead of benefiting the maximum number of
people.
3) A bill of quantities (BQ) - a list of required labour and materials with their costs,
for the construction of the designed structures. It is preferable to use the standard
designs and their BQs presented in this handbook to avoid miscalculations.
4) The costs of operation and maintenance, also called recurrent costs. These costs
include fuel, spare-parts and maintenance of pumps and generators, salaries for
pump/generator operators, line patrollers/repair teams, kiosk attendants, fee
collectors, accountants, committee members, bank charges, etc.
In addition to these costs, an amount of about Ksh 30,000 should be deposited in
the bank account every month to cover unforeseen expenditures, such as repair or
replacement of a pump or generator that the warranty does not cover.
Also funds should be set-aside in the bank account to finance possible extensions
of the pipelines. At Kisasi Water Project they say; “Selling water is a good
business and the business gets better when there are more customers”. They
have therefore extended their 16 km long pipeline by an additional 6 km.
1
9. 5) Cost analysis of the expenditures versus the income from sale of water that show
whether the project is financially viable. Providing water is like any other
business. There must be more money coming in than going out, otherwise the
enterprise will go bankrupt and people will not get any water. If a cost analysis
shows that a project is not economically viable, it may be difficult to obtain
funding.
6) Technical and financial data for writing a proposal that can be presented to the
WSB or a donor.
The cost of carrying out such a professional survey is about Ksh 2,000 per working day
in addition to about Ksh 2,000 per day for hiring of equipment and allowances for
transport, food and accommodation. An experienced surveyor is expected to survey 3 km
of pipeline in the field in a day, including transport and meetings with the community.
The approximate survey cost per km of pipeline is therefore Ksh 4,000/3 = Ksh 1,333.
The Mbitini Water Project, which is described on the next pages, has 23 km of pipeline.
The working days in the field should therefore have taken 8 working days (23 km / 3 km)
@ Ksh 4,000 = Ksh 32,000. The office work of transferring the field data into a Survey
Report is estimated to take twice as many days as the field work, which is 16 working
days costing Ksh 4,000 per day = Ksh 64,000. The total cost of the survey of Mbitini
Water Project would therefore be about Ksh 96,000, say Ksh 100,000.
The cost for an engineer to work out the sizes and type of pipes, pump, generator, water
tanks, water kiosks, air-valves and wash-outs using standard designs, as well as
compiling all this data into a Project Document will cost about double the price of the
survey, thus Ksh 200,000. A final Project Document that can be presented as a proposal
to the WSB for a water project with 23 km of pipelines could therefore be about Ksh
300,000.
1.2 Brief surveys for draft proposals
It is therefore costly for a community to hire a surveyor and an engineer to carry out a
complete survey with designs, BQs and costs as well as presenting and getting a proposal
approved by the WSB or a donor. In fact, some proposals may never be approved and the
investment in such proposals will be lost.
It is therefore more economical to make a brief survey and forward a draft proposal to the
WSB. If the WSB is willing to finance the proposed project, they may, most likely,
finance a professional survey and a Project Document as a final proposal.
A brief survey and a draft proposal can be carried out by a surveyor or an engineer who
has retired or who would like to work during their vacation. Such a task would only take
about ten days and cost about Ksh 40,000 in total, at Ksh 4,000 per day, or possibly less
if transport, food and accommodation are provided free of charge.
2
10. 1.3 Water Services Boards
There are 7 Water Services Boards (WSBs) in Kenya. Project proposals should be
presented to the WSB covering the relevant project area. The WSBs addresses are:
⇒ Athi Water Services Board, P.O. Box 45283, 00100 Nairobi
⇒ Tana Water Services Board, P.O. Box 1343, Nyeri
⇒ Coast Water Services Board, P.O. Box 90417, Mombasa
⇒ Rift Valley Water Services Board, P.O. Box 220, Nakuru
⇒ Lake Victoria South Water Services Board, P.O. Box 3325, Kisumu
⇒ Lake Victoria North Water Services Board, P.O. Box 673, Kakamega
⇒ Northern Water Services Board, P.O. Box 495, Garissa
A map showing the regional WSBs in Kenya
3
11. 1.4 Simple equipment for brief surveys
The expensive levelling instrument shown
in the next chapter can be replaced with a
1 metre length of transparent hosepipe that
is bent in a circle and filled halfway with
water.
When sighting along the two water
levels in the hosepipe an exact horizontal
line is projected forward.
Horizontal contour lines are found by Gradients are found by sighting onto a stick
2 persons having same eye height. marked with measurements, and
Source:Water from Ponds ,Pans and Dams measuring the distance between the sticks
Erik Nissen-Petersen for RELMA/Sida. and the person. Source: Water from Sand
Rivers by Erik Nissen-Petersen for RELMA.
The expensive Theodolite for measuring
angles can be replaced by either reading the
grades on a compass, or sighting along two
rulers laid onto a protractor as shown.
4
12. 1.5 Guidelines for writing draft proposals
⇒ Start with the name, postal address, telephone number, sub-location,
location and district of the community organisation that should be
registered with the Ministry of Social Services. The proposal should be
signed by the project committee that has been elected by the community.
⇒ Thereafter explain the exact location of the proposed water project with
the name and distance to the three nearest villages so that the project can
be plotted on a map.
⇒ Now describe the type of water project in general terms. Is it a new
project, or rehabilitation or extension of an old one? Is it an earth dam, a
hand-dug well, a subsurface dam, a weir, a sand dam, a rock catchment, a
borehole, or gravitated water from a spring, or what is it?
⇒ Then state what the water will be used for, e.g. domestic, livestock or
irrigation? Also state how much water will be required per day all year
round. Can the yield of the water source supply sufficient water in demand
every day of the year?
⇒ How much money will the construction work and the community training
cost? Some actual construction costs of various types of structures for
water projects are given on the next page.
⇒ How much of the construction and training costs can be raised by the local
community for cost-sharing, in the form of local skills, local labour,
locally available materials, accommodation and transport?
⇒ How is the financial viability of the proposed project?
⇒ Who has surveyed and designed the project?
⇒ Which contractor or organisation would the community prefer to assist
them with the construction work and community training?
⇒ Attach the surveyor’s report with sketches and the engineer’s project
document with designs and BQs.
5
13. 1.6 Construction cost of structures built to MoWI design in Kitui in
2005 (in Ksh).
Type of structures of Survey, designs, Community Total cost of MoWI cost
MoWI design of high builders, material contribution construction estimates in
quality and with an and transport by selling works, 2004
expected lifespan of 20 labour and including
years materials for community
50% below contribution
market price
A 6" x 9" x 18" 50 24 74
concrete block
A 9" x 9" x 18" 77 36 113
concrete block
A latrine slab, 569 89 658
122 x 122 cm
A fence concrete post 478 67 545 850
A 25 cubic metre tank 214,210 76,600 290,810 337,180
A 50 cubic metre tank 331,205 99,620 430,925 444,525
A 100 cubic metre tank 627,720 190,800 818,520 719,560
An elevated 50 cubic 1,236,019 41,602 1,277,621 2,800,000
metre steel tank
An elevated pump 596,810 177,250 773,060 1,017,800
house
A water kiosk 93,165 25,200 118,365 99,610
A chamber for air-valve 7,427 3,160 10,587 11,794
and wash-out
A rectangular trough 33,091 18,524 51,615 62,600
A circular trough 9,046 3,213 12,259
A washing stand 18,389 8,019 26,408
Subsurface dam of soil 68,600 35,250 103,850 1,027,000
River extraction point 159,040 53,120 212,160 993,086
Sand dam of masonry 377,200 170,850 548,050 1,027,000
Fence 150 m long 84,508 25,258 109,766 123,225
Excavating trenches, From 219 to From 108 to From 327 to
laying 6 m of UPVC 7,155 for 6 m 180 for 6 m 7,335 for 6 m
pipes and back-fill
Excavating trenches, From 813 to From 132 to From 945 to
laying 6 m of GI pipes 12,718 for 6 m 204 for 6 m 12,922 for 6 m
and back-fill
65 KVA Atlas Copco 1,198,220 2,170,000
generator
Submersible Grundfoss 1,009,760 550,000
pump, 260 m
100 m borehole with 678,100 1,753,150
casing & gantry
6
14. 1.7 Surveyor’s information to communities
The first activity of a surveyor when he arrives in a proposed project area, is to have a
meeting with the elders of the proposed project, who shall show him where they propose
to have the extraction point of water, lines of water pipes and the required water kiosks
and tapping points.
On the basis of the first field visit, the surveyor will draft a sketch showing his/her
proposed plan for carrying out a detailed survey. The surveyor shall also present a
quotation for his/her work on carrying out the survey and produce a Survey Report.
Public use of private land
Another advantage of carrying out surveys is that the surveyor will explain to the
landowners that all those parts of their land which will be used for the pipelines, tanks
and kiosks must be declared public land, so that it can be used legally by their neighbours
during the construction work and, later, for drawing water.
This is a very sensitive issue for the landowners who may not be paid compensation by
the community. However, the land issues must be solved, agreed upon and verified in
writing by the legal authorities, before any detailed survey and construction work can be
initiated.
Cost-sharing
The surveyor will also explain to the community that according to the donor or the Water
Service Board, they must produce a certain percentage, usually around 15%, of the cost
for survey, design and construction works as part of their cost-sharing. This contribution
may be in the form of locally available skills, labour and materials. As explained in
Water for Rural Communities, the main contractor bought skilled and unskilled labour,
sand, crushed stones, hardcore and water from the community for 50% of the normal
cost. The other 50% was recorded, but not paid, as their contribution to cost-sharing.
Simplified and cost-efficient designs
When a surveyor has produced his/her report on a completed survey, it must be presented
and discussed during several meetings with the community that will draw water from the
project. During such discussions, the community may present some good ideas on how to
simplify the design, thereby reducing costs, or finance their proposals for extra extensions
from the main pipeline.
1.8 Categories of surveyors
There are several categories of surveyors. The ones recommended in this handbook are
experienced surveyors who are registered with the Institute of Surveyors and licensed by
the Ministry of Water.
7
15. Other surveyors, who survey roads, land and plots may not be experienced in surveying
water projects. Quantity Surveyors calculate Bills of Quantities (BQs), which are lists of
the required man power and materials required for construction works.
Hydrogeologists and drilling firms often advertise that the drilling of a borehole will
solve all water problems. The fact is that nearly all deep boreholes, except shallow ones
near riverbeds, in arid and semi-arid lands (ASALs) are either dry or contain saline water
unusable for domestic use and irrigation.
1.9 Satellite surveys (øget fra font 12 til font 14, som de andre)
A modern type of survey technique is being implemented by the Danish Refugee Council
in Somaliland. Instead of the cumbersome fieldwork of clearing many kilometres of
sighting lines through the bush and farmers' fields, they carry out surveys comfortably
from their offices.
Satellite surveys are implemented by using a NASA-developed computer programme that
utilises locations obtained from the Global Position System (GPS). The surveyor enters
the exact GPS position of the extraction point of the proposed water project and the
various points along the proposed pipeline in the computer programme (see figure
below).
GPS map and data of water project in Hargeysa, Somaliland
8
16. A few minutes later, the profile of the ground level and its linear line of the proposed
pipeline can be printed out as shown below.
In the above example, the linear was found to have the norm of residuals = 39.4199.
The negative residuals head indicates that there is not enough gravitational energy to
move the desired quantity of water. Hence the quantity of water will not flow.
The positive residuals head indicates that there is an excess of gravitational energy that is
enough to move an even greater flow of water through the stream. If allowed to discharge
freely, a positive residual head means that the gravity will try to increase the flow through
the stream. As flow increases, the friction head-losses will decrease the residual head.
The flow will increase until the residual head is reduced to zero.
Source: Chief Engineer - Rashed I. Guleed, Danish Refugee Council, Somaliland.
9
17. Chapter 2. Survey and design of a rising main pipeline
2.1 The project area to be surveyed
The data presented in the following chapters originates from the actual survey and
implementation of the Mbitini Water Project in Kitui that was implemented by ASAL
Consultants Ltd. for the Royal Danish Embassy and the Kenya Water and Sanitation
Programme (KWSP) from 2004 to 2005.
First the rising main was surveyed from its starting point at Mwiwe riverbed (shown
in the upper left side of the map). A100 m3 water tank is situated at Katwala from
where water is gravity-fed by a main distribution pipe to two other water tanks and 11
water kiosks.
The procedure for surveying the rising main and the calculations for determining the
sizes of pipes is explained on the following pages in this chapter. Included also in this
chapter is how the capacity of the pump and its power requirement was calculated.
The procedures for surveying the main gravity distribution line from the Katwala tank
to the farthest water kiosk at Kivunee (shown on the lower right corner of the map) is
explained in Chapter 3.
Survey and calculations for the four branches of distribution pipelines to Maangani,
Kisevi, Kimuuni and Ikota Mwetha, is explained in Chapter 4.
Mwiwe riverbed,
Extraction point
Map showing Katwala Mbitini Water Project
10
18. 2.2 A Surveyor’s equipment
1) A tripod onto which a levelling
instrument with telescope and a theodolite
can be mounted.
2) Ranging rods for setting out lines.
3) A Surveyor’s chain or a long tape measure
for measuring distances.
4) Chain arrows for marking distances.
5) Short iron rods for benchmarks.
6) A dumpy level with various levels and
telescope (cost Ksh 61,500 including
tripod).
7) Theodolite for measuring angles (cost
Ksh 388,500 including tripod).
8) Alternatively, a “TM1A one second
reading optical theodolite” can be used
instead of the two instruments described
above. This instrument costs Ksh 767,500
inclusive of a tripod.
11
19. 9) An altimeter for measuring altitudes
above sea level.
10) A compass for indicating the direction to
North, South, East and West.
11) A collapsible levelling staff being 4
metres long for vertical measurements.
12) A notebook, called a level book.
12
20. 2.3 Description of survey procedures for rising mains
In this example, a short iron rod was hammered into
the ground, as the bench mark, at the exact extraction
point at Mwiwe riverbed, which had proved to have a
sufficient supply of water to meet the water demand
of 15,000 people.
The latitude (distance from equator measured in
degrees) and longitude (distance east of the prime
meridian measured in degrees or time) was found for
the benchmark using a contour map 1:50,000. A
Global Position System (GPS) instrument could also
have been used to find the latitude and the longitude.
The altitude (height over the sea level measured in
metres or feet) was found using the contour map. A
GPS could also have been used, although they are not
precise in measuring altitudes.
The exact position of the rising main pipeline,
through which water would be pumped from the
extraction point to the main storage tank at Katwala
Village, was marked by setting out white and red
coloured ranging rods according to the work plan for
Mbitini Water Project. This is to define a straight line
with minimal errors. A straight line is necessary to
minimize friction losses that occur when water
negotiates bends in a pipeline.
The community’s approval of the position of the
rising main pipeline was obtained once more to avoid
any land disputes at a later stage.
The length and the gradient of the rising main was
thereafter measured, so that the delivery head
(difference in height measured in metres between the
extraction point and top of the main tank) could be
calculated.
The delivery head was found using a levelling
instrument mounted horizontally on a tripod stand, a
30 metre long tape measure and a collapsible
levelling staff well calibrated on its entire 4 metres
height. Alternating red and white colours for every
10 centimetres make the figures on the levelling staff
clearly visible when sighting through the instrument.
This makes the figures read to have three decimals
for precision.
13
21. Vertical and horizontal measurements were then taken all the way from the extraction
point to the top of the proposed tank to be constructed at Katwala Village.
The usual technique for surveys is as follows:
⇒ The surveyor sets up the levelling instrument on
a tripod on the line marked for the rising main
at a distance of 60 metres from the bench mark.
Thereafter the staff-man holds his staff
vertically at the benchmark.
⇒ The surveyor turns his instrument to face the
staff-man, sights through the eye piece and
reads the figures on the levelling staff and notes
the relevant figures in his level book. This is
called a back-sight reading.
⇒ Thereafter, the staff-man moves 60 metres
uphill from the surveyor on the line marked
for the rising main. There he holds the staff
vertically and facing the surveyor.
⇒ The surveyor turns his instrument towards the
levelling staff and reads the relevant figures on
the staff, which he notes down. This is called a
fore- sight reading.
⇒ Readings of the difference in heights between
a back-sight and a fore-sight reading is called
an intermediate sight reading.
⇒ This procedure is repeated at some more
points with intervals of 60 metres. When the
staff is too far for clear reading, the surveyor
decides to shift to another point along the
marked line. The last reading before shifting
is a fore-sight.
The surveyor sets up his instrument 60 metres from
the last fore-sight, where the staff-man holds the staff
vertically. The surveyor then takes a back-sight
reading down the staff. Thereafter the staff-man
moves 60 metres uphill from the surveyor on the
marked line so that a fore-sight reading can be taken.
This procedure is repeated until the whole marked
line is surveyed and recorded.
14
22. This procedure is shown graphically below.
3.890 3.490 0.350
331.710 H
(Height of 4.070 0.740
collimation) G
3RD INSTRUMENT SET-UP
4.780 4.800 4.670 2.000 0.405 F (CHANGE POINT)
H.D
326.930
E 2ND INSTRUMENT SET-UP
(BM) D
C (CHANGE POINT)
B
A 1ST INSTRUMENT SET-UP
A graphical illustration of surveying with levelling instrument
From the above diagram, once a machine is set for the first reading, it is called a back
-sight A.E.F. The subsequent readings until the surveyor decides to change station are
called intermediates B.C.D.G. The levels are then reduced using the method described
in the two booking tables shown below.
Heights of Collimation Method (Reducing levels)
B.S I.S F.S H.C R.L REMARKS
4.780 331.710 326.930 BM (A)
4.800 326.910 B
4.670 327.040 C
2.000 329.710 D
4.070 0.405 335.375 331.305 E (C.P)
3.890 0.740 338.525 334.635 F (C.P)
3.490 335.035 G
0.350 338.175 H
The above procedure is called the reducing method, because of the continuous
subtracting of the intermediate staff readings from the height of collimation.
The height of collimation is the horizontal view/line through the machine’s eyepiece.
All the levels on the ground before change of the machine station are related to the
collimation to get the ground level at any given point.
i) Height of collimation = Staff reading + level of point of reference.
ii) Reduced level = Collimation – Staff reading.
iii) Reduced level at change point = Reduced level of the last instrument set
up plus back-sight of the new instrument set up.
Another method, called Rise and Fall Method, shown below can also be used.
The Rise and Fall Method
B.S I.S F.S RISE FALL R.L REMARKS
4.780 326.930 BM (A)
4.800 0.020 326.910 B
4.670 0.130 327.040 C
2.000 2.670 329.710 D
4.070 0.405 1.595 331.305 E (C.P)
3.890 0.740 3.330 334.635 F (C.P)
3.490 0.400 335.035 G
0.350 3.140 338.175 H
Reduced level = Reduced level at any particular point minus Fall or plus Rise
Rise or fall = Previous staff reading minus the next staff reading.
15
23. 2.4 Technical description of surveying rising mains
Surveys described in this chapter are engineering surveys for construction of
pipelines. The measurements taken are drawn to suitable scales of maps and plans that
are compiled in a Survey Report that will form the basis for producing designs, bills
of quantities and costs for constructing the surveyed water project.
The first inspection of the area, called a reconnaissance, is carried out some time
before the actual survey to be implemented. The purposes of the reconnaissance are
to:
1. Draw a sketch of the project area showing the extraction point, buildings,
hedges, roads, etc.
2. Ensure that the project committee and the community have agreed and solved
all land disputes on the location of the extraction point and proposed pipelines,
water tanks and water kiosk sites.
3. Ensure that the committee is willing to clear paths and fields free of charge,
where the surveyor and his/her chain-man will work.
4. Estimate the scope of work and type of equipment required for carrying out
the survey.
After the reconnaissance has been completed, the preliminary work can be carried
out. It consists of:
5. Selection of the main line, which is the base line running across the area to be
surveyed.
6. Running the survey lines, which involve measuring the lengths of all survey
lines. This is established by making straight lines between the survey stations,
whereby intermediate ranging rods are placed in line with terminal points.
This process will ensure that the chain lines are measured along definite paths
by which unnecessary lengths and costs of water pipes will be avoided. The
procedure is as follows:
a. Place vertically, a line of ranging rods from the beginning to the end
of a survey line.
b. A ranging rod is placed between each chain length, or length of
measuring tape, by sighting between the first and last ranging rods.
7. Chaining is the term for measuring lengths using either a surveyor’s chain or
a long tape measure. Chain arrows are short lengths of iron rods with handles
that are pressed into the ground at each full length of surveyor’s chain, or tape
measurements.
8. Booking a chain survey is the term for recording chain surveys in field books.
Surveys are recorded as follows:
16
24. a) Chain lines are drawn as two parallel lines in the middle of a page.
b) The start of a chain line is drawn as starting from the bottom of the
page.
c) The distances between the chain lengths are marked with the distances
in metres between the two parallel lines. Symbols are placed outside
the parallel lines with the distance marked in metres.
An example of booking a chain survey is as follows:
80 30
20 60
40 15
6 20
0 25
The symbols above stand for the following:
Riverbed
House
School
Road
Tree
Levelling is a process whereby the difference in height between two or more points
can be determined. The purposes of levelling a project area are:
a) Assess the nature and topography of the landscape.
b) Determine the elevations of points along desired lines.
c) Determine the actual distances between points.
The equipment for levelling is:
a) Levelling instrument with telescope and dumpy, tilting and automatic
levels
b) Digital or optical theodolites
c) Tripod for mounting levelling instrument and theodolite
d) Levelling staff 4 metres high
e) Level book for recording readings and calculations
17
25. Levelling procedure start with setting and temporary adjustment at an arbitrary point
near the benchmark with a known height.
A back-sight reading is taken from the levelling staff, which is placed vertically on
the benchmark. Thereafter the levelling staff is moved up along the line and an
intermediate and fore-sight reading is taken from it with the levelling instrument. The
measurements taken consist of distance and elevation between the readings as shown
in the sketch below.
Level staff
B.S I.S F.S GL
Horizontal line
H
of sight B.S F.S
G
CHANGE POINT (CP)
B.S I.S I.S I.S F.S F
3RD INSTRUMENT SET-UP H.D
KNOWN CHANGE POINT (CP)
E
HEIGHT D 2ND INSTRUMENT SET-UP
C
(BM) B
A 1ST INSTRUMENT SET-UP
Key words:
Bench Mark (BM) is the enduring point for starting surveys. Surveying authorities
protect benchmarks.
Temporary Bench Mark (TBM) is a temporary benchmark established to avoid
continuous reference to the BM.
Reduced Level (RL) is the height of a point above or depth below a BM or a TBM
that is adopted as BM.
Back-sight (BS) is the first reading made to the staff at every instrument set-up.
Fore-sight (FS) is the last reading made to the staff at every instrument set-up.
Intermediate Sights (ISs) are all other staff readings from an instrument set-up that
are neither back-sight nor fore-sight.
Change Point (CP) is shifting the levelling instrument to a new station. The first
reading from the new station is a fore-sight of the previous instrument station. Two
readings are therefore recorded for the same staff station i.e. back-sight and fore-sight.
Height Difference (H.D) is difference in height.
Datum surface is the horizontal surface from which heights are referred.
Horizontal and level lines are at right angles with the pull of gravity. The difference
between the two types of lines is that horizontal lines are at right angles with the pull
of gravity at one point.
18
26. Reading, recording and reducing the levels
The surveyor reads the relevant figures on the staff through the cross hairs of the eye
piece of the levelling instrument. The readings are recorded in the level book. The
staff readings are later reduced using the Height of collimation method that consists
of:
a) Height of collimation is determined by adding the reduced level on the bench
mark to the staff reading on the bench mark.
b) Height of collimation remains constant for an instrument station but changes
when the instrument is moved to another station.
c) Reduced levels are obtained by height of collimation (subtract) staff readings
at that instrument station. An example is shown below.
331.710
(Height of
collimation)
4.780 4.800 4.670 2.000 0.405
E
326.930
D
(BENCH MARK) C H.D
B
A
Instrument set-up
There are two methods of recording and reducing the levels, namely:
a) Height of Collimation Method
B.S I.S F.S H.C R.L Remarks
4.780 331.710
326.930 BM (A)
4.800 326.910 B
4.670 327.040 C
2.000 329.710 D
0.405 331.305 E
Height of collimation = the reduced level at the Bench Mark plus staff reading at the
Bench Mark.
Reduced level = Height of collimation minus intermediate or back-sight or fore-sight
b) Rise and fall method
B.S I.S F.S Rise Fall R.L Remark
4.780 326.930 BM (A)
4.800 0.020 326.910 B
4.670 0.130 327.040 C
2.000 2.670 329.710 D
0.405 1.595 331.305 E
Reduced level = Reduced level at benchmark minus fall or plus rise
Rise or fall = Previous staff reading minus the next staff reading.
19
27. The actual readings taken from the extraction point at Mwiwe riverbed to the main
storage tank at Katwala Village are listed below.
Date: 16th Sept. 2004 Levels for Mbitini Water Project
From extraction point at Mwiwe river to tank at Katwala
B.S I.S F.S H.C R.L Distance Remarks
4.780 331.71 326.301 0 Peg in concrete
4.800 326.910 0 Peg in concrete
4.670 327.040 57
2.000 329.710 117
4.070 0.405 335.375 331.305 CP
3.890 0.740 338.525 334.635 CP
3.490 335.035 237
4.580 0.350 342.755 338.175 CP
3.325 339.430 297
4.420 0.240 346.935 342.515 CP
2.68 344.255 357
4.650 0.160 351.405 346.755 CP
2.310 349.095 417
4.805 0.410 355.8 350.995 CP
1.760 354.040 477
4.080 0.365 359.515 355.435 CP
1.765 357.750 537
1.110 358.405 597
2.450 1.160 360.805 358.355 CP Sandy
2.315 358.490 657 soil
3.400 0.720 363.485 360.085 CP
3.260 360.225 717
1.655 361.830 777
1.560 361.925 837
1.595 361.890 897
1.660 1.530 363.615 361.955 CP
1.555 362.060 957
1.600 362.015 916 Tank at Katwala
1.710 361.905 1008
20
28. 2.5 Rising main
Tank
40m height 3 m
35m
30m
25m
20m Delivery
head
15m 35.7 m
10m
5m
0m 125m 250m 375m 500m 625m 750m 875m 1,000m
0m
Distance (m)
at Mwiwe riverbed
A graph of the rising main
The result of the survey is drawn in this graph that shows the ground profile of the
rising main, that starts from the extraction point at Mwiwe riverbed (lower left corner
of the graph) and rises to the proposed tank (upper right corner).
The vertical distance, called delivery head, is 35.7 metres above the extraction point.
The horizontal distance, called length is 916 metres.
Based on the survey data, the following can now be estimated:
2.6 Required size and type of pipe for the rising main.
The frictional losses in straight water pipes can be read from Cole Broke’s White
Charts that are contained in the Ministry of Water and Irrigation Manual – 1986
edition.
It can also be calculated using the following formula:
22 xD 2V
(i) Q = : Where V = Velocity in m/s. This is usually assumed to be 0.8 m/s
7X 4
D = Pipe size in m.
Q = Flow in m3/s.
While V is assumed and Q is known (i.e. derived from daily water demand) then it is
easy to calculate the diameter/size of the required pipe, as shown below.
After getting the pipe size, it is necessary to apply the same formula (i) above again,
to confirm/get the actual velocity for the size of pipe selected.
21
29. Determination of pipe size
Q = 44.3775m 3 / day = Daily water demand for the Mbitini Water Project.
Assume 16 hours of pumping in the ultimate (extreme) year.
443.775
q= = 7.704 x10m 3 / s
16 x3600
7.704 x10 −3 x 4
D= = 0.110m
3.14 x0.8
Actual velocity of flow in m/s
QX 7 X 4
Vactual = Q = 7.704 x10 −3 m 3 / s
22 XD 2
D = 0.1m (100mm dia. GS pipe medium grade for the
pumped rising main)
−3 3
7.704 x10 m / sx7 x 4
=
22 x0.12
Vactual = 1m/s
Frictional losses for pumping line
The following formula (ii) is applied with reference to Cole Broke’s White Charts
which give the frictional loss for any particular length of pipe.
4 xfxLxv 2
(ii) Hfs =
2 xDx9.81
Where: L- Length in m
V- Velocity of flow in m/s
D- Internal pipe diameter in m
L- Distance from extraction point to
the main tank 916m
f - Frictional Coefficient
fGI - 0.011 (1 + 25/D) D = internal
diameter in mm
0.011 (1 + 25/100) = 0.01375
4 x0.01375 x916 x12
= = 25.7m
2 x0.1x9.81
2.7 Required capacity of pump and generator (Genset)
Available data from the survey:
Ground level at Katwala Market 362.0 m
Ground level at intake 326.3 m
Delivery head 35.7 m, which is the difference in height
Residual head 35.7+25.7+3 = 64.4 m
Frictional losses can be found in Cole Broke’s White Charts or as explained above
under Section 2.6.
Delivery head 35.7 m
Frictional losses 25.7 m
Height of water tank 3.0 m
10% residual head 6.4 m, which means extra height
Pumping head 70.8 m, the required capacity of the pump
Total pumping head, say 71.0 m, which gives a surplus capacity of 0.2 m.
22
30. For the case of Mbitini Water Project, the amount of water to be pumped was 28
m3/hr and the total pumping head is 71 m. The pump must therefore be capable of
delivering 28 m3/hr at a total head of 71m.
P = q x Q x H x 2.72 x 10⁻³. Where ,
ηp x ηm P = Pump power in kW
q = Density of water (Unity)
Q = Discharge /Flow rate in m3/s
H = Total system head in m
2.7 x10 −3 = Conversion factor
ηp = Pump efficiency
ηm = Motor efficiency
Pump power requirement
ηp = Pump efficiency and ηm = Motor efficiency is usually assumed as 30% for
small pumps and 60% for big pumps. For this case we take 0.6 because it’s a big
pump.
In this case the calculation is:
1x 28 x71x 2.72 x10 −3
P= = 15.05 kW (18.8 KVA)
0.6 x0.6
Genset should supply 30% more power to cater for losses and also avoid overloading
it (i.e. 130%)
Therefore, the required power is: 18.8 x 130% = 24.4 KVA, (≈ 25 KVA)
The pump seen in the photo is a
Grundfoss CR32-6, 11.0 kW, 3 Phase
electric booster pump with a capacity
of 32m3/hr at 71 m head that was
installed at the extraction point.
Together with accessories and
installation, the cost was Ksh 558,200
in December, 2004.
The diesel generator set that powers
the Grundfoss pump is an Atlas Copco
41, KVA, QUB41. Its cost was
Ksh 876,550 in December, 2004.
23
31. Chapter 3. Design, bill of quantities and cost of the rising
main for Mbitini Water Project
According to the evaluation report, the extraction point in Mwiwe riverbed is required to
supply 309,460 litres (309.5 m3) of water daily at present. It is estimated that in 20 years,
the demand will be 443,775 litres (443.8 m3). The extraction point consists of three
components (structures), namely a hand-dug well in the riverbank, infiltration pipes
(gallery) to drain water from the riverbed into the hand-dug well, and a sand dam that will
raise the level of sand and water in the riverbed.
3.1 A hand-dug well
This is made of curved concrete blocks on a foundation ring with an internal diameter of
300 cm. Short lengths of insulated electric wires were bent into a “U” shape and inserted
in each course of the concrete blocks for every 30 cm with the U facing inwards.
The well shaft was sunk as deep as a petrol-powered suction pump could remove the
inflowing water. When the capacity of the pump was reached at about 4 metres depth, the
internal diameter of the shaft was reduced to 110 cm. The well-diggers then sunk the well
shaft to an additional 3 metres before the inflow of water became too much for the
diggers and the pump. When the shaft had reached its final depth, the insulated bent wires
were pulled out of the shaft, each wire leaving two small infiltration holes in the shafts
for replenishing of the well.
The small well shaft being sunk inside the The completed well head with the pipe
wide diameter well shaft in the riverbank from the well to the pump.
Pla
n
and
sec
tio
n
of
ext
ract
ion point in the riverbank of Mwiwe riverbed (mm)
Bill of quantities and cost of the hand-dug well at Mwiwe extraction point
24
32. Description Unit Quantity / Unit cost Total cost Community
8 m deep intake well Days Ksh Ksh Contribution
(Ksh)
Labour cost
1 Surveyor Surveyor 2 days 1,200/day 2,400
1 Supervisor Supervisor 10 days 1,200/day 12,000
1 Contractor Contractor 1 x 20 days 800/day 16,000
2 Artisans Artisans 2 x 20 days 200/day 8,000 8,000
2 Trainees Trainees 2 x 20 days 100/day 4,000 4,000
10 Community labourers Labourers 10 x 20 days 100/day Free 20,000
Cost of labour 42,400 32,000
Materials
Cement 50 kg bags 10 600 6,000
River sand Tonnes 3 200 Free 600
Crushed stones Tonnes 3 600 1,800 1,800
Curved well blocks Blocks 700 50 35,000 14,000
Galvanised wire, 4mm Kg 50 150 7,500
Iron bar, Y8 40 m length 10 500 5,000
Dewatering pump Days 10 800 8,000
Cost of materials 63,300 16,400
Transport of materials
Tractor trailer loads 3 tonnes 1 load 900 900 900
Cost of transport 900 900
Cost and value 106,600 49,300
Total cost 155,900
3.1 Infiltration pipes
This is to increase the recharge even further by laying 72 metres of perforated 160 mm
uPVC pipes. The infiltration pipes were laid in crushed stones as deep as possible in the
sand of the riverbed and with a gradient towards the intake well to enable the water to
drain from the sand into the intake.
Infiltration pipe connecting to the intake. A flooded trench for infiltration pipes.
25
33. F lo o d
u P V C in f ilt r a t io n p ip e s
I n t a k e w e ll
P la n o f in f ilt r a t io n p ip e s a n d t h e e x t r a c t io n p o in t
Bill of quantities and cost of 72 metres of infiltration pipe
Description Unit Quantity / Unit cost Total Community
Perforating and laying 72 Days (Ksh) cost contribution
meters of 160 mm uPVC pipe (Ksh) (Ksh)
deep in a riverbed and sloping
towards a well in the riverbank
Labour
1 Surveyor Surveyor 4 days 1,200/day 4,800
1 Supervisor Supervisor 6 days 1,200/day 7,200
1 Contractor Contractor 1 x 15 days 800/day 12,000
2 Artisans Artisans 2 x 15 days 200/day 6,000 6,000
4 Trainees Trainees 4 x 15 days 100/day 6,000 6,000
10 Community labourers Labourers 10 x 15 days 100/day Free 15,000
Total cost of labour 36,000 27,000
Materials
Dewatering suction pump 8 days 800 6,400
Perforated PVC pipes,160 mm 6 m length 14 pipes 3,048 42,672
Cost of materials 49,072
Transport of materials
Tractor trailer loads 3 tonnes 1 load 900 900 450
Cost of transport 900 450
Cost and value 85,972 27,450
Total cost and value 113,422
3.3 Sand dam
A sand dam built across the riverbed on an underground dyke situated 80 metres
downstream of the extraction point (details are explained in Water from Dry Riverbeds).
The sand dam was estimated to increase the extractable volume of water from 139 m3 to
2,997 m3.
26
34. Mwiwe sand dam with its spillway built to the second stage, 60 cm above the riverbed.
450 Upstream
12000 280
Upstream hx 0.2 hx 0.125
250
Final sand level
A
250
1500
250
Fourth sand level
Third sand level
Sand reseroir Wing wall
Wing wall Second sand level
200
B B
Sand level
1690 1240
First sand level
450
Ap r on
ro
n Ap
200
Apron
hx0.55
hx0.75 hx 0.75
1690 560
A 1130
Plan
1000 Section A - A
5500 7000 1500 9500
New FL
Spillway Old FL New WL
Fourth stage
814
Third stage
Second stage
First stage
Old WL
Section B-B 1000
Plan and profiles of Mwiwe sand dam (mm)
Bill of quantities and cost of Mwiwe Sand Dam
Description Unit Quantity/ Unit cost Total cost Value of
A sand dam being 2 m high Days Ksh Ksh community
and 12 m long contribution
Kshs
Labour
A surveyor/designer Surveyor 10 days 1,200/day 12,000
A supervisor Supervisor 18 days 1,200/day 21,600
A contractor Contractor 1 x 42 days 800/day 33,600
3 Artisan Artisans 3 x 40 days 200/day 24,000 24,000
4 Trainees Trainees 4 x 40 days 100/day 16,000 16,000
10 Community labourers Labourers 10 x 40 100/day Free 40,000
Cost of labour days 107,200 80,000
Materials
Bags of cement 50 kg bags 245 600 147,000
River sand Tonnes 150 200 Free 30,000
Hardcore 2" to 6" Tonnes 120 200 24,000 24,000
Water Oil-drum 30 100 Free 3,000
Barbed wire, 12.5g 25 kg rolls 4 3,000 12,000
Y 8 twisted iron bars Length (m) 30 350 10,500
Cost of materials 193,500 57,000
Transport of materials
Hardware lorries 7 tonne 2 loads 5,000 10,000
Tractor trailer loads 3 tonnes 44 loads 900 39,600 19,800
Cost of transport 49,600 19,800
Cost and value 350,300 156,800
Total cost of Sand Dam 507,100
27
35. Bill of quantities and cost of closing spillway
Description Unit Quantity / Unit cost Total cost Community
Closing last 3 stages of 30 Days (Ksh) (Ksh) contribution
cm height of spillway (Ksh)
Labour
A supervisor 1 Supervisor 2 days 1,200/day 2,400
A contractor 1 Contractor 1 x 3 days 800/day 2,400
An artisan 1 Artisan 1 x 6 days 200/day 1,200 1,200
2 Trainees 2 Trainees 2 x 6 days 100/day 1,200 1,200
10 Community labourers 10 Labourers 10 x 6 days 100/day Free 6,000
Cost of labour 7,200 8,400
Materials
Bags of cement 50 kg bags 20 600 12,000
River sand Tonnes 4 200 Free 800
Hardcore 4" to 8" Tonnes 10 200 2,000 2,000
Water Oil-drum 15 100 Free 1,500
Cost of materials 14,000 4,300
Transport of materials
Hardware lorries 3 tonnes 1 load 3,000 3,000
Tractor trailer loads 3 tonnes 3 loads 900 2,700 1,350
Cost of transport 5,700 1,350
Cost and value 26,900 14,050
Total cost of spillway 40,950
Total cost of Mwiwe Sand Dam
Sand dam with open spillway 350,300 156,800
Completing spillway in 3 stages 26,900 14,050
Cost and value of sand dam with spillway 377,200 170,850
Grand total of sand dam with completed spillway 548,050
3.2 An elevated Pump House at Mbitini
This was built a few metres from the hand-dug
well at Mwiwe riverbed. The pump house
was elevated to avoid flooding. The house was
fenced by a 1.5 metre high chain link attached
to reinforced concrete posts made on site.
Access is through a lockable steel gate.
1750
F r o n t e le v a tio n ( m m ) E a s te r n e n d e le v a tio n ( m m )
1200
1750
R e a r e le v a tio n ( m m ) W e s t e r n e n d e le v a tio n ( m m )
28
36. 200 4 ,6 0 0 200 2 ,8 0 0 200
A
200
200 1,950 200 1,950 200
2,150
3,200
3,200
2,150
1,100
B
900
1,950
1,950 B
1 ,1 0 0 1 ,7 0 0 1 ,0 0 0 700 1 ,6 0 0
7 ,8 0 0 A
P la n o f fo u n d a t io n la y o u t ( m m )
8000
200 4600 200 2800 200
E
200
200
800 900 700 900 800
A tte n d a n t
3000
G e n e ra to r
Room
&Pum p Room
6250
200
V e ra n d a h 900
200
200
E
S t a ir s S t a ir s
1750
1750
200 200 200 200 200 200
900 1500 1800 1200 1400
P la n o f g r o u n d flo o r ( m m )
150 R Top slab
.c
3Y8 06 21Y10-03 8Y8-06
200 x 450 r.c Beams
3,000
15Y10 02
2,850
20 Plaster
2,850
8R isers at 150 =1200
50 Floor screed 7 Treads at 250 =1750
1,750 See R Slab
oof
R D
.c etails 6Y10 02-150
1,200
200 Floor Slab Concrete
B.R ref A
.C 142 Top&Btm 1,200 3,200 1,100 150
6Y8 04- 250
G .L G.L 6Y10 01-150
Waist
GL GL
6Y10 03-150
600x200 r.c 10Y8 04-250
foundation concrete 3Y8 04
600 x 200 R.c
Foundation Concrete
Section E-E (m )
m Cross section of reinforcem (m )
ent m
29
37. Bill of quantities and cost of the Mbitini Elevated Pump House
Description Unit Quantity / Unit cost Total cost Community
Days (Ksh) (Ksh) contribution
(Ksh)
Labour
A supervisor Supervisor 1 x 14 days 1,200/day 16,800
A contractor Contractor 1 x 42 days 900/day 37,800
6 Artisans Artisans 6 x 40 days 200/day 48,000 48,000
10 Trainees Trainees 10 x 40 days 100/day 40,000 40,000
10 Community labourers Labourers 10 x 14 days 100/day Free 14,000
142,600 102,000
Cost of labour
Materials
Bags of cement 50 kg bags 160 600 96,000
River sand Tonnes 34 200 Free 3,400
Crushed stones, 1/2" to 1" Tonnes 27 600 16,200 16,200
Concrete blocks, 6"x 9"x18" Units 1,000 50 50,000 24,000
Water Oil-drums 150 100 Free 15,000
Y 8 twisted iron bars Lengths 44 350 15,400
Y 10 twisted iron bars Lengths 100 600 60,000
Y 12 twisted iron bars Lengths 38 700 26,600
Barbed wire 25kg 4 3,000 12,000
Binding wire, 1mm soft Kg 40 100 4,000
Water proof cement Kg 6 60 360
6" x 1" timber Metres 434 75 32,550
4" x 2" timber Metres 124 75 9,300
Poles, 2.5 meters long Kg 400 40 16,000
Nails, 4" Kg 15 80 1,200
Nails, 2 1/2" Kg 15 80 1,200
Nails, 3" Kg 20 80 1,600
Nails, 2" Kg 15 80 1,200
Lime 25 kg 4 400 1,600
Bitumen paint (Rc2) 5 litres 3 500 1,500
Turpentine 5 litres 1 200 200
Door 210cm x 150cm Units 1 22,000 22,000
Steel door 210cm x 90cm Units 1 8,000 8,000
Windows 150cm x 90cm Units 5 4,400 22,000
Windows 120cm x 90cm Units 3 3,200 9,600
Paint (Bermuda blue) Litres 1 1,400 1,400
Cost of materials 409,910 58,600
Transport of materials
Hardware lorries 7 tonnes 2 loads 5,000 10,000
Tractor loads 3 tonnes 37 loads 900 33,300
Cost of materials 43,300 16,650
Cost and value for 595,810 177,250
elevated pump house 773,060
30