SlideShare une entreprise Scribd logo
1  sur  45
Télécharger pour lire hors ligne
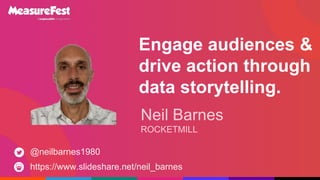
Engage audiences &
drive action through
data storytelling.
Neil Barnes
ROCKETMILL
https://www.slideshare.net/neil_barnes
@neilbarnes1980
Inspired
Confident
Interested
Bored
Confused
Unsure
Increased
cortical activity
via mirroring &
neural coupling.
Increased
hormone release
dopamine, cortisol
& oxytocin.
Data storytelling is the new
superpower for marketers of all
disciplines.
Data storytelling is the technique of
communicating a compelling story via
insights & visualisations derived from
data.
INSIGHT COMMUNICATION
VISUALISATION
Insights grab
attention, giving
your story action &
purpose.
INSIGHT
Observations & analysis are often
mistaken for insights.
Observations
are factual &
state what has
happened.
ANALYSIS
OBSERVATION
ANALYSIS
INSIGHT
We observe
revenue
increasing when
brand paid search
spend increases.
ANALYSIS
OBSERVATION
ANALYSIS
INSIGHT
Analysis
combines
multiple
observations to
provide context.
ANALYSIS
OBSERVATION
ANALYSIS
INSIGHT
High correlation
between brand
spend & revenue
when
considering total
search.
ANALYSIS
OBSERVATION
ANALYSIS
INSIGHT
Insight delivers
action based on
analysis &
observations.
ANALYSIS
OBSERVATION
ANALYSIS
INSIGHT
Incrementality
test proves
brand paid
search delivers
£10k incremental
revenue.
ANALYSIS
OBSERVATION
ANALYSIS
INSIGHT
Effective data
visualisation
reduces cognitive
load & increases
engagement.
INSIGHT
VISUALISATION
It takes high
cognitive load
to understand
this visual!
0
100
200
300
400
500
600
Jan Feb Mar Apr May Jun Jul Aug Sep Oct Nov Dec
Shark Attacks Hours of sunshine
Blending visual
background
eases cognitive
load.
0
100
200
300
400
500
600
Jan Feb Mar Apr May Jun Jul Aug Sep Oct Nov Dec
Shark Attacks Hours of sunshine
Remove
gridlines
they are a
distraction.
0
100
200
300
400
500
600
Jan Feb Mar Apr May Jun Jul Aug Sep Oct Nov Dec
Shark Attacks Hours of sunshine
Add a
secondary axis
where scaling is
vast. 0
5
10
15
20
25
30
0
100
200
300
400
500
600
Jan Feb Mar Apr May Jun Jul Aug Sep Oct Nov Dec
Hours of sunshine Shark Attacks
Vary
visualisation
types to aid
recall of data.
0
5
10
15
20
25
30
0
100
200
300
400
500
600
Jan Feb Mar Apr May Jun Jul Aug Sep Oct Nov Dec
Shark Attacks Hours of sunshine
Provide
distinction
through use of
colour.
0
5
10
15
20
25
30
0
100
200
300
400
500
600
Jan Feb Mar Apr May Jun Jul Aug Sep Oct Nov Dec
Shark Attacks Hours of sunshine
0
5
10
15
20
25
30
0
100
200
300
400
500
600
Jan Feb Mar Apr May Jun Jul Aug Sep Oct Nov Dec
Shark Attacks Hours of sunshine
Consider data
markers to aid
pattern and
trend recall.
Use of labels &
bolding to
remove
guesswork. 0
5
10
15
20
25
30
0
100
200
300
400
500
600
Jan Feb Mar Apr May Jun Jul Aug Sep Oct Nov Dec
Shark
Attacks
(No.
People)
Hours
of
sunshine
Month of Year
Shark Attacks Hours of sunshine
Land the insight
in the title to aid
interpretation of
your visual. 0
5
10
15
20
25
30
0
100
200
300
400
500
600
Jan Feb Mar Apr May Jun Jul Aug Sep Oct Nov Dec
Shark
Attacks
(No.
People)
Hours
of
sunshine
Month of Year
Rising sunshine hours coincides with increased
shark attacks!
Shark Attacks Hours of sunshine
From
this…
0
100
200
300
400
500
600
Jan Feb Mar Apr May Jun Jul Aug Sep Oct Nov Dec
Shark Attacks Hours of sunshine
To
this!
0
5
10
15
20
25
30
0
100
200
300
400
500
600
Jan Feb Mar Apr May Jun Jul Aug Sep Oct Nov Dec
Shark
Attacks
(No.
People)
Hours
of
sunshine
Month of Year
Rising sunshine hours coincides with increased
shark attacks!
Shark Attacks Hours of sunshine
INSIGHT COMMUNICATION
VISUALISATION
Use a story
mountain to
communicate your
data story.
Your data story
needs a build-
up, insight & a
resolution.
BEGINNING END
MIDDLE
Insight
Most stories
follow this
structure to
enable clarity.
BEGINNING END
MIDDLE
Insight
Build-up and
context is
critical in data
storytelling
END
MIDDLE
Insight
No insight leads
to your story
lacking action.
BEGINNING END
No ending can
create huge
frustration for
your audience!
MIDDLE
Insight
BEGINNING
Increased
cortical activity &
hormone release.
Data storytelling is the new
superpower for marketers of all
disciplines.
Data storytelling is the technique of
communicating a compelling story via
insights & visualisations derived from
data.
INSIGHT COMMUNICATION
VISUALISATION
OBSERVATION
ANALYSIS
INSIGHT
0
100
200
300
400
500
600
Jan Feb Mar Apr May Jun Jul Aug Sep Oct Nov Dec
Shark Attacks Hours of sunshine
0
5
10
15
20
25
30
0
100
200
300
400
500
600
Jan Feb Mar Apr May Jun Jul Aug Sep Oct Nov Dec
Shark
Attacks
(No.
People)
Hours
of
sunshine
Month of Year
Rising sunshine hours coincides with increased shark attacks!
Shark Attacks Hours of sunshine
BEGINNING END
MIDDLE
Insight
Bored
Confused
Unsure
Engage audiences and drive
action through data storytelling!
Thank you!
Neil Barnes
ROCKETMILL
https://www.slideshare.net/neil_barnes
@neilbarnes1980

Contenu connexe

Similaire à Brighton SEO | April 2024 | Data Storytelling

The Power of StoryTelling in Business and Social Media
The Power of StoryTelling in Business and Social MediaThe Power of StoryTelling in Business and Social Media
The Power of StoryTelling in Business and Social MediaGKIC London
 
Tell Your Library's Story with Infographics: Tips From an Accidental Graphic ...
Tell Your Library's Story with Infographics: Tips From an Accidental Graphic ...Tell Your Library's Story with Infographics: Tips From an Accidental Graphic ...
Tell Your Library's Story with Infographics: Tips From an Accidental Graphic ...library_research_service
 
Building Information Quality from the Inside Out
Building Information Quality from the Inside OutBuilding Information Quality from the Inside Out
Building Information Quality from the Inside OutCastlebridge Associates
 
What Is Good DataViz Design?
What Is Good DataViz Design?What Is Good DataViz Design?
What Is Good DataViz Design?Randy Krum
 
Top Lingerie Brands On Social Media Q4 2015
Top Lingerie Brands On Social Media Q4 2015Top Lingerie Brands On Social Media Q4 2015
Top Lingerie Brands On Social Media Q4 2015Unmetric
 
Pfizer Social Media Analysis Q4 2015
Pfizer Social Media Analysis Q4 2015Pfizer Social Media Analysis Q4 2015
Pfizer Social Media Analysis Q4 2015Unmetric
 
Novartis Social Media Analysis Q4 2015
Novartis Social Media Analysis Q4 2015Novartis Social Media Analysis Q4 2015
Novartis Social Media Analysis Q4 2015Unmetric
 
The value of storytelling through data
The value of storytelling through dataThe value of storytelling through data
The value of storytelling through dataGramener
 

Similaire à Brighton SEO | April 2024 | Data Storytelling (9)

The Power of StoryTelling in Business and Social Media
The Power of StoryTelling in Business and Social MediaThe Power of StoryTelling in Business and Social Media
The Power of StoryTelling in Business and Social Media
 
Tell Your Library's Story with Infographics: Tips From an Accidental Graphic ...
Tell Your Library's Story with Infographics: Tips From an Accidental Graphic ...Tell Your Library's Story with Infographics: Tips From an Accidental Graphic ...
Tell Your Library's Story with Infographics: Tips From an Accidental Graphic ...
 
Building Information Quality from the Inside Out
Building Information Quality from the Inside OutBuilding Information Quality from the Inside Out
Building Information Quality from the Inside Out
 
What Is Good DataViz Design?
What Is Good DataViz Design?What Is Good DataViz Design?
What Is Good DataViz Design?
 
Top Lingerie Brands On Social Media Q4 2015
Top Lingerie Brands On Social Media Q4 2015Top Lingerie Brands On Social Media Q4 2015
Top Lingerie Brands On Social Media Q4 2015
 
Pfizer Social Media Analysis Q4 2015
Pfizer Social Media Analysis Q4 2015Pfizer Social Media Analysis Q4 2015
Pfizer Social Media Analysis Q4 2015
 
Novartis Social Media Analysis Q4 2015
Novartis Social Media Analysis Q4 2015Novartis Social Media Analysis Q4 2015
Novartis Social Media Analysis Q4 2015
 
The value of storytelling through data
The value of storytelling through dataThe value of storytelling through data
The value of storytelling through data
 
Hockey Study
Hockey StudyHockey Study
Hockey Study
 

Dernier

AI Imagen for data-storytelling Infographics.pdf
AI Imagen for data-storytelling Infographics.pdfAI Imagen for data-storytelling Infographics.pdf
AI Imagen for data-storytelling Infographics.pdfMichaelSenkow
 
Webinar One View, Multiple Systems No-Code Integration of Salesforce and ERPs
Webinar One View, Multiple Systems No-Code Integration of Salesforce and ERPsWebinar One View, Multiple Systems No-Code Integration of Salesforce and ERPs
Webinar One View, Multiple Systems No-Code Integration of Salesforce and ERPsCEPTES Software Inc
 
Easy and simple project file on mp online
Easy and simple project file on mp onlineEasy and simple project file on mp online
Easy and simple project file on mp onlinebalibahu1313
 
Atlantic Grupa Case Study (Mintec Data AI)
Atlantic Grupa Case Study (Mintec Data AI)Atlantic Grupa Case Study (Mintec Data AI)
Atlantic Grupa Case Study (Mintec Data AI)Jon Hansen
 
Generative AI for Trailblazers_ Unlock the Future of AI.pdf
Generative AI for Trailblazers_ Unlock the Future of AI.pdfGenerative AI for Trailblazers_ Unlock the Future of AI.pdf
Generative AI for Trailblazers_ Unlock the Future of AI.pdfEmmanuel Dauda
 
2024 Q2 Orange County (CA) Tableau User Group Meeting
2024 Q2 Orange County (CA) Tableau User Group Meeting2024 Q2 Orange County (CA) Tableau User Group Meeting
2024 Q2 Orange County (CA) Tableau User Group MeetingAlison Pitt
 
一比一原版阿德莱德大学毕业证成绩单如何办理
一比一原版阿德莱德大学毕业证成绩单如何办理一比一原版阿德莱德大学毕业证成绩单如何办理
一比一原版阿德莱德大学毕业证成绩单如何办理pyhepag
 
Data Visualization Exploring and Explaining with Data 1st Edition by Camm sol...
Data Visualization Exploring and Explaining with Data 1st Edition by Camm sol...Data Visualization Exploring and Explaining with Data 1st Edition by Camm sol...
Data Visualization Exploring and Explaining with Data 1st Edition by Camm sol...ssuserf63bd7
 
社内勉強会資料  Mamba - A new era or ephemeral
社内勉強会資料   Mamba - A new era or ephemeral社内勉強会資料   Mamba - A new era or ephemeral
社内勉強会資料  Mamba - A new era or ephemeralNABLAS株式会社
 
一比一原版西悉尼大学毕业证成绩单如何办理
一比一原版西悉尼大学毕业证成绩单如何办理一比一原版西悉尼大学毕业证成绩单如何办理
一比一原版西悉尼大学毕业证成绩单如何办理pyhepag
 
Fuzzy Sets decision making under information of uncertainty
Fuzzy Sets decision making under information of uncertaintyFuzzy Sets decision making under information of uncertainty
Fuzzy Sets decision making under information of uncertaintyRafigAliyev2
 
2024 Q1 Tableau User Group Leader Quarterly Call
2024 Q1 Tableau User Group Leader Quarterly Call2024 Q1 Tableau User Group Leader Quarterly Call
2024 Q1 Tableau User Group Leader Quarterly Calllward7
 
一比一原版纽卡斯尔大学毕业证成绩单如何办理
一比一原版纽卡斯尔大学毕业证成绩单如何办理一比一原版纽卡斯尔大学毕业证成绩单如何办理
一比一原版纽卡斯尔大学毕业证成绩单如何办理cyebo
 
Exploratory Data Analysis - Dilip S.pptx
Exploratory Data Analysis - Dilip S.pptxExploratory Data Analysis - Dilip S.pptx
Exploratory Data Analysis - Dilip S.pptxDilipVasan
 
一比一原版麦考瑞大学毕业证成绩单如何办理
一比一原版麦考瑞大学毕业证成绩单如何办理一比一原版麦考瑞大学毕业证成绩单如何办理
一比一原版麦考瑞大学毕业证成绩单如何办理cyebo
 
Artificial_General_Intelligence__storm_gen_article.pdf
Artificial_General_Intelligence__storm_gen_article.pdfArtificial_General_Intelligence__storm_gen_article.pdf
Artificial_General_Intelligence__storm_gen_article.pdfscitechtalktv
 
一比一原版加利福尼亚大学尔湾分校毕业证成绩单如何办理
一比一原版加利福尼亚大学尔湾分校毕业证成绩单如何办理一比一原版加利福尼亚大学尔湾分校毕业证成绩单如何办理
一比一原版加利福尼亚大学尔湾分校毕业证成绩单如何办理pyhepag
 
Pre-ProductionImproveddsfjgndflghtgg.pptx
Pre-ProductionImproveddsfjgndflghtgg.pptxPre-ProductionImproveddsfjgndflghtgg.pptx
Pre-ProductionImproveddsfjgndflghtgg.pptxStephen266013
 

Dernier (20)

AI Imagen for data-storytelling Infographics.pdf
AI Imagen for data-storytelling Infographics.pdfAI Imagen for data-storytelling Infographics.pdf
AI Imagen for data-storytelling Infographics.pdf
 
Webinar One View, Multiple Systems No-Code Integration of Salesforce and ERPs
Webinar One View, Multiple Systems No-Code Integration of Salesforce and ERPsWebinar One View, Multiple Systems No-Code Integration of Salesforce and ERPs
Webinar One View, Multiple Systems No-Code Integration of Salesforce and ERPs
 
Easy and simple project file on mp online
Easy and simple project file on mp onlineEasy and simple project file on mp online
Easy and simple project file on mp online
 
Atlantic Grupa Case Study (Mintec Data AI)
Atlantic Grupa Case Study (Mintec Data AI)Atlantic Grupa Case Study (Mintec Data AI)
Atlantic Grupa Case Study (Mintec Data AI)
 
Machine Learning for Accident Severity Prediction
Machine Learning for Accident Severity PredictionMachine Learning for Accident Severity Prediction
Machine Learning for Accident Severity Prediction
 
Generative AI for Trailblazers_ Unlock the Future of AI.pdf
Generative AI for Trailblazers_ Unlock the Future of AI.pdfGenerative AI for Trailblazers_ Unlock the Future of AI.pdf
Generative AI for Trailblazers_ Unlock the Future of AI.pdf
 
2024 Q2 Orange County (CA) Tableau User Group Meeting
2024 Q2 Orange County (CA) Tableau User Group Meeting2024 Q2 Orange County (CA) Tableau User Group Meeting
2024 Q2 Orange County (CA) Tableau User Group Meeting
 
一比一原版阿德莱德大学毕业证成绩单如何办理
一比一原版阿德莱德大学毕业证成绩单如何办理一比一原版阿德莱德大学毕业证成绩单如何办理
一比一原版阿德莱德大学毕业证成绩单如何办理
 
Data Visualization Exploring and Explaining with Data 1st Edition by Camm sol...
Data Visualization Exploring and Explaining with Data 1st Edition by Camm sol...Data Visualization Exploring and Explaining with Data 1st Edition by Camm sol...
Data Visualization Exploring and Explaining with Data 1st Edition by Camm sol...
 
社内勉強会資料  Mamba - A new era or ephemeral
社内勉強会資料   Mamba - A new era or ephemeral社内勉強会資料   Mamba - A new era or ephemeral
社内勉強会資料  Mamba - A new era or ephemeral
 
一比一原版西悉尼大学毕业证成绩单如何办理
一比一原版西悉尼大学毕业证成绩单如何办理一比一原版西悉尼大学毕业证成绩单如何办理
一比一原版西悉尼大学毕业证成绩单如何办理
 
Fuzzy Sets decision making under information of uncertainty
Fuzzy Sets decision making under information of uncertaintyFuzzy Sets decision making under information of uncertainty
Fuzzy Sets decision making under information of uncertainty
 
Slip-and-fall Injuries: Top Workers' Comp Claims
Slip-and-fall Injuries: Top Workers' Comp ClaimsSlip-and-fall Injuries: Top Workers' Comp Claims
Slip-and-fall Injuries: Top Workers' Comp Claims
 
2024 Q1 Tableau User Group Leader Quarterly Call
2024 Q1 Tableau User Group Leader Quarterly Call2024 Q1 Tableau User Group Leader Quarterly Call
2024 Q1 Tableau User Group Leader Quarterly Call
 
一比一原版纽卡斯尔大学毕业证成绩单如何办理
一比一原版纽卡斯尔大学毕业证成绩单如何办理一比一原版纽卡斯尔大学毕业证成绩单如何办理
一比一原版纽卡斯尔大学毕业证成绩单如何办理
 
Exploratory Data Analysis - Dilip S.pptx
Exploratory Data Analysis - Dilip S.pptxExploratory Data Analysis - Dilip S.pptx
Exploratory Data Analysis - Dilip S.pptx
 
一比一原版麦考瑞大学毕业证成绩单如何办理
一比一原版麦考瑞大学毕业证成绩单如何办理一比一原版麦考瑞大学毕业证成绩单如何办理
一比一原版麦考瑞大学毕业证成绩单如何办理
 
Artificial_General_Intelligence__storm_gen_article.pdf
Artificial_General_Intelligence__storm_gen_article.pdfArtificial_General_Intelligence__storm_gen_article.pdf
Artificial_General_Intelligence__storm_gen_article.pdf
 
一比一原版加利福尼亚大学尔湾分校毕业证成绩单如何办理
一比一原版加利福尼亚大学尔湾分校毕业证成绩单如何办理一比一原版加利福尼亚大学尔湾分校毕业证成绩单如何办理
一比一原版加利福尼亚大学尔湾分校毕业证成绩单如何办理
 
Pre-ProductionImproveddsfjgndflghtgg.pptx
Pre-ProductionImproveddsfjgndflghtgg.pptxPre-ProductionImproveddsfjgndflghtgg.pptx
Pre-ProductionImproveddsfjgndflghtgg.pptx
 

Brighton SEO | April 2024 | Data Storytelling