PechaKucha Visualizing (web analytics) data (Creuna BrainCamp)
•
0 likes•1,281 views

PechaKucha presentation about visualising (web analytics) data held at Creuna's BrainCamp in Kragerø September 13 2014. The case-presentations have been removed in this version.

Recommended
Recommended
More Related Content
Featured
Featured (20)
PechaKucha Visualizing (web analytics) data (Creuna BrainCamp)
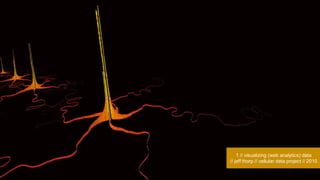
- 1. © Creuna 1 // visualizing (web analytics) data // jeff thorp // cellular data project // 2010
- 2. 2 // what is data vizualisation? // david mccandless // what makes good information design // 2009
- 3. 3 // infographics // cash // infographic of infographics // 2011
- 4. 4 // information design in a broad sense // variable // fibers for nike fuelband // 2014
- 5. 5 // static vs. dynamic & interactive // barcelona supercomputing center // a.track.tion // 2013
- 6. 6 // design vs. science // gaskin, dubberly & kessler // partitions of 3x4 grids // 2011
- 7. 7 // encoding/decoding // leong // pac-man character distribution // 2013
- 8. 8 // sense-making // wikipedia // gestalt principles // 2011
- 9. 9 // chunking and the magic number 7 // hudspith // chunking example // 2006
- 10. © Creuna 10 // visual encoding methods // ware // information visualization // 2004
- 11. © Creuna 11 // hierarchical structures // open signal // android device fragmentation // 2014
- 12. 12 // hierarchical structures // removed case example
- 13. 13 // networks // butler // visualizing friendships // 2010
- 14. 14 // networks // removed case example
- 15. 15 // timelines, flows // leong // the walking dead kill counter// 2014
- 16. 16 // timelines, flows // removed case example
- 17. 17 // maps // hint.fm // wind map // 2012
- 18. 18 // maps // removed case example
- 19. 19 // textual strucutures // stefaner // revisit // 2013
- 20. 20 // textual structures // removed case example