
Recommandé
Recommandé
Contenu connexe
Tendances
Tendances (20)
En vedette
Similaire à Shadac mnsure outreach
Similaire à Shadac mnsure outreach (20)
Plus de soder145
Plus de soder145 (20)
Dernier
Dernier (20)
Shadac mnsure outreach
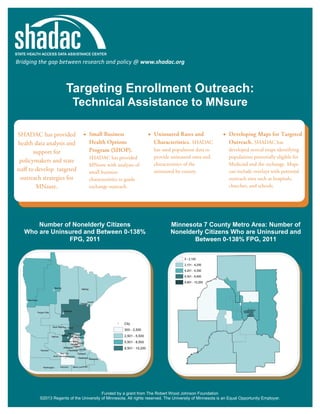
- 1. Bridging the gap between research and policy @ www.shadac.org Targeting Enrollment Outreach: Technical Assistance to MNsure Number of Nonelderly Citizens Who are Uninsured and Between 0-138% FPG, 2011 Minnesota 7 County Metro Area: Number of Nonelderly Citizens Who are Uninsured and Between 0-138% FPG, 2011 Funded by a grant from The Robert Wood Johnson Foundation ©2013 Regents of the University of Minnesota. All rights reserved. The University of Minnesota is an Equal Opportunity Employer.
- 2. Uninsurance Rates for Minnesota in 2011 and 2012 Subject Total civilian noninstitutionalized population United States Minnesota 2011 2012 Population % Uninsured Population % Uninsured 306,560,685 5,286,728 15.1 308,896,460 8.8 5,319,783 14.8* 8.0* 1,276,035 3,340,333 6.3 11.5 1,275,509 3,344,084 5.4* 10.6* (no data) 670,360 (no data) 0.3 490,345 700,190 Age Under 18 years 18 to 64 years 19 to 25 years 65 years and older 14.5 0.3 Race/Ethnicity White alone 4,531,711 7.5 4,552,775 Black or African American alone American Indian and Alaska Native alone 271,528 59,443 15.1 22.5 278,768 53,223 Asian alone Native Hawaiian and Other Pacific Islander alone 215,580 N 12.2 N 226,570 N 9.7* N Some other race alone Two or more races 74,189 133,514 40.6 13.6 71,750 134,473 33.7* 9.6* 4,378,122 253,235 6.8 29.7 4,382,481 260,511 6.2* 27.5 Native born Foreign born 4,900,965 385,763 7.7 23.8 4,933,547 386,236 6.9* 21.5* Naturalized Not a citizen 177,552 208,211 11.8 34.0 181,402 204,834 9.5* 32.0 19.7 White alone, not Hispanic or Latino Hispanic or Latino (of any race) 6.9* 14.0 21.2 Citizenship Status Education (25 years and older) Less than high school graduate 271,969 18.7 256,965 High school graduate, GED, or alternative Some college or associate's degree 937,326 1,153,086 10.9 9.4 931,093 1,168,914 10.2* 8.9 Bachelor's degree or higher 1,146,965 3.9 1,190,794 3.4* Work Experience (18 years and older) Worked full-time, year round in the past 12 months 1,795,112 7.6 1,868,746 7.4 Worked less than full-time, year round in the past 12 months Did not work 1,187,300 1,028,281 14.9 7.3 1,158,019 1,017,509 13.3* 6.2* 774,521 14.4 722,006 12.6* $25,000 to $49,999 $50,000 to $74,999 1,049,972 1,065,314 14.4 9.4 1,047,079 1,009,969 $75,000 to $99,999 $100,000 and over 817,692 1,500,142 6.1 3.4 856,534 1,604,000 5.1* 2.9* 932,939 510,059 17.2 16.9 912,609 498,280 15.7* 15.7 3,777,732 5.8 3,843,548 5.2* Household Income and Poverty Level Under $25,000 Under 1.38 of poverty threshold 1.38 to 1.99 of poverty threshold 2.00 of poverty threshold and over 13.9 9.4 Source: U.S. Census Bureau 2011 and 2012 American Community Surveys, downloaded from American FactFinder Tables S2701, September 19, 2013. Civilian noninstitutionalized population. * Statistically different at the 90% confidence level, calculations by SHADAC. N indicates cells where the number of sample cases is too small.
- 3. Uninsurance Rates for Minnesota Counties in 2011 and 2012, by Age All People 2011 Children 0-17 2012 2011 2012 % % % % Population Uninsured Population Uninsured Population Uninsured Population Uninsured United States 306,560,685 15.1 308,896,460 14.8* 73,774,529 7.5 73,577,504 7.2* Minnesota 5,286,728 8.8 5,319,783 8.0* 1,276,035 6.3 1,275,509 5.4* Anoka Blue Earth 330,283 N 8.9 N 334,205 64,570 6.9* 7.6 84,780 N 7.8 N 84,120 12,538 3.4* 4.6 Carver Dakota 92,379 400,177 5.2 8.4 93,458 403,154 4.1 7.1 27,854 103,764 3.8 5.9 27,275 102,995 2.0 3.1* 1,158,780 143,778 9.6 7.1 1,175,049 144,922 8.4* 6.7 263,228 36,472 5.8 5.2 266,098 36,670 4.7 4.0 Ramsey St. Louis 510,676 196,852 11.2 8.1 515,634 196,584 10.0 6.9 119,333 38,700 7.8 5.6 121,049 38,422 5.7 5.0 Scott Sherburne 131,248 87,632 6.1 9.1 133,823 87,656 5.5 6.1 39,360 25,066 4.3 4.4 39,548 25,457 2.5 2.9 Stearns Washington 150,156 238,618 8.7 5.4 150,526 240,888 6.0* 6.3 34,346 62,646 6.5 3.0 34,309 62,734 3.8 7.3* Wright 125,686 7.2 126,271 6.7 37,516 5.1 37,110 5.8 Hennepin Olmsted Source: U.S. Census Bureau 2011 and 2012 American Community Surveys, downloaded from American FactFinder Tables S2701, September 19, 2013. Civilian noninstitutionalized population. * Statistically different at the 90% confidence level, calculations by SHADAC. N indicates cells where the number of sample cases is too small.