Sopra Steria: First-half 2016 in line with 2017 objectives
•
0 likes•409 views

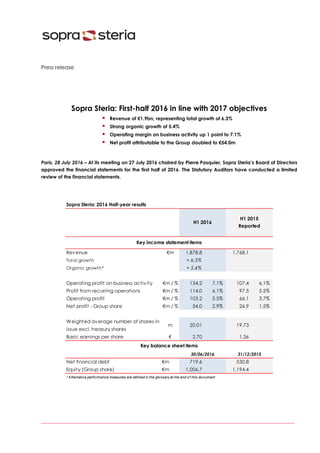
- Sopra Steria's revenue for the first half of 2016 increased 6.3% to €1.878 billion, with organic growth of 5.4%. Operating margin on business activity improved to 7.1% from 6.1% in the prior year. - Net profit attributable to the Group doubled to €54 million compared to €26.9 million in the first half of 2015. - The company confirmed its targets for 2016 of organic revenue growth between 3-5% and operating margin on business activity over 7.5%, and targets for 2017 of revenue between €3.8-4 billion and operating margin on business activity between 8-9%.

Recommended
More Related Content
What's hot
What's hot (17)
Viewers also liked
Viewers also liked (14)
Similar to Sopra Steria: First-half 2016 in line with 2017 objectives
Similar to Sopra Steria: First-half 2016 in line with 2017 objectives (20)
Recently uploaded
Recently uploaded (20)
Sopra Steria: First-half 2016 in line with 2017 objectives
- 1. Press release Sopra Steria: First-half 2016 in line with 2017 objectives Revenue of €1.9bn, representing total growth of 6.3% Strong organic growth of 5.4% Operating margin on business activity up 1 point to 7.1% Net profit attributable to the Group doubled to €54.0m Paris, 28 July 2016 – At its meeting on 27 July 2016 chaired by Pierre Pasquier, Sopra Steria’s Board of Directors approved the financial statements for the first half of 2016. The Statutory Auditors have conducted a limited review of the financial statements. Revenue €m 1,878.8 1,768.1 Total growth + 6.3% Organic growth* + 5.4% Operating profit on business activity €m / % 134.2 7.1% 107.4 6.1% Profit from recurring operations €m / % 114.0 6.1% 97.5 5.5% Operating profit €m / % 103.2 5.5% 66.1 3.7% Net profit - Group share €m / % 54.0 2.9% 26.9 1.5% Weighted average number of shares in issue excl. treasury shares m 20.01 19.73 Basic earnings per share € 2.70 1.36 Net financial debt €m 719.6 530.8 Equity (Group share) €m 1,006.7 1,194.4 Sopra Steria: 2016 Half-year results H1 2015 Reported * Alternative performance measures are defined in the glossary at the end of this document Key balance sheet items 30/06/2016 31/12/2015 Key income statement items H1 2016
- 2. 2/9 Comments on business activity and operating performance for the first half of 2016 Sopra Steria Group had a dynamic first-half 2016, with revenue of €1,878.8 million, up 6.3%. Growth at constant scope and exchange rates was 5.4%. The Group’s operating profit on business activity grew by 25.0% with respect to the first half of 2015, to €134.2 million, yielding a margin of 7.1% – up one point from the previous year. In France, first-half revenue came to €778.8 million, representing organic growth of 9.5%. Consulting & Systems Integration was particularly buoyant, with revenue of €677.6 million, representing organic growth of 11.5%. This momentum was driven in particular by the robust growth in strategic key accounts (up 13%) and in Consulting (up 22%). It was also due to lower levels of consultant downtime in early 2016 and to the three additional invoicing days in the second quarter. This change reflected above all the Group’s capacity to position itself to respond to large-scale global requests for proposals and has been illustrated by the signing of major deals. The highest- performing vertical markets were defence and transport. The activity’s growth was coupled with improved profitability: the operating margin on business activity came to 9.8% in first-half 2016 versus 9.6% in first-half 2015. I2S (Infrastructure & Security Services) recorded revenue of €101.2 million. In the IT infrastructure management business, which generated 90% of the entity’s revenue, sales momentum improved, with a tighter focus on higher value-added projects. As such, negative growth in the second quarter was contained at 1.3% (versus negative growth of 4.5% in Q1 2016). Positive growth may resume in 2017. The cybersecurity business continued to record strong revenue growth (up 6.3% in the half-year period). In terms of profitability, I2S continued to pursue its recovery plan in the first half of 2016. At 30 June 2016, the operating margin on business activity had improved as planned to 0.5%, versus -0.5% at 30 June 2015. The United Kingdom posted first-half 2016 revenue of €483.4 million (26% of Group revenue), representing slightly negative growth of 0.9% at constant perimeter and exchange rate. In this region, 78% of business is based on relatively non-cyclical multi-year contracts (for services such as outsourcing of business processes, IT infrastructure management and application management). Public-sector activities – which generated 68% of the entity’s revenue, half of which was through two joint ventures with the UK authorities – posted organic growth of 0.8% for the half-year period. Private-sector activities, which are currently being reorganised, were down 4.0%. The region’s operating margin on business activity improved in first-half 2016, amounting to 7.3% (6.4% in first-half 2015). Revenue for the Other Europe region was €355.6 million for first-half 2016, representing organic growth of 5.7%. Continuing the trend seen in the first quarter, nearly all countries posted growth. Spain, Italy and the Benelux (Belgium/Netherlands/Luxembourg) region were particularly buoyant, with organic growth of over 10%. The region’s profitability improved substantially, with the operating margin on business activity reaching 4.4%, versus 0.6% in first-half 2015. Germany was a key driver of this recovery, with an operating margin on business activity of 3.4% in the first half of 2016, versus -4.5% for the same period in the previous year. Sopra Banking Software posted revenue of €160.2 million for the first half of 2016, representing organic growth of 7.4%. The half-year period was marked by good momentum in services and a strong sales performance for the Platform and Amplitude products. An important milestone was reached in the renewal of La Banque Postale’s IT system, with the first delivery of the account management module a few months after that of the lending module. Another highlight of Q2 2016 was the signing of a strategic partnership with Société Générale and La Banque Postale, through their joint subsidiary Transactis, to process European and international bank transfers and direct debits using the Sopra Banking Platform for Payments software solution. This partnership offers Sopra Banking Software new prospects in the field of payments. Lastly, the integration of Cassiopae, which contributed €14.4 million to revenue for the half-year period, proved promising. For Sopra Banking Software, the operating margin on business activity came to 4.3% in the first six
- 3. 3/9 months of the year (7.2% in first-half 2015), reflecting the impact of investments in research and development in the half-year period (up €6 million with respect to first-half 2015). In line with its roadmap for 2017, the entity will continue to target an annual operating margin on business activity of around 10%. Other Solutions (HR and Real estate solutions) posted revenue of €100.7 million for first-half 2016, representing organic growth of 1.7%. The deferral of some contract signings from the first half to the second half of the year should lead to more buoyant growth in the second part of the year. In terms of profitability, the reporting unit recorded a 0.4 point increase in its operating margin on business activity, which came to 9.2% (8.8% in first-half 2015). Comments on net profit for the first half of 2016 Profit from recurring operations came to €114.0 million. This includes a €10.2 million expense related to share- based payments following the implementation of an employee share ownership plan, as announced on 22 March 2016, including a portion for shares acquired by employees and a portion for matching employer contributions. Operating profit was €103.2 million after a net expense of €10.7 million for other operating income and expenses. These included €7.9 million in reorganisation and restructuring expenses, significantly less than in the first half of 2015 (€30.4 million). The tax expense was €44.4 million in the half-year period, versus €25.2 million in the first half of 2015. The share of profit of equity-accounted companies (mainly Axway) was €3.8 million (€0.2 million in first-half 2015). After €0.2 million attributable to minority interests, the net profit attributable to the Group doubled, amounting to €54.0 million, equivalent to 2.9% of revenue (compared with 1.5% of revenue at 30 June 2015). Basic net earnings per share also doubled, coming to €2.70 (€1.36 at 30/06/15). Workforce At 30 June 2016, the Group’s total workforce consisted of 39,200 people (38,450 at 31 December 2015), with 16.9% working in X-Shore zones. Changes in scope The Group made a number of acquisitions in first-half 2016: Cassiopae, a developer of specialised finance and real estate management software, which posted revenue of €50 million in 2015 (consolidated in Q2 2016); LASCE Associates, a consulting firm specialising in operational excellence for industry and logistics, which posted revenue of €8 million in 2015 (consolidated in Q3 2016); EchoSystems, a start-up that develops digital solutions for managing and operating real estate assets, which posted revenue of around €1 million in 2015 (consolidated in Q2 2016); An 8.62% stake in Axway’s share capital sold by Société Générale, bringing Sopra Steria’s shareholding in Axway to 33.52%.
- 4. 4/9 Financial position at 30 June 2016 Sopra Steria’s financial position at 30 June 2016 is robust in terms of both financial ratios and liquidity. Free cash flow for the first half of the year, which is traditionally a period of net cash outflows, improved with respect to first-half 2015 (an outflow of €100.6 million versus an outflow of €163.2 million). Net financial debt is €719.6 million at the end of June 2016, equal to 2.2x EBITDA (with the bank covenant stipulating a maximum of 3x). At 30 June 2016, the Group has €1.6 billion in financing, of which €1 billion was available. The Group’s bank facilities were renegotiated on 7 July 2016 for a period of five years (with extensions possible to 2022 and 2023). Targets for 2016 The Group confirms its targets for the full 2016 financial year: - organic revenue growth of between 3% and 5% - an operating margin on business activity of more than 7.5% - a strong increase in free cash flow The targets for 2017 remain unchanged: - revenue of between €3.8 billion and €4 billion - an operating margin on business activity of between 8% and 9% Presentation meeting The results for the first half of 2016 will be presented to analysts and investors in French on 28 July 2016 at 9:00 a.m. CET, at the Shangri-La Hotel in Paris. The presentation may be attended remotely via a bilingual webcast in French and English: Register for the French-language webcast: http://edge.media-server.com/m/p/ejiqmqg8 Register for the English-language webcast: http://edge.media-server.com/m/p/ejiqmqg8/lan/en Or by phone: French-language phone number: +33 (0)1 70 77 09 27 English-language phone number: +44 (0)203 367 9457 Practical information on the presentation and webcast can be found in the “Investors” section of the Group’s website: www.soprasteria.com Next financial release Thursday, 3 November 2016 (before market open): publication of Q3 2016 revenue
- 5. 5/9 Glossary Restated revenue: Revenue for the prior year, expressed on the basis of the scope and exchange rates for the current year. Organic revenue growth: Increase in revenue between the period under review and the restated revenue for the same period in the prior financial year. EBITDA: This measure, as defined in the Registration Document, is equal to the consolidated operating profit on business activity adding back depreciation and amortisation and current provisions. Operating profit on business activity: This measure, as defined in the Registration Document, is equal to profit from recurring operations adjusted to exclude the expense relating to the cost of services rendered by the grantees of stock options and free shares and additions to the amortisation of allocated intangible assets. Profit from recurring operations: This measure is equal to operating profit before other operating income and expenses, which contains any particularly significant items of operating income and expense that are unusual, abnormal, infrequent or not predictive, presented separately in order to give a clearer picture of performance based on ordinary activities. Free cash flow: Free cash flow is defined as the net cash from operating activities (as described in the consolidated cash flow statement in the Registration Document), less investments (net of disposals) in tangible and intangible fixed assets, adjusted for net interest and less additional contributions to address any deficits in defined-benefit pension plans. Disclaimer This presentation contains forward-looking information subject to certain risks and uncertainties that may affect the Group’s future growth and financial results. Readers are reminded that licence agreements, which often represent investments for clients, are signed in greater numbers in the second half of the year, with varying impacts on end-of-year performance. Actual outcomes and results may differ from those described in this document due to operational risks and uncertainties. More detailed information on the potential risks that may affect the Group’s financial results are available in the 2015 Registration Document filed with the Autorité des Marchés Financiers (AMF) on 22 April 2016 (see pages 33 and following in particular). Sopra Steria does not undertake any obligation to update the forward-looking information contained in this document beyond what is required by current laws and regulations. The distribution of this document in certain countries may be subject to certain laws and regulations. Persons physically present in countries where this document is released, published or distributed should inquire as to any applicable restrictions and should comply with those restrictions. About Sopra Steria Sopra Steria, a European leader in digital transformation, provides one of the most comprehensive portfolios of end-to-end service offerings on the market: consulting, systems integration, software development, infrastructure management and business process services. Sopra Steria is trusted by leading private and public-sector organisations to deliver successful transformation programmes that address their most complex and critical business challenges. Combining high quality and performance services, added value and innovation, Sopra Steria enables its clients to make the best use of digital technology. With over 39,200 employees in more than 20 countries, Sopra Steria had revenue of €3.6 billion in 2015. Sopra Steria (SOP) is listed on Euronext Paris (Compartment A) - ISIN: FR0000050809 For more information, please visit our website: www.soprasteria.com Contacts Investor Relations Press Relations Olivier Psaume Simon Zaks (Image 7) olivier.psaume@soprasteria.com szaks@image7.fr +33 (0)1 40 67 68 16 +33 (0)1 53 70 74 63
- 6. 6/9 Annexes Sopra Steria: Impact on revenue of changes in scope and exchange rates - H1 2016 Revenue 1,878.8 1,768.1 + 6.3% Changes in scope 54.9 Change in exchange rates -39.8 Revenue at constant scope and exchange rates 1,878.8 1,783.3 + 5.4% €m H1 2016 H1 2015 Growth Pound sterling 0.7788 0.7323 - 6.0% Norwegian krone 9.4197 8.6483 - 8.2% Swedish krona 9.3019 9.3401 + 0.4% Danish krone 7.4497 7.4562 + 0.1% Swiss franc 1.0960 1.0567 - 3.6% Sopra Steria: changes in exchange rates - H1 2016 For €1 / % Average rate H1 2016 Average rate H1 2015 Change France 778.8 711.1 666.2 + 9.5% + 16.9% United Kingdom 483.4 487.6 518.3 - 0.9% - 6.7% Other Europe 355.6 336.3 346.3 + 5.7% + 2.7% Sopra Banking Software 160.2 149.2 138.3 + 7.4% + 15.8% Other Solutions 100.7 99.0 99.0 + 1.7% + 1.7% Sopra Steria Group 1,878.8 1,783.3 1,768.1 + 5.4% + 6.3% * Revenue at 2016 scope and exchange rates Sopra Steria: Revenue by reporting unit (€m / %) - H1 2016 Organic growth Total growth H1 2015 Restated* H1 2015 Reported H1 2016 France 391.1 351.0 332.9 + 11.4% + 17.5% United Kingdom 246.2 244.7 266.7 + 0.6% - 7.7% Other Europe 185.0 171.8 176.4 + 7.7% + 4.9% Sopra Banking Software 91.5 80.5 69.3 + 13.7% + 32.0% Other Solutions 51.8 50.8 50.8 + 2.0% + 2.0% Sopra Steria Group 965.6 898.8 896.1 + 7.4% + 7.8% * Revenue at 2016 scope and exchange rates Sopra Steria: Revenue by reporting unit (€m / %) - Q2 2016 Q2 2016 Q2 2015 Reported Q2 2015 Restated* Organic growth Total growth
- 7. 7/9 €m % €m % Revenue 778.8 666.2 Operating profit on business activity 66.8 8.6% 53.3 8.0% Profit from recurring operations 59.5 7.6% 53.0 8.0% Operating profit 54.6 7.0% 32.3 4.8% of which C&SI (including CIMPA) Organic growth + 11.5% Revenue 677.6 562.8 Operating profit on business activity 66.3 9.8% 53.8 9.6% Profit from recurring operations 59.5 8.8% 53.5 9.5% Operating profit 57.0 8.4% 38.4 6.8% of which I2S Organic growth - 2.1% Revenue 101.2 103.4 Operating profit on business activity 0.5 0.5% -0.5 -0.5% Profit from recurring operations 0.0 0.0% -0.5 -0.5% Operating profit -2.4 -2.4% -6.1 -5.9% Revenue 483.4 518.3 Operating profit on business activity 35.4 7.3% 33.3 6.4% Profit from recurring operations 29.3 6.1% 26.9 5.2% Operating profit 29.2 6.0% 25.2 4.9% Revenue 355.6 346.3 Operating profit on business activity 15.8 4.4% 2.2 0.6% Profit from recurring operations 13.9 3.9% 1.7 0.5% Operating profit 11.1 3.1% -4.9 -1.4% Revenue 160.2 138.3 Operating profit on business activity 6.9 4.3% 9.9 7.2% Profit from recurring operations 2.6 1.6% 7.2 5.2% Operating profit 1.1 0.7% 7.2 5.2% Revenue 100.7 99.0 Operating profit on business activity 9.3 9.2% 8.7 8.8% Profit from recurring operations 8.7 8.6% 8.7 8.8% Operating profit 8.1 8.0% 6.4 6.5% Other Europe H1 2015 Sopra Steria: Performance by reporting unit - H1 2016 H1 2016 United Kingdom France Other Solutions Sopra Banking Software
- 8. 8/9 €m % €m % Revenue 1,878.8 1,768.1 Staff costs -1,150.8 -1,084.4 Operating expenses -572.9 -554.0 Depreciation, amortisation and provisions -20.9 -22.3 Operating profit on business activity 134.2 7.1% 107.4 6.1% Expenses related to stock options and related items -10.2 -0.4 Amortisation of allocated intangible assets -10.1 -9.5 Profit from recurring operations 114.0 6.1% 97.5 5.5% Other operating income and expenses -10.7 -31.4 Operating profit 103.2 5.5% 66.1 3.7% Cost of net financial debt -3.8 -4.1 Other financial income and expenses -4.6 -7.7 Income tax expense -44.4 -25.2 Share of net profit from equity-accounted companies 3.8 0.2 Net profit 54.2 2.9% 29.3 1.7% Group share 54.0 2.9% 26.9 1.5% Minority interests 0.2 2.4 Weighted average number of shares in issue excl. treasury shares (m) 20.01 19.73 Basic earnings per share (€) 2.70 1.36 H1 2015 Reported Sopra Steria: Consolidated income statement - H1 2016 H1 2016 Goodwill 1,571.9 1,586.9 Allocated intangible assets 172.1 186.5 Other fixed assets 160.9 162.8 Equity-accounted investments 192.6 154.4 Fixed assets 2,097.5 2,090.7 Net deferred tax 152.3 127.0 Trade accounts receivable (net) 1,118.1 1,099.8 Other assets and liabilities -1,036.6 -1,117.2 Working capital requirement (WCR)* 81.5 -17.4 Assets + WCR 2,331.3 2,200.1 Equity 1,040.7 1,233.1 Provisions for post-employment benefits 447.6 309.4 Provisions for contingencies and losses 123.4 126.8 Net financial debt 719.6 530.8 Capital invested 2,331.3 2,200.1 * After reclassification of certain items in WCR as of 31/12/2015 31/12/201530/06/2016 Sopra Steria: Simplified balance sheet (€m) - 30/06/2016
- 9. 9/9 Net debt at beginning of period (A) 530.8 442.4 Cash flow from operations before cost of net financial debt and tax 140.2 102.2 Tax paid -33.0 -6.1 Change in operating working capital requirement -172.9 -226.0 Net cash from/used in operations -65.7 -129.9 Change relating to investing activities -20.1 -17.7 Net financial interest paid -4.0 -5.3 Additional contributions related to defined-benefit pension plans -10.8 -10.4 Free cash flow -100.6 -163.3 Changes in scope -104.7 - Financial investments -0.1 3.4 Dividends received from equity-accounted companies 0.2 - Capital increases in cash 2.0 - Transactions in treasury shares 9.3 -22.6 Other changes -0.1 0.3 Total net change for the period (B) -194.0 -182.2 Changes in exchange rates (C) 5.2 6.5 Net debt at period-end (A-B-C) 719.6 618.1 (€m) H1 2015 Sopra Steria: Changes in net financial debt - H1 2016 H1 2016 Sopra Steria: Workforce breakdown - 30/06/2015 30/06/2016 31/12/2015 France 18,223 17,606 United Kingdom 6,581 6,722 Other Europe 7,607 7,495 Rest of the World 147 134 X-Shore 6,642 6,493 Total 39,200 38,450