SlideShare une entreprise Scribd logo
1  sur  29
Télécharger pour lire hors ligne
Marketing to the Post-Recession Consumers:
 How Distinct Segments Emerging from the Recession
Will Create Challenges and Opportunities for Marketers


                 Steadfast                  Apathetic
                Frugalists                  Materialists


              Involuntary                        Pragmatic
           Penny-Pinchers                        Spenders


                      Study Highlights
                        (from the Full Report)


                                                             Decitica Marketing Strategy & Research
                                                                                  val@decitica.com
                                                                                     November 2009
What is this Study About?

 This research fills a major gap in marketers’ understanding of how the recession is shaping consumer behavior. We
 believe that marketing in the post-recession world needs a new lens to reflect the many differences in the way
 consumers have internalized the recession experience.
 Specifically, this research by Decitica concludes:
 1.   The effects of the Great Recession on consumer behavior are so profound that many of the assumptions
      underpinning consumer segmentation are no longer valid; and
 2.   Marketing strategies that do not fully recognize the diversity of consumers’ recession experiences won’t have the
      desired potency in the post-recession world.
 It is undeniable that this recession has shaken the bedrock of American consumerism. Many have accepted this radical
 change as the “new normal,” and not just a cyclical phenomenon.
 With consumer sentiment oscillating from mildly encouraging to disappointing, the trillion dollar question remains:
 When will the American consumer loosen the reins on restraint and ratchet up spending to meaningful levels?
 Experts posit that the household deleveraging process is far from complete. Adjustment of household balance sheets,
 which had begun in earnest in the thick of the recession, continues apace with nary a sign of ending anytime soon.
 With this backdrop, the debate continues whether the American consumers are so indelibly scarred by the
 recession that they have forever abandoned the profligate spending habits of the past in favor a more restrained
 approach.
 This study goes beyond superficial measures of consumer sentiment. Using data from a proprietary survey, this
 research not only concludes that the recession has caused a profound, deep-rooted change in consumers’ spending habits
 but also that there are four distinct consumer segments emerging from the recession. We provide highlights of our
 findings in the following pages.


                                                                                                                          2
Table of Contents

      Survey Methodology and Respondent Profile………..…………….………....       4
      Four Segments Emerging from the Recession……………….………………..          5
            1. Steadfast Frugalists……………………………….….…….……….….             6
            2. Involuntary Penny-Pinchers……………….……..…….….……….…          7
            3. Pragmatic Spenders……………………………..……….……..……..              8
            4, Apathetic Materialists……..……………….…..…….…………….….          9
       Differences Across Segments, and Income, Gender and Age Groups
           Trading Down and Seeking Deals………….……………………………               10
            Pre-Purchase Deliberations…………………………….………………..              12
            Self-Efficacy in Practicing Restraint…………………………………….        14
            Appreciating Thrift……………………………………………….……….                  16
            Permanent Change in Buying Behavior………………………………..           18
            Price Dominance and Diminished Brand Equity……………………..       20
            Decline in Hedonic Shopping……………….…………………………..              22
            Decline in Impulse Buying…………………….…………………………                24
            Psychological Effects from the Recession……………………………..       26
      What is in the Full Report?………………………………………………………..                28
      About Decitica………………………………………………………………...……                       29


                                                                             3
Survey Methodology and Respondent Profile

◊ The data for the study were
                                                  Gender             Total Sample  1,055
  collected through an online                                                                                   Age
  survey conducted August 5-12,
  2009. OTX, a leading provider                                                                       16%
  of online-based research,
                                                                                                                           29%
  executed the survey on
  Decitica’s behalf.
                                     48%
◊ The total sample of 1,055 survey                               52%
                                                                                               21%
  respondents consisted of
  various demographic groups
  spanning gender, age (21-70),                                                                                           18%
  income and region.                                                                                    16%
◊ There were slightly more                       Women   Men
                                                                                              21-29   30-39    40-49    50-59    60-70
  women (52%) than men in the
  sample.
◊ Three in ten were people in                    Household Income                                                Region
  their 20’s.
                                                  5%     8%
◊ 36% were from households with                                                                                           20%
                                           11%                            Below $25,000               22%
  income $100,000 or more.
                                                                 18%      $25,000-$49,999
◊ Data were weighted on                                                   $50,000-$74,999
  household income (HHI) using                                            $75,000-$99,999
  indicators from the Federal
                                     20%                                  $100,000-$149,999
  Reserve’s Survey of Consumer
                                                                          $150,000-$199,999                                      23%
  Finances (2007).
                                                               24%        $200,000 or more
                                                                                                      35%
                                            13%

                                                                                               Northeast      Midwest    South     West


                                                                                                                                          4
Four Distinct Consumer Segments Emerging from the Recession

◊ Our consumer segmentation approach is based on the premise that the best way to predict future behavior is to analyze:
    (a) Howintensely a particular activity is already being practiced (greater the frequency, greater the probability of
       repeating that action in the future),
    (b) How much satisfaction is derived from this activity (greater the satisfaction, greater the likelihood of sticking to that
       behavior), and
    (c) How confident someone is in practicing desired behaviors (higher the confidence level, higher the odds of being
        successful in accomplishing the goal) .

◊ This study gathered extensive data on the frequency and satisfaction with twenty nine different purchase and consumption
  activities and the self-efficacy (i.e., consumers’ beliefs about their abilities to achieve certain outcomes) associated with
  various spending and saving strategies.

◊ Subjecting these data into Cluster Analysis, we identified four distinct segments emerging from the recession. They are:
    1. Steadfast Frugalists, 2. Involuntary Penny-Pinchers, 3. Pragmatic Spenders, and 4. Apathetic Materialists

                                                              Segment Size

                                           20%            22%
                                                                                   Apathetic Materialists
                                                                                   Pragmatic Spenders
                                                                                   Involuntary Penny-Pinchers

                                         29%                                       Steadfast Frugalists
                                                           29%


◊    The following pages describe these segments in some detail and provide highlights of data available in the full report.


                                                                                                                                    5
1. Steadfast Frugalists

Main Characteristics:
                                                    Gender                                  Percent Below and Above $75,000
◊ Size  20% in the population.                                                                           HHI
                                                                                     30%
◊ 6 in 10 are women.
                                                                                     25%           22%
◊ Composed of people from all
  age groups; however, fewer                                                         20%                                18%
                                      41%
  from Gen X and Gen Y.
                                                                                     15%
◊ Steadfast Frugalists are the
                                                                     59%
  most disciplined in their                                                          10%
  behaviors and seriously                                                                   Below $75,000 $75,000 or More
  committed to self-restraint.                                                                   HHI           HHI
◊ It is likely that many of these
                                               Women         Men
  individuals deemed themselves
  tightwads even before the
  recession.
                                            Percent in Each Age Group                       Percent in Each Geographic
   o 29% of individuals in this
                                                                                                       Region
     group considered themselves      30%
                                                             27%
     tightwads in this survey.                                                       25%
                                      25%                            24%
◊ Marketers will find this group to
                                                                             21%                                  21%         21%
  be the most challenging.
                                      20%
                                                                                     20%
                                            16%                                              18%         18%
                                      15%
                                                     12%

                                      10%                                            15%
                                            21-29    30-39   40-49   50-59   60-70         Northeast   Midwest    South       West


                                                             Age                                               Region


                                                                                                                                     6
2. Involuntary Penny-Pinchers

Main Characteristics:
                                                    Gender                                 Percent Below and Above $75,000 HHI
◊ Size  29% in the population.                                                      40%           36%
◊ 6 in 10 are women.                                                                 35%
◊ Over-represented by people in                                                      30%
  their 30s and 40s.                  39%                                            25%                                  22%

◊ Involuntary Penny-Pinchers are                                                     20%
  the most severely affected –                                                       15%
                                                                     61%
  financially and emotionally -- by                                                  10%
  the recession.                                                                            Below $75,000        $75,000 or More
                                                                                                 HHI                  HHI
◊ Their new-found frugality for
  the most part has been forced                Women         Men
  upon them. Half have not saved
  any money for emergencies.
◊ Spending for a sizeable                      Percent in Each Age Group                      Percent in Each Geographic
                                                             38%                                         Region
  proportion (38%) in this group      40%            37%
                                                                                     35%                 34%
  exceeded their income last
  year, indicating that they were                                    29%
                                      30%                                                                         30%
  not that disciplined to begin             26%                                      30%
  with.                                                                                      26%
                                      20%                                    18%                                                24%
◊ Marketers will find this group to                                                  25%
  be quite challenging to
  influence mainly due to their       10%                                            20%
  lower/diminished capacity to              21-29    30-39   40-49   50-59   60-70         Northeast   Midwest    South         West
  spend.
                                                             Age                                                 Region


                                                                                                                                       7
3. Pragmatic Spenders

Main Characteristics:
                                                   Gender                                  Percent in the Below and Above
◊ Size  29% in the population.                                                                      $75,000 HHI
◊ 6 in 10 are men.                                                                  50%
                                                                                    40%                            37%
◊ Over-represented by people in
  their 60s, and from the                                           42%             30%
  Northeast and West.                                                                             22%
                                                                                    20%
◊ Over a third of the people with    58%
  greater than $75,000 HHI are in                                                   10%
  this group.                                                                                 Below             $75,000 or
                                                                                           $75,000 HHI          More HHI
◊ Pragmatic Spenders have the
  greatest capacity – both                    Women         Men
  financial and psychological – to
  willfully resurrect their past
  spending patterns.                         Percent in Each Age Group                     Percent in Each Geographic
                                                                                                      Region
◊ Their approach to spending is      60%
  tempered with caution; they                                               51%     35%     33%
                                     50%                                                                                     32%
  have cut back and are engaging
                                                                                    30%                           28%
  in thrift like others but seem     40%                            35%                                 26%
  less troubled by the recession.                   29%                             25%
                                     30%
◊ Pragmatic Spenders will be the           20%              21%
                                     20%                                            20%
  most attractive to marketers
  given their above-average          10%                                            15%
  financial wherewithal.                   21-29    30-39   40-49   50-59   60-70         Northeast   Midwest     South      West


                                                            Age                                           Region


                                                                                                                                    8
4. Apathetic Materialists

Main Characteristics:
                                                    Gender                                 Percent Below and Above $75,000
◊ Size  22% in the population.                                                                          HHI
                                                                                     30%
◊ Slightly more men than women.                                                                                     24%
                                                                                     25%
◊ Over-represented by people in                                                                    21%
  their 20s (Gen Y).                                                                 20%
                                                                     45%
◊ Apathetic Materialists are less
                                      55%                                            15%
  perturbed by the recession.
  They are the least changed in                                                      10%
  terms of their spending habits                                                           Below $75,000 $75,000 or More
  and future intentions.                                                                        HHI           HHI

◊ It is likely that their relative             Women         Men
  indifference springs from their
  life stage – more younger,
  single people with limited                Percent in Each Age Group                       Percent in Each Geographic
                                                                                                       Region
  disposable income at the                  39%
  moment.                                                                            25%                                  24%
                                      35%
                                                                                             23%         23%
◊ Apathetic Materialists will be an
  attractive target for youth-        25%            23%                                                         21%
  oriented marketers.                                                                20%
                                                             14%
                                      15%                            11%     10%

                                      5%                                             15%
                                            21-29    30-39   40-49   50-59   60-70         Northeast   Midwest   South    West


                                                             Age                                           Region


                                                                                                                                 9
Trading Down and Seeking Deals

◊ Steadfast Frugalists not only                            Buying on Sale or Using Coupons and Discounts
  engage in coupon-clipping and
  deal-seeking behaviors with                                                                                                  87%
                                               Steadfast Frugalists
  greater frequency but also do                                                                                     71%
  so with considerable
  enthusiasm.                                                                                  37%
                                       Involuntary Penny-Pinchers
                                                                                                        55%
   o 9 in 10 find buying on sale or
     using coupons and discounts to                                                           34%
                                               Pragmatic Spenders
     be satisfying.                                                                     20%          % Who Find this Behavior Satisfying

◊ Involuntary Penny-Pinchers,                                                    11%                 % Who Always Practice this Behavior
  forced to adopt frugality, shop            Apathetic Materialists
                                                                                  12%
  for discounts and buy store
  labels quite extensively, but not                                   0%          20%         40%       60%           80%
  many of them get pleasure from
  these activities.
                                                                     Buying Store or Generic Brands
   o    Less than 1 in 5 find buying
       store or generic labels to be
       satisfying.                                                                                        59%
                                              Steadfast Frugalists
                                                                                                       53%
◊ Pragmatic Spenders and
  Apathetic Materialists, perhaps                                                   17%
                                       Involuntary Penny-Pinchers
                                                                                                         56%
  motivated by different factors,
  get the least satisfaction from                                                  15%
                                              Pragmatic Spenders
  trading down and clipping                                                 8%
  coupons.
                                                                           6%
                                            Apathetic Materialists
                                                                            7%

                                                                     0%           20%         40%       60%


                                                                                                                                           10
Trading Down and Seeking Deals
Income, Gender and Age Differences

◊ As the charts on the right                                    Buying on Sale or Using Coupons and Discounts
  clearly indicate, gender is a       60%     % Who Find this Behavior Satisfying         % Who Always Practice this Behavior    54%
  significant determinant of                                                        53%
  satisfaction associated with                                                      55%
                                      50%
  deal-seeking behaviors.                                 42%        43%                                           42%
                                                                                                       40%
   o More than half of 40+ women
                                      40%                                                                                        44%
     find buying on sale or using                                           38%
                                                         40%                                30%
     coupons/discounts to be
     satisfying.                      30%     24%                                                                  34%
   o Younger males (below 30)                                                             26%
                                                24%                                                  26%
     irrespective of income and       20%
     older males with HHI >$75,000           <75K,      <75K,      <$75K,       <$75K,   >75K,      >75K,      >$75K,            >$75K,
     are the least prone to buy on          Males, 21- Males, 40+ Females,     Females, Males, 21- Males, 40+ Females,          Females,
     sales promotions.                         39                   21-39        40+       39                   21-39             40+

◊ Trading down to store or
  generic labels, while practiced                                    Buying Store or Generic Brands
                                      50%
  with greater frequency in the
                                                                      41%
  below $75,000 households, is a                          37%                       38%
  less satisfying experience          40%
  generally across all eight                  27%
  groups.                             30%
                                                                                    30%                            22%           22%
   o Women in the below $75,000                                      28%                    19%
                                      20%                                                               16%
     HHI bracket find greater                             22%                                                                    22%
     satisfaction from buying store                                                         18%                    15%
                                      10%     16%                                                           11%
     or generic brands.
                                             <75K,      <75K,      <$75K,       <$75K,   >75K,      >75K,      >$75K,            >$75K,
                                            Males, 21- Males, 40+ Females,     Females, Males, 21- Males, 40+ Females,          Females,
                                               39                   21-39        40+       39                   21-39             40+


                                                         Below $75,000                              $75,000 or Above
                                                       Household Income                             Household Income
                                                                                                                                           11
Pre-Purchase Deliberations

◊ Steadfast Frugalists are
  meticulous in their pre-                                 Comparing Prices Before Purchase
  purchase activities, seeking and
  processing more product and                                                                                                     85%
  price information, and arriving            Steadfast Frugalists
                                                                                                                            78%
  at purchase decisions after
  careful deliberations.              Involuntary Penny-Pinchers
                                                                                             32%
                                                                                                               60%
   o Three-quarter of SFs always
     compare prices and half are             Pragmatic Spenders
                                                                                           26%          % Who Find this Behavior Satisfying
     taking a longer time to                                                             23%
                                                                                                        % Who Always Practice this Behavior
     evaluate and decide
                                           Apathetic Materialists
                                                                         6%
     purchases.                                                           7%
   o Given these proclivities, this
     group will be the most averse                                  0%             20%           40%         60%          80%
     to impulse buying.
                                                             Taking a Longer Time to Evaluate and Decide Purchase
◊ Involuntary Penny-Pinchers,
  while being more rational in
  their purchase processes, do               Steadfast Frugalists
                                                                                                                   64%
  not derive much satisfaction                                                                           52%
  from them.
                                                                                   15%
◊ Pragmatic Spenders and              Involuntary Penny-Pinchers
                                                                                                       47%
  Apathetic Materialists do not
  exert too much effort in pre-                                                12%                      % Who Find this Behavior Satisfying
                                             Pragmatic Spenders
  purchase deliberations, thus                                           5%
                                                                                                        % Who Always Practice this Behavior
  providing greater opportunities
                                                                         4%
  to marketers.                            Apathetic Materialists
                                                                              9%

                                                                    0%             20%           40%         60%          80%

                                                                                                                                              12
Pre-Purchase Deliberations
Income, Gender and Age Differences

◊ There is a negative correlation                                    Comparing Prices Before Purchase
  between income and pre-
  purchase deliberations.                        % Who Find this Behavior Satisfying           % Who Always Practice this Behavior
                                     50%              49%
◊ Households with less than                                                  48%       47%
                                     45%                         46%
  $75,000 (except men below 30)
  are comparing prices and           40%                                                                          41%
  taking a longer time to evaluate                            38%                                             37%            38%     38%
                                     35%                                  36%
  with greater frequency than
                                           32%
  households with HHI more than      30%                                                 29%          29%                 29%
  $75,000.
                                     25%          24%
◊ Nearly half the 40+ women with                                                                   22%
  HHI <$75,000 say they find the     20%
  experience of comparing                   <75K,      <75K,      <$75K,         <$75K,   >75K,      >75K,      >$75K,           >$75K,
  prices to be rewarding.                  Males, 21- Males, 40+ Females,       Females, Males, 21- Males, 40+ Females,         Females,
                                              39                   21-39          40+       39                   21-39            40+
◊ Women with HHI less than
  $75,000 are more deliberative                          Taking a Long Time to Evaluate and Decide Purchases
                                     40%
  in their purchase process.                                     36%
                                     35%
                                                                             33%
                                     30%
                                           27%        27%                              27%                                           26%
                                     25%                      24%                                             25%
                                                                                                                22%          22%
                                     20%                                  20%            19%
                                                  18%
                                     15%                                                                                  14%
                                                                                                   12%11%
                                     10%
                                            <75K,      <75K,      <$75K,         <$75K,   >75K,      >75K,      >$75K,           >$75K,
                                           Males, 21- Males, 40+ Females,       Females, Males, 21- Males, 40+ Females,         Females,
                                              39                   21-39          40+       39                   21-39            40+

                                                          Below $75,000                                $75,000 or Above
                                                        Household Income                               Household Income
                                                                                                                                           13
Self-Efficacy (Confidence in Practicing Restraint)

◊ What makes this research                   Percent Who are Highly Confident                   Percent Who are Highly Confident
  particularly unique is the                                 in                                in Resisting the Temptation to Spend
  examination of consumers’ self-                  Controlling Spending                                Now and Worry Later
  efficacy in practicing spending
                                      100%                            87%               100%                              87%
  restraint. (There is ample
  established research to show that   80%            69%                                80%               73%
  individuals high in self-efficacy
  are more successful in              60%                                               60%                       46%
                                                             42%
  implementing desired                40%                                               40%
  behaviors.)
                                      20%                                               20%
◊ Self-efficacy is the belief in              4%                                                  5%
  one’s abilities to successfully      0%                                                0%
  achieve certain outcomes.
                                             Percent Who are Highly Confident                   Percent Who are Highly Confident
◊ It is evident from the charts on                          in                                        in Sticking to Budget
  this page that Steadfast                            Saving Money
  Frugalists and Pragmatic                                                              100%
  Spenders are the most               80%                             70%                                                 82%
                                                                                        80%
  confident in controlling
                                      60%            52%                                                  59%
  spending, resisting the                                                               60%
  temptation to spend now and
                                      40%                                                                         34%
  worry later, save money and stick                                                     40%
  to a budget.                                               18%
                                      20%                                               20%
◊ Apathetic Materialists have the            5%                                                   4%
  least confidence in successfully    0%                                                 0%
  restraining themselves.
                                                               Apathetic Materialists      Involuntary Penny-Pinchers

                                                               Pragmatic Spenders          Steadfast Frugalists


                                                                                                                                  14
Self-Efficacy (Confidence in Practicing Restraint)
Income, Gender and Age Differences

◊ Age is positively correlated                            Percent Who are Highly Confident in Controlling Spending
  with self-efficacy in controlling    70%
  spending.                            65%                                                                          60%       61%
◊ Both men and women 40 years          60%                                                     57%       58%
  or older, irrespective of income,    55%
  are significantly more confident     50%                                          47%
  about restraining spending.                                           43%
                                       45%                  42%
◊ 40+ women with greater               40%      37%
  disposable income are the most
                                       35%
  confident about resisting the
                                       30%
  temptation to spend now and
                                               >$75K,      <$75K,     <75K,      >75K,      <75K,      <$75K,   >75K,      >$75K,
  worry later, indicating they are            Females,    Females,   Males, 21- Males, 21- Males, 40+ Females, Males, 40+ Females,
  more long-term focused.                       21-39       21-39       39         39                   40+                 40+
   o This finding is not good news
     for marketers whose traditional                 Percent Who are Highly Confident in Resisting the Temptation to Spend
     audience are mainly boomer        80%                                  Now and Worry Later
     women.                                                                                                               72%
                                       70%                                                           66%        67%
                                                                                          63%
                                       60%

                                       50%
                                                           41%         41%         43%
                                       40%     37%

                                       30%
                                              <75K,        <$75K,     >75K,        >$75K,     <$75K,   >75K,      <75K,      >$75K,
                                             Males, 21-   Females,   Males, 21-   Females,   Females, Males, 40+ Males, 40+ Females,
                                                39          21-39       39          21-39      40+                            40+

                                                          Below 40 Years                                40 Years or Older
                                                                                                                                    15
Appreciating Thrift

◊ As is common knowledge now,                  “This recession has made me appreciate the simple things in
  the Great Recession has
                                     80%                                 life.”                     77%
  induced new attitudes towards
  thrift.
                                                                                            60%
◊ What is most interesting is the    60%
  variation in the internalization                                 45%
  of the recession experience        40%
  across the four segments we                 31%
  have identified.
                                     20%
◊ The intensity of the new
                                            Apathetic           Pragmatic            Involuntary     Steadfast
  realization increases linearly
                                           Materialists         Spenders           Penny-Pinchers    Frugalists
  from Apathetic Materialists to
  Steadfast Frugalists, with
  Pragmatic Spenders and
  Involuntary Penny-Pinchers in
                                              “I have begun to appreciate the benefits of thrifty living as a
  between.
                                                     result of my experience during this recession.”
◊ Steadfast Frugalists are the
  most appreciative of what the                                                                         68%
                                     70%
  recession has taught them:
  simplicity and thrifty living.                                                            48%
                                     50%
                                                                   37%
                                     30%      20%

                                     10%
                                            Apathetic           Pragmatic            Involuntary     Steadfast
                                           Materialists         Spenders           Penny-Pinchers    Frugalists


                                                      Percent who agree or strongly agree
                                                                                                                  16
Appreciating Thrift
Income and Gender Differences

◊ The recession experience has                    “This recession has made me appreciate the simple things in
  led to greater appreciation of                                            life.”
  thrifty living among women
  with HHI less than $75,000.          60%                          58%
◊ More than half in this group say
                                       55%                                                                 52%
  they appreciate the simple
  things in life and the benefits of   50%       49%                                   49%
  thrifty living.
                                       45%

                                       40%
                                             Males with HHI   Females with HHI    Males with HHI    Females with HHI
                                               <$75,000          <$75,000           >$75,000           >$75,000


                                                 “I have begun to appreciate the benefits of thrifty living as a
                                                        result of my experience during this recession.”

                                       60%
                                       55%                          51%
                                       50%
                                       45%                                             42%                 41%
                                       40%
                                                 35%
                                       35%
                                       30%
                                             Males with HHI   Females with HHI    Males with HHI    Females with HHI
                                               <$75,000          <$75,000           >$75,000           >$75,000


                                                                                                                       17
Permanent Change in Buying Behavior?

◊ When asked whether the                       “This recession has changed what and how I buy forever.”
  recession has permanently
  altered buying behavior, the
  strongest feelings were          70%
  expressed by Steadfast                                                          52%                 55%
  Frugalists and Involuntary       50%
  Penny-Pinchers.
                                                               28%
   o More than half in these two   30%      21%
     groups agreed or strongly
     agreed with this statement.   10%
◊ In terms of actions taken to            Apathetic     Pragmatic Spenders Involuntary Penny- Steadfast Frugalists
  control spending habits, two-          Materialists                           Pinchers
  third of Pragmatic Spenders
  said they are already doing
  something about it. This is              “I am not just thinking about controlling my spending habits, I
  compellingly evident from a                          am already doing something about it.”
  variety of data.
                                                                                                      88%
                                                                                  79%
                                   80%
                                                               67%
                                   60%

                                   40%      34%

                                   20%
                                          Apathetic     Pragmatic Spenders Involuntary Penny- Steadfast Frugalists
                                         Materialists                           Pinchers


                                                                                                                     18
Permanent Change in Buying Behavior?
Income and Gender Differences

◊ Once again, income is                             “This recession has changed what and how I buy forever.”
  positively correlated with the
  degree of (stated) change in
  buying habits.                       50%
   o 4 in 10 of both men and women                41%              42%
     with less than $75,000 HHI feel   40%
     the recession has changed                                                                           34%
     what and how they buy                                                            31%
     forever.                          30%
◊ In terms of putting the new
  attitudes into action, more          20%
  women (70%), irrespective of               Males with HHI   Females with HHI   Males with HHI    Females with HHI
  income level, profess to be                  <$75,000          <$75,000          >$75,000           >$75,000
  doing something about
  controlling spending habits.
                                                “I am not just thinking about controlling my spending habits, I
                                                            am already doing something about it.”
                                       80%

                                                                   70%                                   70%
                                       70%       66%
                                                                                      61%
                                       60%


                                       50%
                                             Males with HHI   Females with HHI   Males with HHI    Females with HHI
                                               <$75,000          <$75,000          >$75,000           >$75,000


                                                                                                                      19
Price Dominance and Diminished Brand Equity

◊ As marketers know too well,                    “I am the kind who first looks at price before I consider other
  price has become the dominant                                             features.”
  consideration in the purchase of
  all kinds of products.               70%                                                                66%

◊ What is of considerable              60%                         52%
  significance is the fact that half   50%
  of Pragmatic Spenders are            40%
  looking at price before other                 27%
  features and one-third say that      30%
  brand name products are not          20%                                            14%
  worth the extra price, heralding     10%
  what will likely be a long uphill
                                       0%
  struggle by marketers to shift
                                              Apathetic     Pragmatic Spenders Involuntary Penny- Steadfast Frugalists
  the focus away from price.
                                             Materialists                           Pinchers
◊ These new beliefs will continue
  to diminish the effects of brand            “I have come to realize that brand name products are not worth
  communications by marketers.                                        the extra price.”
◊ As is clear from the charts,         60%
  Involuntary Penny-Pinchers                                                                               49%
                                       50%
  followed by Apathetic
  Materialists are the least price     40%                         32%
  sensitive, but this may be little    30%
  consolation to consumer              20%      16%
  marketing firms.
                                       10%                                              4%
                                       0%
                                              Apathetic     Pragmatic Spenders Involuntary Penny- Steadfast Frugalists
                                             Materialists                           Pinchers


                                                                                                                         20
Price Dominance and Diminished Brand Equity
Income and Gender Differences

◊ Women below $75,000 HHI are                 “I am the kind who first looks at price before I consider other
  the most price sensitive, with                                         features.”
  half of them saying that they
  look at price before other       60%                          53%
  features.
                                   50%
◊ Men above $75,000 HHI do not                                                                        37%
  pay as much attention to price   40%       33%
  and are more brand-conscious     30%
  than other groups.                                                               21%
                                   20%
                                   10%
                                         Males with HHI   Females with HHI    Males with HHI    Females with HHI
                                           <$75,000          <$75,000           >$75,000           >$75,000


                                            “I have come to realize that brand name products are not worth
                                                                    the extra price.”
                                   40%

                                                                30%
                                   30%
                                             24%
                                                                                                      22%
                                   20%
                                                                                   14%

                                   10%
                                         Males with HHI   Females with HHI    Males with HHI    Females with HHI
                                           <$75,000          <$75,000           >$75,000           >$75,000


                                                                                                                   21
Decline in Hedonic Shopping

◊ This research also examined
  changes in materialism,                              Getting a Lot of Pleasure from Buying Things
  compulsive buying and impulse        80%
  buying. *
◊ Overall, all four segments
  confess to getting less pleasure     70%     70%    69%
  from buying things now
  compared to the time before
  the recession. Also, what is         60%
  more telling is that fewer                                                      58%
  anticipate this to be true one                                                                               55%
  year from now.
                                       50%
◊ Apathetic Materialists continue
  to derive the most gratification                    45%                   45%
  from buying, but even this                                                                             43%
                                       40%                                        39%
  group of consumers has shown                        38%
  a declining interest in                                                                                      35%
  materialistic consumption.
                                       30%
◊ The steepest decline in hedonic
  shopping has been for                                                           25%                          25%
  Involuntary Penny-Pinchers.
                                       20%
                                             True Before 2008         Has Been True Since        Expect to be True One
*The full report has more data based
                                                                             2008                   Year from Now
on multiple measures of materialism,
compulsive consumption and impulse
                                                       Apathetic Materialists     Involuntary Penny-Pinchers
buying.
                                                       Pragmatic Spenders         Steadfast Frugalists


                                                                                                                         22
Decline in Hedonic Shopping
Income and Gender Differences

◊ Pleasure from buying has                       Getting A Lot of Pleasure from Buying Things
  dropped significantly for all   70%
  four income-gender groups.
◊ The greatest decline has been
  for women with HHI below
  $75,000.                                61%
                                  60%
                                                 59%
                                                 57%


                                  50%
                                                 49%                                              49%      49%
                                                                         48%
                                                                               46%
                                                                               44%

                                  40%
                                                                                                           39%

                                                                               34%
                                                                                                           32%
                                  30%
                                        True Before 2008         Has Been True Since        Expect to be True One
                                                                        2008                   Year from Now

                                             Males with HHI <$75,000           Males with HHI >$75,000

                                             Females with HHI <$75,000         Females with HHI >$75,000


                                                                                                                    23
Decline in Impulse Buying

◊ The drop in impulse buying is                                        Buying on Impulse
  quite stark for all segments,
  particularly for Involuntary        70%
  Penny-Pinchers.                                 64%

◊ Apathetic Materialists continue     60%
  to be the most impulsive in their               61%
  purchases, with 40% saying
  they expect to buy on impulse       50%
  even one year from now.                            49%                        46%
                                              46%
◊ Steadfast Frugalists, while not                                                                                 40%
  that spontaneous to begin with,     40%
  have become even less so.

                                      30%                                           30%
                                                                                     25%                          25%
                                                                                                                  25%
                                      20%                                             24%                            18%

                                      10%
                                            True Before 2008         Has Been True Since             Expect to be True One
                                                                            2008                        Year from Now


                                                           Apathetic Materialists          Involuntary Penny-Pinchers
                                                           Pragmatic Spenders              Steadfast Frugalists


                                                                                                                             24
Decline in Impulse Buying
Income and Gender Differences

◊ It is striking that the pattern of   70%                               Buying on Impulse
  change in impulse buying is
  uniform across all income-age
  groups.                                          59%
                                       60%
                                               56%
                                                56%
                                       50%
                                                  51%


                                       40%
                                                                                35%
                                                                                                           33%
                                                                                 32%
                                       30%                                        30%                             32%
                                                                                                                   27%
                                                                                28%

                                       20%
                                                                                                                21%


                                       10%
                                             True Before 2008           Has Been True Since       Expect to be True One
                                                                               2008                  Year from Now

                                                      Males with HHI <$75,000         Males with HHI >$75,000

                                                    Females with HHI <$75,000         Females with HHI >$75,000


                                                                                                                          25
Psychological Effects from the Recession

◊ A fact that is clearly evident is         100%                                                   100%
                                                                   Depressed                                                     Scared
  the psychological toll the
  recession has taken on many                                                                                                                77%
                                            80%                                                    80%
  Americans. However, what is                                                                                           66%
  often overlooked are the                                   61%
                                                                                                                           58%         60%
                                                                                                                                                 57%
                                            60%      55%                           55%             60%         56%
  differences in the effects among
                                                                48%        46%
  various segments/groups.                                                                                         40%
                                                                                                                                           43%
                                                         38%                            37%
◊ Among the four segments in our            40%                                                    40%
  study, the Involuntary Penny-                                                25%
  Pinchers are enduring the                 20%                                                    20%
  greatest psychological distress.                   Frequently Felt     Feel Depressed About                  Frequently Felt   Feel Scared About the
                                                   Depressed in the Last       the Future                     Scared in the Last        Future
    o 77% are “scared” and 87% are                      One Year                                                  One Year
      “worried” about their future.
    o This is not that much of a                                   Stressed                                                      Worried
      surprise given the financial          100%                                                   100%
                                                                                                                                             87%
      burdens imposed on them due                            81%                   81%                                  81%80%
      to the recession. 54% of              80%      74%                                           80%
                                                                 70%                                           70%                               72%
      Involuntary Penny-Pinchers                                           69%                                                         68%66%
                                                                                                                  64%
      experienced a loss of 10% or                       59%                            61%
      more in their income in the last      60%                                53%                 60%
      one year.
◊ On a relative basis, the                  40%                                                    40%
  Apathetic Materialists seem to
  have been the least affected              20%                                                    20%
  emotionally.                                       Frequently Felt      Feel Stressed About                 Frequently Felt        Feel Worried About
The full report has data on 19 emotions –          Stressed in the Last        the Future                    Worried in the Last          the Future
                                                        One Year                                                 One Year
both positive and negative.
                                                                          Apathetic Materialists          Involuntary Penny-Pinchers

                                                                          Pragmatic Spenders              Steadfast Frugalists

                                                                                                                                                       26
Psychological Effects from the Recession
Income and Gender Differences

◊ By now it should be apparent
                                                             Depressed                                                     Scared
  that the demographic group
  that has been the most severely
  affected and the most                80%                                                    80%
                                                                                                                                     68%
  fundamentally altered is women                                                                            64%
  with HHI less than $75,000.                      59%                                                                                       59%
                                       60%                                                    60%     52%                      54%
                                               50%                          50%                                      50%
   o The charts to the right provide                                                                              45%
     further evidence as to why this                   40%39%           39%                                                                40%
     is so.                            40%                                         33%        40%
                                                                                30%
◊ There is a strong correlation
  between the level of                 20%                                                    20%
  psychological distress and the               Frequently Felt     Feel Depressed About                Frequently Felt     Feel Scared About the
  new attitudes and behaviors                Depressed in the Last       the Future                 Scared in the Last One        Future
                                                  One Year                                                   Year
  adopted by consumers to cope
  with the effects of the recession.                                                                                  Worried
                                                              Stressed

                                                   79%                                                    79%                        81%
                                       80%                                  73%               80%                    72%
                                                                                                                                             75%
                                                                                                      70%                      71%
                                               67%     67%65%                                                     68%
                                                                        64%        65%
                                                                                                                                           62%
                                                                                58%
                                       60%                                                    60%


                                       40%                                                    40%


                                       20%                                                    20%
                                               Frequently Felt        Feel Stressed About             Frequently Felt       Feel Worried About
                                             Stressed in the Last          the Future                Worried in the Last         the Future
                                                  One Year                                               One Year
                                                                    Males with HHI <$75,000          Males with HHI >$75,000

                                                                    Females with HHI <$75,000        Females with HHI >$75,000
                                                                                                                                                   27
What is in the Full Report?

  ◊ The full report, available for a fee, contains many more details, including data and analysis of the following
    topics. For more information, please contact val@decitica.com.
     1. 18 attitudes dealing with the effects of the recession
     2. Frequency of 29 behaviors practiced to cope with the recession
     3. Satisfaction associated with 29 behaviors practiced to cope with the recession
     4. Self-efficacy (i.e., self-confidence) associated with 15 spending and consumption restraint behaviors
     5. Recession’s effects on consumers’ emotional state (i.e., 19 different emotions)
     6. 15 measures of materialism, compulsive and impulsive buying
     7. 10 measures of consumers’ thinking styles
     8. 5 measures of maximizing-satisficing approach in buyer behavior
     9. Changing role of price in purchase decisions, value-orientation, brand effects, pre-purchase activities, etc.
     10. Expectations of future income
     11. Detailed data on saving behaviors
     12. Unique data on household budgeting practices
     13. Triggers for increasing spending
  ◊ Analyses of the above data are available for each of the segments identified in this study and also for a variety of
    demographic groups based on gender, income level and age group.

  ◊ Custom statistical analysis and interpretation also provided for an additional fee.


                                                                                                                           28
Decitica

           Decitica is a marketing strategy and research firm. We specialize in discovering new insights into evolving
           market structures and customer behaviors. Our toolkit relies on traditional market research techniques and
           new approaches based on digital technologies and social media.

           Decitica was founded with a simple goal in mind: to help marketing executives with truly excellent and
           compelling perspectives and advice on how best to market, engage and collaborate with customers.

           Dr. Val Srinivas is the Principal of Decitica with over 15 years of experience. Before establishing Decitica, he
           was Head of Marketing Strategy in the institutional advisory group at Morgan Stanley Investment
           Management. Prior to this, he led the global Market Research and Competitive Intelligence function at
           Standard & Poor’s for nine years. Val has conducted hundreds of studies covering brand equity, new product
           design, customer loyalty and satisfaction, segmentation, pricing, demand analysis and competitive analysis.

           He also served as an Adjunct Professor of Marketing at Rutgers Business School, where he received a Ph.D.
           in Marketing. Val's doctoral thesis was on marketing financial advice and investors' advice-seeking
           behavior.

           Val can be reached at val@decitica.com.


                                                                                                                              29

Contenu connexe

En vedette

πικπα πεντελη
πικπα πεντεληπικπα πεντελη
πικπα πεντεληgymnasio
 
Mike Bernos Cd Release Event Older Version Comp
Mike Bernos Cd Release Event Older Version CompMike Bernos Cd Release Event Older Version Comp
Mike Bernos Cd Release Event Older Version CompRobbyBarbaro
 
《以客户为中心的专业销售技巧》
《以客户为中心的专业销售技巧》《以客户为中心的专业销售技巧》
《以客户为中心的专业销售技巧》20004
 
Fabula Despre Iubire.Pps...................
Fabula Despre Iubire.Pps...................Fabula Despre Iubire.Pps...................
Fabula Despre Iubire.Pps...................Nicky Nic
 
C:\Users\Vermiglio\Documents\Flat Classroom Presentation
C:\Users\Vermiglio\Documents\Flat Classroom PresentationC:\Users\Vermiglio\Documents\Flat Classroom Presentation
C:\Users\Vermiglio\Documents\Flat Classroom Presentationvermigle
 
Primavara...............................
Primavara...............................Primavara...............................
Primavara...............................Nicky Nic
 
Ozgur Uckan - Türkiye'de internet sansuru hakkında bir sunum
Ozgur Uckan - Türkiye'de  internet sansuru hakkında bir sunumOzgur Uckan - Türkiye'de  internet sansuru hakkında bir sunum
Ozgur Uckan - Türkiye'de internet sansuru hakkında bir sunumOzgur Uckan
 
1.ganduri frumoase
1.ganduri frumoase1.ganduri frumoase
1.ganduri frumoaseNicky Nic
 
Txt messaging will never catch on !
Txt messaging will never catch on !Txt messaging will never catch on !
Txt messaging will never catch on !Andy Black
 
ευγενίδειο3 2013
ευγενίδειο3 2013ευγενίδειο3 2013
ευγενίδειο3 2013gymnasio
 
Laskaridi 2013
Laskaridi 2013Laskaridi 2013
Laskaridi 2013gymnasio
 
Mediascan - Real Time Media Monitoring
Mediascan - Real Time Media MonitoringMediascan - Real Time Media Monitoring
Mediascan - Real Time Media MonitoringIstvan Maczko
 
Bobcats project
Bobcats projectBobcats project
Bobcats projectvermigle
 
胜任力模型
胜任力模型胜任力模型
胜任力模型20004
 
Kallimarmaro
KallimarmaroKallimarmaro
Kallimarmarogymnasio
 
11 HUS 133 Relationships
11 HUS 133   Relationships11 HUS 133   Relationships
11 HUS 133 RelationshipsDon Thompson
 
Lions project
Lions projectLions project
Lions projectvermigle
 
By makenzie
By makenzieBy makenzie
By makenzievermigle
 
Christmas 2012 2013
Christmas 2012  2013Christmas 2012  2013
Christmas 2012 2013gymnasio
 

En vedette (20)

πικπα πεντελη
πικπα πεντεληπικπα πεντελη
πικπα πεντελη
 
Mike Bernos Cd Release Event Older Version Comp
Mike Bernos Cd Release Event Older Version CompMike Bernos Cd Release Event Older Version Comp
Mike Bernos Cd Release Event Older Version Comp
 
《以客户为中心的专业销售技巧》
《以客户为中心的专业销售技巧》《以客户为中心的专业销售技巧》
《以客户为中心的专业销售技巧》
 
Web Presen
Web PresenWeb Presen
Web Presen
 
Fabula Despre Iubire.Pps...................
Fabula Despre Iubire.Pps...................Fabula Despre Iubire.Pps...................
Fabula Despre Iubire.Pps...................
 
C:\Users\Vermiglio\Documents\Flat Classroom Presentation
C:\Users\Vermiglio\Documents\Flat Classroom PresentationC:\Users\Vermiglio\Documents\Flat Classroom Presentation
C:\Users\Vermiglio\Documents\Flat Classroom Presentation
 
Primavara...............................
Primavara...............................Primavara...............................
Primavara...............................
 
Ozgur Uckan - Türkiye'de internet sansuru hakkında bir sunum
Ozgur Uckan - Türkiye'de  internet sansuru hakkında bir sunumOzgur Uckan - Türkiye'de  internet sansuru hakkında bir sunum
Ozgur Uckan - Türkiye'de internet sansuru hakkında bir sunum
 
1.ganduri frumoase
1.ganduri frumoase1.ganduri frumoase
1.ganduri frumoase
 
Txt messaging will never catch on !
Txt messaging will never catch on !Txt messaging will never catch on !
Txt messaging will never catch on !
 
ευγενίδειο3 2013
ευγενίδειο3 2013ευγενίδειο3 2013
ευγενίδειο3 2013
 
Laskaridi 2013
Laskaridi 2013Laskaridi 2013
Laskaridi 2013
 
Mediascan - Real Time Media Monitoring
Mediascan - Real Time Media MonitoringMediascan - Real Time Media Monitoring
Mediascan - Real Time Media Monitoring
 
Bobcats project
Bobcats projectBobcats project
Bobcats project
 
胜任力模型
胜任力模型胜任力模型
胜任力模型
 
Kallimarmaro
KallimarmaroKallimarmaro
Kallimarmaro
 
11 HUS 133 Relationships
11 HUS 133   Relationships11 HUS 133   Relationships
11 HUS 133 Relationships
 
Lions project
Lions projectLions project
Lions project
 
By makenzie
By makenzieBy makenzie
By makenzie
 
Christmas 2012 2013
Christmas 2012  2013Christmas 2012  2013
Christmas 2012 2013
 

Dernier

Future Of Sample Report 2024 | Redacted Version
Future Of Sample Report 2024 | Redacted VersionFuture Of Sample Report 2024 | Redacted Version
Future Of Sample Report 2024 | Redacted VersionMintel Group
 
APRIL2024_UKRAINE_xml_0000000000000 .pdf
APRIL2024_UKRAINE_xml_0000000000000 .pdfAPRIL2024_UKRAINE_xml_0000000000000 .pdf
APRIL2024_UKRAINE_xml_0000000000000 .pdfRbc Rbcua
 
Cybersecurity Awareness Training Presentation v2024.03
Cybersecurity Awareness Training Presentation v2024.03Cybersecurity Awareness Training Presentation v2024.03
Cybersecurity Awareness Training Presentation v2024.03DallasHaselhorst
 
Global Scenario On Sustainable and Resilient Coconut Industry by Dr. Jelfina...
Global Scenario On Sustainable  and Resilient Coconut Industry by Dr. Jelfina...Global Scenario On Sustainable  and Resilient Coconut Industry by Dr. Jelfina...
Global Scenario On Sustainable and Resilient Coconut Industry by Dr. Jelfina...ictsugar
 
MAHA Global and IPR: Do Actions Speak Louder Than Words?
MAHA Global and IPR: Do Actions Speak Louder Than Words?MAHA Global and IPR: Do Actions Speak Louder Than Words?
MAHA Global and IPR: Do Actions Speak Louder Than Words?Olivia Kresic
 
Youth Involvement in an Innovative Coconut Value Chain by Mwalimu Menza
Youth Involvement in an Innovative Coconut Value Chain by Mwalimu MenzaYouth Involvement in an Innovative Coconut Value Chain by Mwalimu Menza
Youth Involvement in an Innovative Coconut Value Chain by Mwalimu Menzaictsugar
 
Call Girls Miyapur 7001305949 all area service COD available Any Time
Call Girls Miyapur 7001305949 all area service COD available Any TimeCall Girls Miyapur 7001305949 all area service COD available Any Time
Call Girls Miyapur 7001305949 all area service COD available Any Timedelhimodelshub1
 
Innovation Conference 5th March 2024.pdf
Innovation Conference 5th March 2024.pdfInnovation Conference 5th March 2024.pdf
Innovation Conference 5th March 2024.pdfrichard876048
 
Digital Transformation in the PLM domain - distrib.pdf
Digital Transformation in the PLM domain - distrib.pdfDigital Transformation in the PLM domain - distrib.pdf
Digital Transformation in the PLM domain - distrib.pdfJos Voskuil
 
Investment in The Coconut Industry by Nancy Cheruiyot
Investment in The Coconut Industry by Nancy CheruiyotInvestment in The Coconut Industry by Nancy Cheruiyot
Investment in The Coconut Industry by Nancy Cheruiyotictsugar
 
Kenya’s Coconut Value Chain by Gatsby Africa
Kenya’s Coconut Value Chain by Gatsby AfricaKenya’s Coconut Value Chain by Gatsby Africa
Kenya’s Coconut Value Chain by Gatsby Africaictsugar
 
8447779800, Low rate Call girls in New Ashok Nagar Delhi NCR
8447779800, Low rate Call girls in New Ashok Nagar Delhi NCR8447779800, Low rate Call girls in New Ashok Nagar Delhi NCR
8447779800, Low rate Call girls in New Ashok Nagar Delhi NCRashishs7044
 
Annual General Meeting Presentation Slides
Annual General Meeting Presentation SlidesAnnual General Meeting Presentation Slides
Annual General Meeting Presentation SlidesKeppelCorporation
 
8447779800, Low rate Call girls in Uttam Nagar Delhi NCR
8447779800, Low rate Call girls in Uttam Nagar Delhi NCR8447779800, Low rate Call girls in Uttam Nagar Delhi NCR
8447779800, Low rate Call girls in Uttam Nagar Delhi NCRashishs7044
 
Buy gmail accounts.pdf Buy Old Gmail Accounts
Buy gmail accounts.pdf Buy Old Gmail AccountsBuy gmail accounts.pdf Buy Old Gmail Accounts
Buy gmail accounts.pdf Buy Old Gmail AccountsBuy Verified Accounts
 
Marketplace and Quality Assurance Presentation - Vincent Chirchir
Marketplace and Quality Assurance Presentation - Vincent ChirchirMarketplace and Quality Assurance Presentation - Vincent Chirchir
Marketplace and Quality Assurance Presentation - Vincent Chirchirictsugar
 
Call Girls In Sikandarpur Gurgaon ❤️8860477959_Russian 100% Genuine Escorts I...
Call Girls In Sikandarpur Gurgaon ❤️8860477959_Russian 100% Genuine Escorts I...Call Girls In Sikandarpur Gurgaon ❤️8860477959_Russian 100% Genuine Escorts I...
Call Girls In Sikandarpur Gurgaon ❤️8860477959_Russian 100% Genuine Escorts I...lizamodels9
 
Market Sizes Sample Report - 2024 Edition
Market Sizes Sample Report - 2024 EditionMarket Sizes Sample Report - 2024 Edition
Market Sizes Sample Report - 2024 EditionMintel Group
 
/:Call Girls In Indirapuram Ghaziabad ➥9990211544 Independent Best Escorts In...
/:Call Girls In Indirapuram Ghaziabad ➥9990211544 Independent Best Escorts In.../:Call Girls In Indirapuram Ghaziabad ➥9990211544 Independent Best Escorts In...
/:Call Girls In Indirapuram Ghaziabad ➥9990211544 Independent Best Escorts In...lizamodels9
 

Dernier (20)

Future Of Sample Report 2024 | Redacted Version
Future Of Sample Report 2024 | Redacted VersionFuture Of Sample Report 2024 | Redacted Version
Future Of Sample Report 2024 | Redacted Version
 
APRIL2024_UKRAINE_xml_0000000000000 .pdf
APRIL2024_UKRAINE_xml_0000000000000 .pdfAPRIL2024_UKRAINE_xml_0000000000000 .pdf
APRIL2024_UKRAINE_xml_0000000000000 .pdf
 
Cybersecurity Awareness Training Presentation v2024.03
Cybersecurity Awareness Training Presentation v2024.03Cybersecurity Awareness Training Presentation v2024.03
Cybersecurity Awareness Training Presentation v2024.03
 
Global Scenario On Sustainable and Resilient Coconut Industry by Dr. Jelfina...
Global Scenario On Sustainable  and Resilient Coconut Industry by Dr. Jelfina...Global Scenario On Sustainable  and Resilient Coconut Industry by Dr. Jelfina...
Global Scenario On Sustainable and Resilient Coconut Industry by Dr. Jelfina...
 
MAHA Global and IPR: Do Actions Speak Louder Than Words?
MAHA Global and IPR: Do Actions Speak Louder Than Words?MAHA Global and IPR: Do Actions Speak Louder Than Words?
MAHA Global and IPR: Do Actions Speak Louder Than Words?
 
Youth Involvement in an Innovative Coconut Value Chain by Mwalimu Menza
Youth Involvement in an Innovative Coconut Value Chain by Mwalimu MenzaYouth Involvement in an Innovative Coconut Value Chain by Mwalimu Menza
Youth Involvement in an Innovative Coconut Value Chain by Mwalimu Menza
 
Call Girls Miyapur 7001305949 all area service COD available Any Time
Call Girls Miyapur 7001305949 all area service COD available Any TimeCall Girls Miyapur 7001305949 all area service COD available Any Time
Call Girls Miyapur 7001305949 all area service COD available Any Time
 
Innovation Conference 5th March 2024.pdf
Innovation Conference 5th March 2024.pdfInnovation Conference 5th March 2024.pdf
Innovation Conference 5th March 2024.pdf
 
Digital Transformation in the PLM domain - distrib.pdf
Digital Transformation in the PLM domain - distrib.pdfDigital Transformation in the PLM domain - distrib.pdf
Digital Transformation in the PLM domain - distrib.pdf
 
Investment in The Coconut Industry by Nancy Cheruiyot
Investment in The Coconut Industry by Nancy CheruiyotInvestment in The Coconut Industry by Nancy Cheruiyot
Investment in The Coconut Industry by Nancy Cheruiyot
 
Kenya’s Coconut Value Chain by Gatsby Africa
Kenya’s Coconut Value Chain by Gatsby AfricaKenya’s Coconut Value Chain by Gatsby Africa
Kenya’s Coconut Value Chain by Gatsby Africa
 
8447779800, Low rate Call girls in New Ashok Nagar Delhi NCR
8447779800, Low rate Call girls in New Ashok Nagar Delhi NCR8447779800, Low rate Call girls in New Ashok Nagar Delhi NCR
8447779800, Low rate Call girls in New Ashok Nagar Delhi NCR
 
Annual General Meeting Presentation Slides
Annual General Meeting Presentation SlidesAnnual General Meeting Presentation Slides
Annual General Meeting Presentation Slides
 
8447779800, Low rate Call girls in Uttam Nagar Delhi NCR
8447779800, Low rate Call girls in Uttam Nagar Delhi NCR8447779800, Low rate Call girls in Uttam Nagar Delhi NCR
8447779800, Low rate Call girls in Uttam Nagar Delhi NCR
 
Buy gmail accounts.pdf Buy Old Gmail Accounts
Buy gmail accounts.pdf Buy Old Gmail AccountsBuy gmail accounts.pdf Buy Old Gmail Accounts
Buy gmail accounts.pdf Buy Old Gmail Accounts
 
Marketplace and Quality Assurance Presentation - Vincent Chirchir
Marketplace and Quality Assurance Presentation - Vincent ChirchirMarketplace and Quality Assurance Presentation - Vincent Chirchir
Marketplace and Quality Assurance Presentation - Vincent Chirchir
 
Call Girls In Sikandarpur Gurgaon ❤️8860477959_Russian 100% Genuine Escorts I...
Call Girls In Sikandarpur Gurgaon ❤️8860477959_Russian 100% Genuine Escorts I...Call Girls In Sikandarpur Gurgaon ❤️8860477959_Russian 100% Genuine Escorts I...
Call Girls In Sikandarpur Gurgaon ❤️8860477959_Russian 100% Genuine Escorts I...
 
Market Sizes Sample Report - 2024 Edition
Market Sizes Sample Report - 2024 EditionMarket Sizes Sample Report - 2024 Edition
Market Sizes Sample Report - 2024 Edition
 
/:Call Girls In Indirapuram Ghaziabad ➥9990211544 Independent Best Escorts In...
/:Call Girls In Indirapuram Ghaziabad ➥9990211544 Independent Best Escorts In.../:Call Girls In Indirapuram Ghaziabad ➥9990211544 Independent Best Escorts In...
/:Call Girls In Indirapuram Ghaziabad ➥9990211544 Independent Best Escorts In...
 
Japan IT Week 2024 Brochure by 47Billion (English)
Japan IT Week 2024 Brochure by 47Billion (English)Japan IT Week 2024 Brochure by 47Billion (English)
Japan IT Week 2024 Brochure by 47Billion (English)
 

Marketing to the Post-Recession Consumers

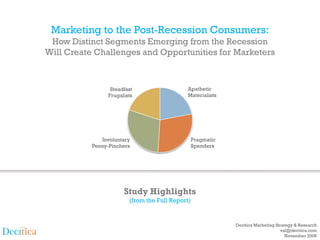
  • 1. Marketing to the Post-Recession Consumers: How Distinct Segments Emerging from the Recession Will Create Challenges and Opportunities for Marketers Steadfast Apathetic Frugalists Materialists Involuntary Pragmatic Penny-Pinchers Spenders Study Highlights (from the Full Report) Decitica Marketing Strategy & Research val@decitica.com November 2009
  • 2. What is this Study About? This research fills a major gap in marketers’ understanding of how the recession is shaping consumer behavior. We believe that marketing in the post-recession world needs a new lens to reflect the many differences in the way consumers have internalized the recession experience. Specifically, this research by Decitica concludes: 1. The effects of the Great Recession on consumer behavior are so profound that many of the assumptions underpinning consumer segmentation are no longer valid; and 2. Marketing strategies that do not fully recognize the diversity of consumers’ recession experiences won’t have the desired potency in the post-recession world. It is undeniable that this recession has shaken the bedrock of American consumerism. Many have accepted this radical change as the “new normal,” and not just a cyclical phenomenon. With consumer sentiment oscillating from mildly encouraging to disappointing, the trillion dollar question remains: When will the American consumer loosen the reins on restraint and ratchet up spending to meaningful levels? Experts posit that the household deleveraging process is far from complete. Adjustment of household balance sheets, which had begun in earnest in the thick of the recession, continues apace with nary a sign of ending anytime soon. With this backdrop, the debate continues whether the American consumers are so indelibly scarred by the recession that they have forever abandoned the profligate spending habits of the past in favor a more restrained approach. This study goes beyond superficial measures of consumer sentiment. Using data from a proprietary survey, this research not only concludes that the recession has caused a profound, deep-rooted change in consumers’ spending habits but also that there are four distinct consumer segments emerging from the recession. We provide highlights of our findings in the following pages. 2
  • 3. Table of Contents Survey Methodology and Respondent Profile………..…………….……….... 4 Four Segments Emerging from the Recession……………….……………….. 5 1. Steadfast Frugalists……………………………….….…….……….…. 6 2. Involuntary Penny-Pinchers……………….……..…….….……….… 7 3. Pragmatic Spenders……………………………..……….……..…….. 8 4, Apathetic Materialists……..……………….…..…….…………….…. 9 Differences Across Segments, and Income, Gender and Age Groups Trading Down and Seeking Deals………….…………………………… 10 Pre-Purchase Deliberations…………………………….……………….. 12 Self-Efficacy in Practicing Restraint……………………………………. 14 Appreciating Thrift……………………………………………….………. 16 Permanent Change in Buying Behavior……………………………….. 18 Price Dominance and Diminished Brand Equity…………………….. 20 Decline in Hedonic Shopping……………….………………………….. 22 Decline in Impulse Buying…………………….………………………… 24 Psychological Effects from the Recession…………………………….. 26 What is in the Full Report?……………………………………………………….. 28 About Decitica………………………………………………………………...…… 29 3
  • 4. Survey Methodology and Respondent Profile ◊ The data for the study were Gender Total Sample  1,055 collected through an online Age survey conducted August 5-12, 2009. OTX, a leading provider 16% of online-based research, 29% executed the survey on Decitica’s behalf. 48% ◊ The total sample of 1,055 survey 52% 21% respondents consisted of various demographic groups spanning gender, age (21-70), 18% income and region. 16% ◊ There were slightly more Women Men 21-29 30-39 40-49 50-59 60-70 women (52%) than men in the sample. ◊ Three in ten were people in Household Income Region their 20’s. 5% 8% ◊ 36% were from households with 20% 11% Below $25,000 22% income $100,000 or more. 18% $25,000-$49,999 ◊ Data were weighted on $50,000-$74,999 household income (HHI) using $75,000-$99,999 indicators from the Federal 20% $100,000-$149,999 Reserve’s Survey of Consumer $150,000-$199,999 23% Finances (2007). 24% $200,000 or more 35% 13% Northeast Midwest South West 4
  • 5. Four Distinct Consumer Segments Emerging from the Recession ◊ Our consumer segmentation approach is based on the premise that the best way to predict future behavior is to analyze: (a) Howintensely a particular activity is already being practiced (greater the frequency, greater the probability of repeating that action in the future), (b) How much satisfaction is derived from this activity (greater the satisfaction, greater the likelihood of sticking to that behavior), and (c) How confident someone is in practicing desired behaviors (higher the confidence level, higher the odds of being successful in accomplishing the goal) . ◊ This study gathered extensive data on the frequency and satisfaction with twenty nine different purchase and consumption activities and the self-efficacy (i.e., consumers’ beliefs about their abilities to achieve certain outcomes) associated with various spending and saving strategies. ◊ Subjecting these data into Cluster Analysis, we identified four distinct segments emerging from the recession. They are: 1. Steadfast Frugalists, 2. Involuntary Penny-Pinchers, 3. Pragmatic Spenders, and 4. Apathetic Materialists Segment Size 20% 22% Apathetic Materialists Pragmatic Spenders Involuntary Penny-Pinchers 29% Steadfast Frugalists 29% ◊ The following pages describe these segments in some detail and provide highlights of data available in the full report. 5
  • 6. 1. Steadfast Frugalists Main Characteristics: Gender Percent Below and Above $75,000 ◊ Size  20% in the population. HHI 30% ◊ 6 in 10 are women. 25% 22% ◊ Composed of people from all age groups; however, fewer 20% 18% 41% from Gen X and Gen Y. 15% ◊ Steadfast Frugalists are the 59% most disciplined in their 10% behaviors and seriously Below $75,000 $75,000 or More committed to self-restraint. HHI HHI ◊ It is likely that many of these Women Men individuals deemed themselves tightwads even before the recession. Percent in Each Age Group Percent in Each Geographic o 29% of individuals in this Region group considered themselves 30% 27% tightwads in this survey. 25% 25% 24% ◊ Marketers will find this group to 21% 21% 21% be the most challenging. 20% 20% 16% 18% 18% 15% 12% 10% 15% 21-29 30-39 40-49 50-59 60-70 Northeast Midwest South West Age Region 6
  • 7. 2. Involuntary Penny-Pinchers Main Characteristics: Gender Percent Below and Above $75,000 HHI ◊ Size  29% in the population. 40% 36% ◊ 6 in 10 are women. 35% ◊ Over-represented by people in 30% their 30s and 40s. 39% 25% 22% ◊ Involuntary Penny-Pinchers are 20% the most severely affected – 15% 61% financially and emotionally -- by 10% the recession. Below $75,000 $75,000 or More HHI HHI ◊ Their new-found frugality for the most part has been forced Women Men upon them. Half have not saved any money for emergencies. ◊ Spending for a sizeable Percent in Each Age Group Percent in Each Geographic 38% Region proportion (38%) in this group 40% 37% 35% 34% exceeded their income last year, indicating that they were 29% 30% 30% not that disciplined to begin 26% 30% with. 26% 20% 18% 24% ◊ Marketers will find this group to 25% be quite challenging to influence mainly due to their 10% 20% lower/diminished capacity to 21-29 30-39 40-49 50-59 60-70 Northeast Midwest South West spend. Age Region 7
  • 8. 3. Pragmatic Spenders Main Characteristics: Gender Percent in the Below and Above ◊ Size  29% in the population. $75,000 HHI ◊ 6 in 10 are men. 50% 40% 37% ◊ Over-represented by people in their 60s, and from the 42% 30% Northeast and West. 22% 20% ◊ Over a third of the people with 58% greater than $75,000 HHI are in 10% this group. Below $75,000 or $75,000 HHI More HHI ◊ Pragmatic Spenders have the greatest capacity – both Women Men financial and psychological – to willfully resurrect their past spending patterns. Percent in Each Age Group Percent in Each Geographic Region ◊ Their approach to spending is 60% tempered with caution; they 51% 35% 33% 50% 32% have cut back and are engaging 30% 28% in thrift like others but seem 40% 35% 26% less troubled by the recession. 29% 25% 30% ◊ Pragmatic Spenders will be the 20% 21% 20% 20% most attractive to marketers given their above-average 10% 15% financial wherewithal. 21-29 30-39 40-49 50-59 60-70 Northeast Midwest South West Age Region 8
  • 9. 4. Apathetic Materialists Main Characteristics: Gender Percent Below and Above $75,000 ◊ Size  22% in the population. HHI 30% ◊ Slightly more men than women. 24% 25% ◊ Over-represented by people in 21% their 20s (Gen Y). 20% 45% ◊ Apathetic Materialists are less 55% 15% perturbed by the recession. They are the least changed in 10% terms of their spending habits Below $75,000 $75,000 or More and future intentions. HHI HHI ◊ It is likely that their relative Women Men indifference springs from their life stage – more younger, single people with limited Percent in Each Age Group Percent in Each Geographic Region disposable income at the 39% moment. 25% 24% 35% 23% 23% ◊ Apathetic Materialists will be an attractive target for youth- 25% 23% 21% oriented marketers. 20% 14% 15% 11% 10% 5% 15% 21-29 30-39 40-49 50-59 60-70 Northeast Midwest South West Age Region 9
  • 10. Trading Down and Seeking Deals ◊ Steadfast Frugalists not only Buying on Sale or Using Coupons and Discounts engage in coupon-clipping and deal-seeking behaviors with 87% Steadfast Frugalists greater frequency but also do 71% so with considerable enthusiasm. 37% Involuntary Penny-Pinchers 55% o 9 in 10 find buying on sale or using coupons and discounts to 34% Pragmatic Spenders be satisfying. 20% % Who Find this Behavior Satisfying ◊ Involuntary Penny-Pinchers, 11% % Who Always Practice this Behavior forced to adopt frugality, shop Apathetic Materialists 12% for discounts and buy store labels quite extensively, but not 0% 20% 40% 60% 80% many of them get pleasure from these activities. Buying Store or Generic Brands o Less than 1 in 5 find buying store or generic labels to be satisfying. 59% Steadfast Frugalists 53% ◊ Pragmatic Spenders and Apathetic Materialists, perhaps 17% Involuntary Penny-Pinchers 56% motivated by different factors, get the least satisfaction from 15% Pragmatic Spenders trading down and clipping 8% coupons. 6% Apathetic Materialists 7% 0% 20% 40% 60% 10
  • 11. Trading Down and Seeking Deals Income, Gender and Age Differences ◊ As the charts on the right Buying on Sale or Using Coupons and Discounts clearly indicate, gender is a 60% % Who Find this Behavior Satisfying % Who Always Practice this Behavior 54% significant determinant of 53% satisfaction associated with 55% 50% deal-seeking behaviors. 42% 43% 42% 40% o More than half of 40+ women 40% 44% find buying on sale or using 38% 40% 30% coupons/discounts to be satisfying. 30% 24% 34% o Younger males (below 30) 26% 24% 26% irrespective of income and 20% older males with HHI >$75,000 <75K, <75K, <$75K, <$75K, >75K, >75K, >$75K, >$75K, are the least prone to buy on Males, 21- Males, 40+ Females, Females, Males, 21- Males, 40+ Females, Females, sales promotions. 39 21-39 40+ 39 21-39 40+ ◊ Trading down to store or generic labels, while practiced Buying Store or Generic Brands 50% with greater frequency in the 41% below $75,000 households, is a 37% 38% less satisfying experience 40% generally across all eight 27% groups. 30% 30% 22% 22% o Women in the below $75,000 28% 19% 20% 16% HHI bracket find greater 22% 22% satisfaction from buying store 18% 15% 10% 16% 11% or generic brands. <75K, <75K, <$75K, <$75K, >75K, >75K, >$75K, >$75K, Males, 21- Males, 40+ Females, Females, Males, 21- Males, 40+ Females, Females, 39 21-39 40+ 39 21-39 40+ Below $75,000 $75,000 or Above Household Income Household Income 11
  • 12. Pre-Purchase Deliberations ◊ Steadfast Frugalists are meticulous in their pre- Comparing Prices Before Purchase purchase activities, seeking and processing more product and 85% price information, and arriving Steadfast Frugalists 78% at purchase decisions after careful deliberations. Involuntary Penny-Pinchers 32% 60% o Three-quarter of SFs always compare prices and half are Pragmatic Spenders 26% % Who Find this Behavior Satisfying taking a longer time to 23% % Who Always Practice this Behavior evaluate and decide Apathetic Materialists 6% purchases. 7% o Given these proclivities, this group will be the most averse 0% 20% 40% 60% 80% to impulse buying. Taking a Longer Time to Evaluate and Decide Purchase ◊ Involuntary Penny-Pinchers, while being more rational in their purchase processes, do Steadfast Frugalists 64% not derive much satisfaction 52% from them. 15% ◊ Pragmatic Spenders and Involuntary Penny-Pinchers 47% Apathetic Materialists do not exert too much effort in pre- 12% % Who Find this Behavior Satisfying Pragmatic Spenders purchase deliberations, thus 5% % Who Always Practice this Behavior providing greater opportunities 4% to marketers. Apathetic Materialists 9% 0% 20% 40% 60% 80% 12
  • 13. Pre-Purchase Deliberations Income, Gender and Age Differences ◊ There is a negative correlation Comparing Prices Before Purchase between income and pre- purchase deliberations. % Who Find this Behavior Satisfying % Who Always Practice this Behavior 50% 49% ◊ Households with less than 48% 47% 45% 46% $75,000 (except men below 30) are comparing prices and 40% 41% taking a longer time to evaluate 38% 37% 38% 38% 35% 36% with greater frequency than 32% households with HHI more than 30% 29% 29% 29% $75,000. 25% 24% ◊ Nearly half the 40+ women with 22% HHI <$75,000 say they find the 20% experience of comparing <75K, <75K, <$75K, <$75K, >75K, >75K, >$75K, >$75K, prices to be rewarding. Males, 21- Males, 40+ Females, Females, Males, 21- Males, 40+ Females, Females, 39 21-39 40+ 39 21-39 40+ ◊ Women with HHI less than $75,000 are more deliberative Taking a Long Time to Evaluate and Decide Purchases 40% in their purchase process. 36% 35% 33% 30% 27% 27% 27% 26% 25% 24% 25% 22% 22% 20% 20% 19% 18% 15% 14% 12%11% 10% <75K, <75K, <$75K, <$75K, >75K, >75K, >$75K, >$75K, Males, 21- Males, 40+ Females, Females, Males, 21- Males, 40+ Females, Females, 39 21-39 40+ 39 21-39 40+ Below $75,000 $75,000 or Above Household Income Household Income 13
  • 14. Self-Efficacy (Confidence in Practicing Restraint) ◊ What makes this research Percent Who are Highly Confident Percent Who are Highly Confident particularly unique is the in in Resisting the Temptation to Spend examination of consumers’ self- Controlling Spending Now and Worry Later efficacy in practicing spending 100% 87% 100% 87% restraint. (There is ample established research to show that 80% 69% 80% 73% individuals high in self-efficacy are more successful in 60% 60% 46% 42% implementing desired 40% 40% behaviors.) 20% 20% ◊ Self-efficacy is the belief in 4% 5% one’s abilities to successfully 0% 0% achieve certain outcomes. Percent Who are Highly Confident Percent Who are Highly Confident ◊ It is evident from the charts on in in Sticking to Budget this page that Steadfast Saving Money Frugalists and Pragmatic 100% Spenders are the most 80% 70% 82% 80% confident in controlling 60% 52% 59% spending, resisting the 60% temptation to spend now and 40% 34% worry later, save money and stick 40% to a budget. 18% 20% 20% ◊ Apathetic Materialists have the 5% 4% least confidence in successfully 0% 0% restraining themselves. Apathetic Materialists Involuntary Penny-Pinchers Pragmatic Spenders Steadfast Frugalists 14
  • 15. Self-Efficacy (Confidence in Practicing Restraint) Income, Gender and Age Differences ◊ Age is positively correlated Percent Who are Highly Confident in Controlling Spending with self-efficacy in controlling 70% spending. 65% 60% 61% ◊ Both men and women 40 years 60% 57% 58% or older, irrespective of income, 55% are significantly more confident 50% 47% about restraining spending. 43% 45% 42% ◊ 40+ women with greater 40% 37% disposable income are the most 35% confident about resisting the 30% temptation to spend now and >$75K, <$75K, <75K, >75K, <75K, <$75K, >75K, >$75K, worry later, indicating they are Females, Females, Males, 21- Males, 21- Males, 40+ Females, Males, 40+ Females, more long-term focused. 21-39 21-39 39 39 40+ 40+ o This finding is not good news for marketers whose traditional Percent Who are Highly Confident in Resisting the Temptation to Spend audience are mainly boomer 80% Now and Worry Later women. 72% 70% 66% 67% 63% 60% 50% 41% 41% 43% 40% 37% 30% <75K, <$75K, >75K, >$75K, <$75K, >75K, <75K, >$75K, Males, 21- Females, Males, 21- Females, Females, Males, 40+ Males, 40+ Females, 39 21-39 39 21-39 40+ 40+ Below 40 Years 40 Years or Older 15
  • 16. Appreciating Thrift ◊ As is common knowledge now, “This recession has made me appreciate the simple things in the Great Recession has 80% life.” 77% induced new attitudes towards thrift. 60% ◊ What is most interesting is the 60% variation in the internalization 45% of the recession experience 40% across the four segments we 31% have identified. 20% ◊ The intensity of the new Apathetic Pragmatic Involuntary Steadfast realization increases linearly Materialists Spenders Penny-Pinchers Frugalists from Apathetic Materialists to Steadfast Frugalists, with Pragmatic Spenders and Involuntary Penny-Pinchers in “I have begun to appreciate the benefits of thrifty living as a between. result of my experience during this recession.” ◊ Steadfast Frugalists are the most appreciative of what the 68% 70% recession has taught them: simplicity and thrifty living. 48% 50% 37% 30% 20% 10% Apathetic Pragmatic Involuntary Steadfast Materialists Spenders Penny-Pinchers Frugalists Percent who agree or strongly agree 16
  • 17. Appreciating Thrift Income and Gender Differences ◊ The recession experience has “This recession has made me appreciate the simple things in led to greater appreciation of life.” thrifty living among women with HHI less than $75,000. 60% 58% ◊ More than half in this group say 55% 52% they appreciate the simple things in life and the benefits of 50% 49% 49% thrifty living. 45% 40% Males with HHI Females with HHI Males with HHI Females with HHI <$75,000 <$75,000 >$75,000 >$75,000 “I have begun to appreciate the benefits of thrifty living as a result of my experience during this recession.” 60% 55% 51% 50% 45% 42% 41% 40% 35% 35% 30% Males with HHI Females with HHI Males with HHI Females with HHI <$75,000 <$75,000 >$75,000 >$75,000 17
  • 18. Permanent Change in Buying Behavior? ◊ When asked whether the “This recession has changed what and how I buy forever.” recession has permanently altered buying behavior, the strongest feelings were 70% expressed by Steadfast 52% 55% Frugalists and Involuntary 50% Penny-Pinchers. 28% o More than half in these two 30% 21% groups agreed or strongly agreed with this statement. 10% ◊ In terms of actions taken to Apathetic Pragmatic Spenders Involuntary Penny- Steadfast Frugalists control spending habits, two- Materialists Pinchers third of Pragmatic Spenders said they are already doing something about it. This is “I am not just thinking about controlling my spending habits, I compellingly evident from a am already doing something about it.” variety of data. 88% 79% 80% 67% 60% 40% 34% 20% Apathetic Pragmatic Spenders Involuntary Penny- Steadfast Frugalists Materialists Pinchers 18
  • 19. Permanent Change in Buying Behavior? Income and Gender Differences ◊ Once again, income is “This recession has changed what and how I buy forever.” positively correlated with the degree of (stated) change in buying habits. 50% o 4 in 10 of both men and women 41% 42% with less than $75,000 HHI feel 40% the recession has changed 34% what and how they buy 31% forever. 30% ◊ In terms of putting the new attitudes into action, more 20% women (70%), irrespective of Males with HHI Females with HHI Males with HHI Females with HHI income level, profess to be <$75,000 <$75,000 >$75,000 >$75,000 doing something about controlling spending habits. “I am not just thinking about controlling my spending habits, I am already doing something about it.” 80% 70% 70% 70% 66% 61% 60% 50% Males with HHI Females with HHI Males with HHI Females with HHI <$75,000 <$75,000 >$75,000 >$75,000 19
  • 20. Price Dominance and Diminished Brand Equity ◊ As marketers know too well, “I am the kind who first looks at price before I consider other price has become the dominant features.” consideration in the purchase of all kinds of products. 70% 66% ◊ What is of considerable 60% 52% significance is the fact that half 50% of Pragmatic Spenders are 40% looking at price before other 27% features and one-third say that 30% brand name products are not 20% 14% worth the extra price, heralding 10% what will likely be a long uphill 0% struggle by marketers to shift Apathetic Pragmatic Spenders Involuntary Penny- Steadfast Frugalists the focus away from price. Materialists Pinchers ◊ These new beliefs will continue to diminish the effects of brand “I have come to realize that brand name products are not worth communications by marketers. the extra price.” ◊ As is clear from the charts, 60% Involuntary Penny-Pinchers 49% 50% followed by Apathetic Materialists are the least price 40% 32% sensitive, but this may be little 30% consolation to consumer 20% 16% marketing firms. 10% 4% 0% Apathetic Pragmatic Spenders Involuntary Penny- Steadfast Frugalists Materialists Pinchers 20
  • 21. Price Dominance and Diminished Brand Equity Income and Gender Differences ◊ Women below $75,000 HHI are “I am the kind who first looks at price before I consider other the most price sensitive, with features.” half of them saying that they look at price before other 60% 53% features. 50% ◊ Men above $75,000 HHI do not 37% pay as much attention to price 40% 33% and are more brand-conscious 30% than other groups. 21% 20% 10% Males with HHI Females with HHI Males with HHI Females with HHI <$75,000 <$75,000 >$75,000 >$75,000 “I have come to realize that brand name products are not worth the extra price.” 40% 30% 30% 24% 22% 20% 14% 10% Males with HHI Females with HHI Males with HHI Females with HHI <$75,000 <$75,000 >$75,000 >$75,000 21
  • 22. Decline in Hedonic Shopping ◊ This research also examined changes in materialism, Getting a Lot of Pleasure from Buying Things compulsive buying and impulse 80% buying. * ◊ Overall, all four segments confess to getting less pleasure 70% 70% 69% from buying things now compared to the time before the recession. Also, what is 60% more telling is that fewer 58% anticipate this to be true one 55% year from now. 50% ◊ Apathetic Materialists continue to derive the most gratification 45% 45% from buying, but even this 43% 40% 39% group of consumers has shown 38% a declining interest in 35% materialistic consumption. 30% ◊ The steepest decline in hedonic shopping has been for 25% 25% Involuntary Penny-Pinchers. 20% True Before 2008 Has Been True Since Expect to be True One *The full report has more data based 2008 Year from Now on multiple measures of materialism, compulsive consumption and impulse Apathetic Materialists Involuntary Penny-Pinchers buying. Pragmatic Spenders Steadfast Frugalists 22
  • 23. Decline in Hedonic Shopping Income and Gender Differences ◊ Pleasure from buying has Getting A Lot of Pleasure from Buying Things dropped significantly for all 70% four income-gender groups. ◊ The greatest decline has been for women with HHI below $75,000. 61% 60% 59% 57% 50% 49% 49% 49% 48% 46% 44% 40% 39% 34% 32% 30% True Before 2008 Has Been True Since Expect to be True One 2008 Year from Now Males with HHI <$75,000 Males with HHI >$75,000 Females with HHI <$75,000 Females with HHI >$75,000 23
  • 24. Decline in Impulse Buying ◊ The drop in impulse buying is Buying on Impulse quite stark for all segments, particularly for Involuntary 70% Penny-Pinchers. 64% ◊ Apathetic Materialists continue 60% to be the most impulsive in their 61% purchases, with 40% saying they expect to buy on impulse 50% even one year from now. 49% 46% 46% ◊ Steadfast Frugalists, while not 40% that spontaneous to begin with, 40% have become even less so. 30% 30% 25% 25% 25% 20% 24% 18% 10% True Before 2008 Has Been True Since Expect to be True One 2008 Year from Now Apathetic Materialists Involuntary Penny-Pinchers Pragmatic Spenders Steadfast Frugalists 24
  • 25. Decline in Impulse Buying Income and Gender Differences ◊ It is striking that the pattern of 70% Buying on Impulse change in impulse buying is uniform across all income-age groups. 59% 60% 56% 56% 50% 51% 40% 35% 33% 32% 30% 30% 32% 27% 28% 20% 21% 10% True Before 2008 Has Been True Since Expect to be True One 2008 Year from Now Males with HHI <$75,000 Males with HHI >$75,000 Females with HHI <$75,000 Females with HHI >$75,000 25
  • 26. Psychological Effects from the Recession ◊ A fact that is clearly evident is 100% 100% Depressed Scared the psychological toll the recession has taken on many 77% 80% 80% Americans. However, what is 66% often overlooked are the 61% 58% 60% 57% 60% 55% 55% 60% 56% differences in the effects among 48% 46% various segments/groups. 40% 43% 38% 37% ◊ Among the four segments in our 40% 40% study, the Involuntary Penny- 25% Pinchers are enduring the 20% 20% greatest psychological distress. Frequently Felt Feel Depressed About Frequently Felt Feel Scared About the Depressed in the Last the Future Scared in the Last Future o 77% are “scared” and 87% are One Year One Year “worried” about their future. o This is not that much of a Stressed Worried surprise given the financial 100% 100% 87% burdens imposed on them due 81% 81% 81%80% to the recession. 54% of 80% 74% 80% 70% 70% 72% Involuntary Penny-Pinchers 69% 68%66% 64% experienced a loss of 10% or 59% 61% more in their income in the last 60% 53% 60% one year. ◊ On a relative basis, the 40% 40% Apathetic Materialists seem to have been the least affected 20% 20% emotionally. Frequently Felt Feel Stressed About Frequently Felt Feel Worried About The full report has data on 19 emotions – Stressed in the Last the Future Worried in the Last the Future One Year One Year both positive and negative. Apathetic Materialists Involuntary Penny-Pinchers Pragmatic Spenders Steadfast Frugalists 26
  • 27. Psychological Effects from the Recession Income and Gender Differences ◊ By now it should be apparent Depressed Scared that the demographic group that has been the most severely affected and the most 80% 80% 68% fundamentally altered is women 64% with HHI less than $75,000. 59% 59% 60% 60% 52% 54% 50% 50% 50% o The charts to the right provide 45% further evidence as to why this 40%39% 39% 40% is so. 40% 33% 40% 30% ◊ There is a strong correlation between the level of 20% 20% psychological distress and the Frequently Felt Feel Depressed About Frequently Felt Feel Scared About the new attitudes and behaviors Depressed in the Last the Future Scared in the Last One Future One Year Year adopted by consumers to cope with the effects of the recession. Worried Stressed 79% 79% 81% 80% 73% 80% 72% 75% 70% 71% 67% 67%65% 68% 64% 65% 62% 58% 60% 60% 40% 40% 20% 20% Frequently Felt Feel Stressed About Frequently Felt Feel Worried About Stressed in the Last the Future Worried in the Last the Future One Year One Year Males with HHI <$75,000 Males with HHI >$75,000 Females with HHI <$75,000 Females with HHI >$75,000 27
  • 28. What is in the Full Report? ◊ The full report, available for a fee, contains many more details, including data and analysis of the following topics. For more information, please contact val@decitica.com. 1. 18 attitudes dealing with the effects of the recession 2. Frequency of 29 behaviors practiced to cope with the recession 3. Satisfaction associated with 29 behaviors practiced to cope with the recession 4. Self-efficacy (i.e., self-confidence) associated with 15 spending and consumption restraint behaviors 5. Recession’s effects on consumers’ emotional state (i.e., 19 different emotions) 6. 15 measures of materialism, compulsive and impulsive buying 7. 10 measures of consumers’ thinking styles 8. 5 measures of maximizing-satisficing approach in buyer behavior 9. Changing role of price in purchase decisions, value-orientation, brand effects, pre-purchase activities, etc. 10. Expectations of future income 11. Detailed data on saving behaviors 12. Unique data on household budgeting practices 13. Triggers for increasing spending ◊ Analyses of the above data are available for each of the segments identified in this study and also for a variety of demographic groups based on gender, income level and age group. ◊ Custom statistical analysis and interpretation also provided for an additional fee. 28
  • 29. Decitica Decitica is a marketing strategy and research firm. We specialize in discovering new insights into evolving market structures and customer behaviors. Our toolkit relies on traditional market research techniques and new approaches based on digital technologies and social media. Decitica was founded with a simple goal in mind: to help marketing executives with truly excellent and compelling perspectives and advice on how best to market, engage and collaborate with customers. Dr. Val Srinivas is the Principal of Decitica with over 15 years of experience. Before establishing Decitica, he was Head of Marketing Strategy in the institutional advisory group at Morgan Stanley Investment Management. Prior to this, he led the global Market Research and Competitive Intelligence function at Standard & Poor’s for nine years. Val has conducted hundreds of studies covering brand equity, new product design, customer loyalty and satisfaction, segmentation, pricing, demand analysis and competitive analysis. He also served as an Adjunct Professor of Marketing at Rutgers Business School, where he received a Ph.D. in Marketing. Val's doctoral thesis was on marketing financial advice and investors' advice-seeking behavior. Val can be reached at val@decitica.com. 29