
Recommandé
Contenu connexe
Similaire à 26 cc 1_c_a-watkinson
Similaire à 26 cc 1_c_a-watkinson (20)
Plus de Society for Scholarly Publishing
Plus de Society for Scholarly Publishing (20)
26 cc 1_c_a-watkinson
- 1. The University for business and the professions Digital journal use: ‘big deals’, choice, consumer behaviour and the like David Nicholas, Paul Huntington, Anthony Watkinson and Ian Rowlands Centre for Information Behaviour and the Evaluation of Research http://www.soi.city.ac.uk/organisation/is/resea rch/ciber/
- 2. The University for business and the professions Background • Obtained lots of experience researching the behaviour of large numbers of digital information consumers in media and health fields (1999-2003). Mapping and interpreting first footfalls of digital information consumer using logs. Logs first questions second. No leading, no baggage, kind of data policy makers should/could work with • Found that when we peered through the digital information fog we saw a highly patterned behaviour…but not always an expected one
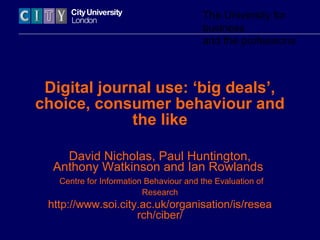
- 3. The University for business and the professions Digital heart beat of The Times user The Times 260000 240000 220000 200000 180000 160000 140000 120000 100000 80000 March April May June
- 4. The University for business and the professions Background (continued) • Found huge digital choice has led to promiscuous world, inhabited by ‘bouncers’, ‘checkers’ • ‘Characteristic behaviour found was one of bouncing in which users seldom penetrate a site to any depth, tend to visit a number of sites for any given information need and seldom return to sites they once visited. Tend to ‘feed’ for information horizontally, and whether they search a site of not depends heavily on ‘digital visibility’, which in turn creates ‘bouncing’
- 5. The University for business and the professions And on to serials... • Brought this methodological experience and consumer viewpoint, courtesy of a grant from Ingenta Institute, to scholarly journal field. We were warned off! • Came in to research the big deal and its impact, but big deals are all about choice and came away with a lot more…which I will tell you all about
- 6. The University for business and the professions Case studies • Started with Emerald to pilot; next Blackwell for comparison. Emerald: Business/Management and Information studies (www.emeraldinsight.com) • Around 125 journals; 44,000 abs - 35,000 (full text) Archive for most journals goes back to 1994 • Data presented just first part/pilot of ongoing study - will ‘triangulate log data, but plenty of
- 7. The University for business and the professions Emerald Big Deal and user types • Anybody can access database but level of access varies • Can distinguish between four kinds of user: – non-subscriber (bibliographic rights/credit card); – trialists (five downloads in month); – non-Big Deal subscriber (1-6 journals typically); – Big Deal subscriber (125 journals in a database format) • First big shock….
- 8. The University for business and the professions Digital library users by user type (%) 60 56 50 Percentage 40 35 30 20 10 7 0 Non subscriber No deal subscriber Trialist Deal subscriber User types
- 9. The University for business and the professions Differences in information seeking
- 10. The University for business and the professions Type of user by organisation ‘affiliation’ of user 100 6 8 90 80 37 70 60 71 (%) 50 17 79 40 Other Non profit org 30 Net provider 20 41 Government 10 20 Academic 11 0 Commercial Non subscribers No deal Deal subscribers subscribers
- 11. The University for business and the professions Type of request by type of user (%) 100 5 5 8 90 14 26 17 16 80 70 30 28 27 60 29 50 40 7 30 50 49 51 Issue 20 38 Jrnl content 10 Article Abstract 0 Non Trialist No deal Deal subscriber subscriber subscriber
- 12. The University for business and the professions Ave no of requests in session by type of user 100 90 13 17 17 22 80 18 17 70 19 60 (% ) 50 37 Request in 82 33 43 session 40 30 Over 21 20 11 to 20 25 22 29 10 4 to 10 1 to 3 0 Non Trialist No deal Deal subscribers subscribers subscribers
- 13. The University for business and the professions Number of visits (in month) by type of user 100 90 19 18 26 80 70 60 (%) 50 96 40 80 81 72 30 No. of visits 20 6 to 15 2 to 5 10 Once 0 Non Trialist No deal Deal subscribers subscribers subscribers
- 14. The University for business and the professions Number of subjects viewed by type of user 100 9 7 16 13 90 17 80 25 70 25 17 60 19 (%) 50 18 89 No. subjects 40 viewed 30 58 Over 5 20 42 44 3 to 5 Two 10 One 0 Non subscribers Trialist No deal Deal subscribers subscribers
- 15. The University for business and the professions No. of different journals viewed by user type 100 4 7 90 12 14 20 80 23 70 32 60 39 No. of 36 (% ) 50 journals 86 viewed 40 30 Over 15 50 20 6 to 15 34 37 2 to 5 10 One 0 Non subscribers Trialist No deal Deal subscribers subscribers
- 16. The University for business and the professions No. of different journals (downloads) by type of user 100 5 7 13 90 17 80 25 31 70 38 60 50 (%) No.journals 82 viewed 40 69 Over 15 30 60 47 5 to 15 20 2 to 5 10 One 0 Non subscribers Trialist No deal Deal subscribers subscribers
- 17. The University for business and the professions Consumer traits • We have seen how trialists make the most of the opportunity. There is another example: • Journal of Week…. • Two measures that drive information seeking
- 18. The University for business and the professions Impact of free week on Employee Relations & International Jnl of Public Sector Management 14000 12000 10000 8000 6000 4000 Employee 2000 Relations Int Jrnl of Public 0 Sector Management 01.06.2002 08.06.2002 15.06.2002 22.06.2002 29.06.2002
- 19. The University for business and the professions Article ‘view’ time: for journal of week in offer week, out of offer week and for non-offer journals Non offer Offer Offer journals journal journals in in non-offer Articles offer weeks weeks 126.0 46.0 103.7
- 20. The University for business and the professions More observations on digital journal user
- 21. The University for business and the professions Volatility in use 2001/2 to 2002/3 Movement % change Increase More than 100% 11 + 75-99% 2 + 50-74% 3 + 25-49% 16 + 1-24% 29 Decrease - 1-24% 24 - 25-49% 10 - 50-74% 3 - 75-99% 1 Average 17
- 22. The University for business and the professions Journal impact (use) factor Number of recent downloads (numerator) Number of downloads during 2002 to (e.g.) Aslib Proceedings articles published in the previous two years, 2000-2001. e.g. 2000 + 2001 = 192 Number of recent publications (denominator) Articles published in Aslib Proceedings during 2000 and 2001. e.g. 2000 + 2001 = 75 Use factor calculation JIF02 = 192/75 = 2.56
- 23. The University for business and the professions Quality & popularity metrics Total Article D'loads in 2002 of No. of articles ISI Impact Journal title articles published in 2001/2000 published in 2001/200 JIF 2002 Factor 2001 International Marketing Review 46,709 62 753.371 0.189 International Journal of Service Industry Management 29,864 51 585.569 0.185 Internet Research: Electronic Networking 41,903 77 544.195 0.782 Personnel Review 39,781 74 537.581 0.206 Journal of Organizational Change Management 31,323 71 441.169 0.250 Industrial Management and Data Systems 38,991 97 401.969 0.221 International Journal of Operations Production Management 62,233 157 396.389 0.638 International Journal of Manpower 21,436 73 293.644 0.149 Policing 7,559 61 123.918 0.053 Aslib Proceedings 4,447 79 56.291 0.453 Anti-Corrosion Methods and Materials 1,625 60 27.083 0.129 International Journal of Numerical Methods for Heat and Fluid Flow 1,783 88 20.261 0.634 COMPEL 2,097 112 18.723 0.188
- 24. The University for business and the professions Obsolescence/decay Management journals decay in use (downloads) over time 2003 January : Base date Title Cumulative percentage 2002 2001 2000 1999 1998 1997 1996 1995 1994 Management Decision* 33.5 48.3 59.4 67.7 76.3 83.4 89 94.1 100 Journal of Consumer 28.7 45.1 58.7 69.2 80.3 85.7 90.8 96.7 100 Marketing International Journal of 15.7 30.2 44.2 56.2 67.8 77.1 85.7 96.3 100 Contemporary Hospitality Management International Journal of 22.2 37.2 48.2 57.9 66.5 74.6 85.2 93.7 100 Operations Production Management Personnel Review 23.4 40.2 54.8 63.4 72.4 78.2 86.2 93.5 100 Journal of Product and 21.5 36.1 47.6 58.2 71.9 81.8 86.3 94.8 100 Brand Management Journal of Services 33.2 46.1 61.4 71.6 80.9 86.5 91.7 95.6 100 Marketing Average 25.7 40.7 52.9 63.0 72.9 80.3 87.4 94.0 100
- 25. The University for business and the professions Conclusions • Big deal traits, they: – view more journals (except trialists) – view more subjects (except for trialists) – are not so busy online as trialists – revisit more often than non-subscribers, but trialists revisit most frequently – don’t appear to search any further back in time – but download from more journals But the real interest lies with the trialists, the end-user checkers; and whether further Emerald data and the Blackwell data confirms all this
Notes de l'éditeur
- Working with the DoH an evaluating the roll-out of digital health to the consumer Lots of dodgy qualitative data around: Extract from recent research report: ‘ Priority research methods The social sciences respondents follow a similar pattern of research discovery and access methods as their scientific colleagues; the following priority list includes percentage of respondents who regard each method as essential in parenthesis: consulting books and journals (93%) searching catalogues (75%) In future, 31% expect to do more searching of online and card catalogues’
- The picture that set us on the road: when millions of people do something, they actually do it together. Daily page impressions for Times over four months (check). Need visualisation in digital environment, and big panoramas
- Some people I know threw up at the mention of the term digital information consumer; this is a world of little change…we know our customers...
- 1. Wanted an academic v practitioner; science v social science comparison 2. Cldnt believe it: Incredibly open, innovative, consumer orientated shop, all kinds of deals, sales ideas etc. The site seemed to be ahead of the game 2. Reminds me of a departmental store, with lots of things in window (all of which you can buy - but lots of ways of paying) and lots of tempting offers to get you hooked. Lots of different financial models of paying for journals. 4. Largely one month’s of data supplemented with some longer term analysis; logs raising all kinds of questions which need to be followed up in qualitative research 4. Without giving the whole lecture away, we saw lots of things we had seen elsewhere, academics are not that different, although they are treated as they are
- Big Deal subscribers are let into a different shop (a supermarket/department store), rather than a more limited environment (a small corner-shop). The corner shop plays a useful role, but it cannot deliver Value For Money, wide choice, and an environment in which you can keep searching for what you are looking for, or the opportunity to encounter nice surprises
- Clearly non-subscribers are the biggest group of users - quite a shock that so many people are hovering around in the digital journal shop. Who are these guys - students, foreign users, voyeurs, bouncers Lets bring in volume of use into the equation. Non-subscribers: made up 56% of all users but accounted for 17% of use; Majority of users, minority of use Triallists: 7% of users but accounted for 22% of use. Make hay when the sun shines group. Deal subscribers made up 35% of all users and accounted for majority ( 57%) of use. Nearly two thirds fed off bibliographic data - wonder whether this is a case of horizontal feeding, also bouncing - abstracts are wonderful for bouncing, checking
- Non-deal subscribers more likely to be non-academic organisations and come via net-providers (small companies and home users?); non-deal subscribers most likely to be academic in terms of downloads there are only one type of users - academics
- Non-subscribers are hunters/seekers/explorers - 55% of requests to look at TOCs; they are uncertain and unfamiliar and this shows - navigators Deal subscribers make most of their access to full-text, and use TOCs least Alternatively subscribers may well use the search facility, regular users are more likely to have invested the time in learning how to use the search facility as this provides a quicker way to find articles. Not really much difference between deal and non-deal
- Shows how active or busy (or confused) they were when online. Non-subscribers least active: over 80% made 3 or fewer requests in a session. The fact that their downloads hands are tied partly explains this. It might also be in part due to the fact that they are not so practised in moving around the site. Some would have landed at the site, visited a couple of pages to see what was there and left . They are the bouncers. Triallists most active users of the site and are making full, furious and fast use of their temporary access. Sale mentality. Let people think they are getting something for nothing Deal subscribers were only marginally busier than non-deal subscribers . So greater choice does not manifest itself in greater levels of activity here.
- Another busyness metric. Might think if you have comprehensive access you might visit more. Not true really. Triallists revisit most. Not much difference between the two groups of subscribers. What does it say about current awareness? Data limited to one month However, non-subscribers are less likely to revisit - only 7% did so; bouncers.
- More than 20 subjects to choose from Non-subscribers looked at the fewest subjects: 89% viewed just one triallists viewed most - shopping around; 16% visited more than five times in that month; trialling works Deal subscribers viewed more subjects than non-deal subscribers, which seems to be a manifestation of choice.
- Big deals all about increasing user choice and a`quarter of Big deal users viewed more than six jnls in a session - interested to compare that with hard-copy days (has to be less) Non-subscribers viewed smallest number triallists true to their name view most - 30% viewed more than 6 Say at this point that use by non Subscribers most probable reflects "home users" accessing via popular ISP providers like Btinternet, AOL and the like hence the high "commercial" and "Net Provider" use.
- Just viewing articles/downloads Easy access to full-text shows, with 53% downloading more than one article in a session. This is what big deals are all about Interesting to know how many did not download one
- Went free 05
- Based upon downloads in the periods: August 2001/January 2002 and August 2002/January 2003 by 91 universities. Huge see-sawing. Majority of increases/decreases 25% and over. Is this volatility a result of digital choice, promiscuous behaviour? How to read the table: 11% of universities increased their downloads by more than a 100%
- 1 Now we have a new method of evaluating a journal’s performance we need a method for expressing it and comparing with traditional citation impact factors; 2 By replacing citations with downloads in the formula, you really do get a sense of readership, something we've never had before; 3 Citation impact factors are universal `truths' for a particular journal, our new use factor is system-specific: it tells about the use of articles on different platforms such as Ingenta, Science Direct. It would make a fascinating comparison to compare the uptake of the same journal on different platforms. And could indeed be used on non-electronic platforms (substitute downloads for inter-library requests, and you could come up with a Boston Spa lending factor). 4 We don't know whether citation and downloads, or citations and loan requests are related; we strongly suspect not on this prima facie evidence, besides why should the behaviour of readers coincide with the behaviour of authors? 5. On the evidence we have, we can say that citation impact factors are pretty stable, they go up and down, but only slowly and tend anyway not to move much outside statistical error. This is why Paul finds strong correlation between ISI impact factors for 2000 and 2001. This isn't surprising: the author pool is pretty static. 6 We would predict that, year-on-year, download and interlending factors will be very much more volatile (empowered digital consumer) and will swing all over the place - and we have seen signs of that. 7 Traditional impact factor is wholly inappropriate for someone like the BL. It summarises the votes of authors, not readers. Average article downloaded two and a half times
- Example. First column - raw downloads. International Jnl of Operations Product management scores highly. Third column the usage metric. Number of articles published in 2001 and 2002 divided by the number of downloads of these articles. International marketing review scores most highly. If we take impact factors then Internet Research scores most highly, and does well on JIF, but International Journal of Numerical methods does well on impact but not JIF. Plainly size of audience is a factor here.
- Have things changed? International Journal of Contemporary Hospitality decays more slowly and Journal of Services Marketing more rapidly. Management Decision was a journal of the week during data collecting time, and this cld account for high representation of first year. Adapting figures from Carol Tenopir and Don King the first two years account for about 82% of use. Here the figures are 41%. Could be subject, could be relative ease with which you can search an archive now. Maybe a quality metric - this is what we are looking for in this field?