Sampling Theory Homework Help

Statisticsassignmentexperts.com is an organisation committed to providing world class education solutions in the subject of Statistics to students across the globe. We specialise in offering a multitude of educational services to students for Statistics, who are studying in various institutes and universities, be it assignments, online tutoring, project work, dissertation/thesis, or exam preparation. When it comes to information and communication technologies, we employ state-of-the-art and latest tools and technology to connect with students and expert tutors. Students from various countries including the USA, UK, Canada, UAE and Australia have used our services for the past several years to achieve excellence in their academic and professional pursuits. Statisticsassignmentexperts.com works closely with its strong and dynamic team of subject experts to create new models for exchange of information, in consonance with the changing needs of students as well as academic and professional programs.

Recommandé
Contenu connexe
Dernier
Dernier (20)
En vedette
En vedette (20)
Sampling Theory Homework Help
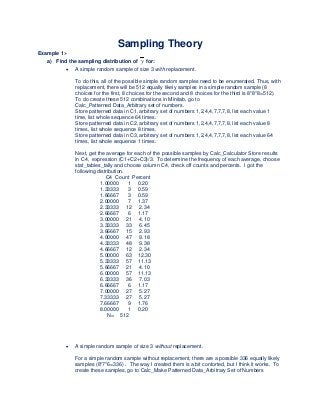
- 1. Sampling Theory Example 1:- a) Find the sampling distribution of y for: • A simple random sample of size 3 with replacement. To do this, all of the possible simple random samples need to be enumerated. Thus, with replacement, there will be 512 equally likely samples in a simple random sample (8 choices for the first, 8 choices for the second and 8 choices for the third is 8*8*8=512). To do create these 512 combinations in Minitab, go to Calc_Patterned Data_Arbitrary set of numbers. Store patterned data in C1, arbitrary set of numbers 1,2,4,4,7,7,7,8, list each value 1 time, list whole sequence 64 times. Store patterned data in C2, arbitrary set of numbers 1,2,4,4,7,7,7,8, list each value 8 times, list whole sequence 8 times. Store patterned data in C3, arbitrary set of numbers 1,2,4,4,7,7,7,8, list each value 64 times, list whole sequence 1 times. Next, get the average for each of the possible samples by Calc_Calculator Store results in C4, expression (C1+C2+C3)/3. To determine the frequency of each average, choose stat_tables_tally and choose column C4, check off counts and percents. I got the following distribution. C4 Count Percent 1.00000 1 0.20 1.33333 3 0.59 1.66667 3 0.59 2.00000 7 1.37 2.33333 12 2.34 2.66667 6 1.17 3.00000 21 4.10 3.33333 33 6.45 3.66667 15 2.93 4.00000 47 9.18 4.33333 48 9.38 4.66667 12 2.34 5.00000 63 12.30 5.33333 57 11.13 5.66667 21 4.10 6.00000 57 11.13 6.33333 36 7.03 6.66667 6 1.17 7.00000 27 5.27 7.33333 27 5.27 7.66667 9 1.76 8.00000 1 0.20 N= 512 • A simple random sample of size 3 without replacement. For a simple random sample without replacement, there are a possible 336 equally likely samples (8*7*6=336) . The way I created them is a bit contorted, but I think it works. To create these samples, go to Calc_Make Patterned Data_Arbitrary Set of Numbers
- 2. Store data pattern in C6, Arbitrary set of numbers 1 2 4 4 7 7 7 8, list each value 1 time, list whole sequence 42 times Store data pattern in C11, Arbitrary set of numbers 2 4 4 7 7 7 8, list each value 6 time, list whole sequence 1 times Store data pattern in C12, Arbitrary set of numbers 1 4 4 7 7 7 8, list each value 6 time, list whole sequence 1 times Store data pattern in C13, Arbitrary set of numbers 1 2 4 7 7 7 8, list each value 6 time, list whole sequence 2 times Store data pattern in C14, Arbitrary set of numbers 1 2 4 4 7 7 8, list each value 6 time, list whole sequence 3 times Store data pattern in C15, Arbitrary set of numbers 1 2 4 4 7 7 7, list each value 6 time, list whole sequence 1 times Manip_Stack_Stack Columns, Stack the following columns C11 C12 C13 C14 C15 in a column of the current worksheet C7. Store data pattern in C16, Arbitrary set of numbers 4 4 7 7 7 8, list each value 1 time, list whole sequence 1 times Store data pattern in C17, Arbitrary set of numbers 2 4 7 7 7 8, list each value 1 time, list whole sequence 2 times Store data pattern in C18, Arbitrary set of numbers 2 4 4 7 7 8, list each value 1 time, list whole sequence 3 times Store data pattern in C19, Arbitrary set of numbers 2 4 4 7 7 7, list each value 1 time, list whole sequence 1 times Store data pattern in C20, Arbitrary set of numbers 4 4 7 7 7 8, list each value 1 time, list whole sequence 1 times Store data pattern in C21, Arbitrary set of numbers 1 4 7 7 7 8, list each value 1 time, list whole sequence 2 times Store data pattern in C22, Arbitrary set of numbers 1 4 4 7 7 8, list each value 1 time, list whole sequence 3 times Store data pattern in C23, Arbitrary set of numbers 1 4 4 7 7 7, list each value 1 time, list whole sequence 1 times Store data pattern in C24, Arbitrary set of numbers 2 4 7 7 7 8, list each value 1 time, list whole sequence 1 times Store data pattern in C25, Arbitrary set of numbers 1 4 7 7 7 8, list each value 1 time, list whole sequence 1 times … and so on … Then stack the appopriate columns for the appropriate number of times. Let Calc_Calculator store result n variable C9, expression (C6+C7+C8)/3. Get the counts and percentages as computed above. C9 Count Percent 2.33333 12 3.57 3.00000 6 1.79 3.33333 24 7.14 3.66667 6 1.79 4.00000 36 10.71 4.33333 48 14.29 4.66667 12 3.57 5.00000 36 10.71
- 3. 5.33333 42 12.50 5.66667 18 5.36 6.00000 36 10.71 6.33333 36 10.71 7.00000 6 1.79 7.33333 18 5.36 N= 336 b) Is y unbiased for each of the two sampling schemes? Explain by using the information from your sampling distribution. The quantity of interest is (1+2+4+4+7+7+7+8)/8 = 5. Note that the way the samples were created, they are all equally likely. Thus, the expected values of each of the sampling schemes is just the average of the columns (C4 or C9). To get the average of the columns, calc_column statistics. Statistic mean, input variable (the column number). Doing this, I see that both of the columns have an average of 5. Thus, both of the sampling schemes are unbiased. c) Draw histograms. Graph_histogram variables C4 and C9. For plan I) 9876543210 140 120 100 80 60 40 20 0 C4 Frequency For plan ii)