SlideShare une entreprise Scribd logo
1  sur  23
Télécharger pour lire hors ligne
anymore*
Steve Outing (media futurist, digital-news innovator) • http://mediadisruptus.com • steveouting@gmail.com
* Now anyone can learn to love data
Data and data-visualizations are not boring
(last updated: November 3, 2014)
Steve Outing (media futurist, digital-news innovator) • http://mediadisruptus.com • steveouting@gmail.com
Should all journalists learn
data visualization, infographics skills?
Steve Outing (media futurist, digital-news innovator) • http://mediadisruptus.com • steveouting@gmail.com
No one can escape the massive
growth of data – especially journalists
Exponential growth in data
Social media data
Sensor data
Mobile-phone sensor data
Government data
Treasure trove of news and
story ideas for journalists
(much not possible in past)
News organizations hiring
more data editors
“Internet of Things” means
even more sensors!
Steve Outing (media futurist, digital-news innovator) • http://mediadisruptus.com • steveouting@gmail.com
Rate of growth in data is scary fast
But this presents
enormous opportunity
for journalists to
spot trends and
identify untold stories
Steve Outing (media futurist, digital-news innovator) • http://mediadisruptus.com • steveouting@gmail.com
Social media data is a big part of growth
(because we voluntarily share so much)
Tweets per day:
500 million
Source: Twitter
Source: Instagram
Source: Statistica
Facebook per day:
• likes per day: 4.5 billion
• items shared: 4.75 billion
• photos posted: 350 million
Instagram:
• photos per day: 58 million
• “likes” per day: 1.65 billion
Source: Facebook
Steve Outing (media futurist, digital-news innovator) • http://mediadisruptus.com • steveouting@gmail.com
Social media analysis tools
find insights in all that data
}The “Social Cocktail”
Steve Outing (media futurist, digital-news innovator) • http://mediadisruptus.com • steveouting@gmail.com
Much can be understood by
visualizing social-media data
Data in action: Ebola doctor’s
movements from his mobile phone
Steve Outing (media futurist, digital-news innovator) • http://mediadisruptus.com • steveouting@gmail.com
A data visualization can
tell the story all by itself
Steve Outing (media futurist, digital-news innovator) • http://mediadisruptus.com • steveouting@gmail.com
A data visualization can
tell the story mostly by itself
Trends
More and more data becoming accessible
(exponential growth)
Data analysis tools available for everyone
(You don’t need a degree in statistics)
Data visualization tools continue to be
easier to use and more powerful
Steve Outing (media futurist, digital-news innovator) • http://mediadisruptus.com • steveouting@gmail.com
Great tools … Not easy to master
More powerful,
capable
Static or interactive
or video …
But expensive
Takes time to learn
Steep learning curve
Perhaps too much
for a busy multi-
tasking journalist
Steve Outing (media futurist, digital-news innovator) • http://mediadisruptus.com • steveouting@gmail.com
More-powerful, easy-to-use tools are here:
Still need Excel and Adobe applications?
Client app: free trial … Or use Tableau Public for free … Embed visualizations on your site
Steve Outing (media futurist, digital-news innovator) • http://mediadisruptus.com • steveouting@gmail.com
Example of interactive data
visualization using Tableau
Many easier-to-use tools are now

not on desktop: Use them in the cloud
Steve Outing (media futurist, digital-news innovator) • http://mediadisruptus.com • steveouting@gmail.com
The problem when data visualization
tools are available for everyone
Steve Outing (media futurist, digital-news innovator) • http://mediadisruptus.com • steveouting@gmail.com
Pretty…
Nearly incomprehensible!!
Effective data visualization…
But a bit plain looking
Sources: Harvard Business Review, JunkCharts.com
But even if you’re not an expert,
you can learn the ropes
Bar Chart: As simple as you can get with data visualization
Steve Outing (media futurist, digital-news innovator) • http://mediadisruptus.com • steveouting@gmail.com
Flawed Much better!
No need to turn head to read type
What’s wrong with this map?
(So many things!)
Steve Outing (media futurist, digital-news innovator) • http://mediadisruptus.com • steveouting@gmail.com
via Alberto Cairo, University of Miami
This is much better
Steve Outing (media futurist, digital-news innovator) • http://mediadisruptus.com • steveouting@gmail.com
via Alberto Cairo, University of Miami
Please don’t use data to lie or
misrepresent the real story
Steve Outing (media futurist, digital-news innovator) • http://mediadisruptus.com • steveouting@gmail.com
via Alberto Cairo, University of Miami
Steve Outing (media futurist, digital-news innovator) • http://mediadisruptus.com • steveouting@gmail.com
A few data visualization tips
Not all big data is useful data … e.g., Twitter data may not help you
answer some questions, but will help on others
With social-media data, pick the best source(s) … Disqus comments or
Tumblr might be better fit for what you seek; combining sources in “social
cocktail” may yield best insight
Tell a story! … Dont’ just create charts; use data and visualizations as the
means to telling a story
Presentation: How much data, complexity does reader need? … Keep
it as simple as possible in visualization
Data: Attribute your sources; link to source data
Don’t let your numbers lie! … Proper chart form; 0 baseline; etc.
Choose the right chart type for your data … Here’s a handy guide
Design: Don’t clutter with useless illustration
Design follows data!
Design: Keep color blindness in mind … 8-10% males; <1% females
ProPublica Nerds Blog

http://www.propublica.org/nerds/

PP’s Tools and Style Guides

https://github.com/propublica/
The Guardian Data Blog

http://www.theguardian.com/news/datablog
Texas Tribune: The Data

http://www.texastribune.org/library/data/
Information Aesthetics

http://infosthetics.com
Chart Porn blog

http://chartporn.org
Book: “The Functional Art: An introduction to information
graphics and visualization” - by Alberto Cairo
Good news data-viz resources
Steve Outing (media futurist, digital-news innovator) • http://mediadisruptus.com • steveouting@gmail.com
Steve Outing
Media futurist, Digital-news innovator | steveouting@gmail.com
http://mediadisruptus.com
http://www.slideshare.net/steveouting1

Contenu connexe

Similaire à Data visualizations are not boring anymore! (updated)

Similaire à Data visualizations are not boring anymore! (updated) (20)

Data visualizations are not boring anymore!
Data visualizations are not boring anymore!Data visualizations are not boring anymore!
Data visualizations are not boring anymore!
 
Digital Tools for Journalism and Advertising - 2014
Digital Tools for Journalism and Advertising - 2014Digital Tools for Journalism and Advertising - 2014
Digital Tools for Journalism and Advertising - 2014
 
Digital tools for today’s and tomorrow’s journalists
Digital tools for today’s and tomorrow’s journalistsDigital tools for today’s and tomorrow’s journalists
Digital tools for today’s and tomorrow’s journalists
 
Digital tools for journalists (Sept. 2014 update)
Digital tools for journalists (Sept. 2014 update)Digital tools for journalists (Sept. 2014 update)
Digital tools for journalists (Sept. 2014 update)
 
Digital First Thinking and Working
Digital First Thinking and WorkingDigital First Thinking and Working
Digital First Thinking and Working
 
MBA-TU-Thailand:BigData for business startup.
MBA-TU-Thailand:BigData for business startup.MBA-TU-Thailand:BigData for business startup.
MBA-TU-Thailand:BigData for business startup.
 
Practical Opinion Mining for Social Media
Practical Opinion Mining for Social MediaPractical Opinion Mining for Social Media
Practical Opinion Mining for Social Media
 
Digital First Thinking and Working
Digital First Thinking and WorkingDigital First Thinking and Working
Digital First Thinking and Working
 
SuanIct-Bigdata desktop-final
SuanIct-Bigdata desktop-finalSuanIct-Bigdata desktop-final
SuanIct-Bigdata desktop-final
 
Data Visualization
Data Visualization Data Visualization
Data Visualization
 
Social Media on a (Time) Budget from 2010 WTPA Convention
Social Media on a (Time) Budget from 2010 WTPA ConventionSocial Media on a (Time) Budget from 2010 WTPA Convention
Social Media on a (Time) Budget from 2010 WTPA Convention
 
Big data Seminar/Presentation
Big data Seminar/PresentationBig data Seminar/Presentation
Big data Seminar/Presentation
 
Big Data, Data-Driven Decision Making and Statistics Towards Data-Informed Po...
Big Data, Data-Driven Decision Making and Statistics Towards Data-Informed Po...Big Data, Data-Driven Decision Making and Statistics Towards Data-Informed Po...
Big Data, Data-Driven Decision Making and Statistics Towards Data-Informed Po...
 
Analytics 3.0 Measurable business impact from analytics & big data
Analytics 3.0 Measurable business impact from analytics & big dataAnalytics 3.0 Measurable business impact from analytics & big data
Analytics 3.0 Measurable business impact from analytics & big data
 
Data and Journalism
Data and JournalismData and Journalism
Data and Journalism
 
MCAD 2009 - Future of Advertising: session #09 recap (March 23)
MCAD 2009 - Future of Advertising: session #09 recap (March 23)MCAD 2009 - Future of Advertising: session #09 recap (March 23)
MCAD 2009 - Future of Advertising: session #09 recap (March 23)
 
Big Data Projects, Small Newsroom
Big Data Projects, Small NewsroomBig Data Projects, Small Newsroom
Big Data Projects, Small Newsroom
 
Datenjournalismus - Entdecken - Erklären - Erkennen
Datenjournalismus - Entdecken - Erklären - ErkennenDatenjournalismus - Entdecken - Erklären - Erkennen
Datenjournalismus - Entdecken - Erklären - Erkennen
 
CapTech Talks--OSINT- Dr. Kellup Charles 10--6-22.pptx
CapTech Talks--OSINT- Dr. Kellup Charles 10--6-22.pptxCapTech Talks--OSINT- Dr. Kellup Charles 10--6-22.pptx
CapTech Talks--OSINT- Dr. Kellup Charles 10--6-22.pptx
 
Ear to the Geek Ground: tech trends for communicators 2012
Ear to the Geek Ground: tech trends for communicators 2012Ear to the Geek Ground: tech trends for communicators 2012
Ear to the Geek Ground: tech trends for communicators 2012
 

Plus de Steve Outing | MediaDisruptus

Plus de Steve Outing | MediaDisruptus (14)

Ethics considerations in digital journalism: Tiny cameras & social analytics
Ethics considerations in digital journalism: Tiny cameras & social analyticsEthics considerations in digital journalism: Tiny cameras & social analytics
Ethics considerations in digital journalism: Tiny cameras & social analytics
 
The Media Futures Project
The Media Futures ProjectThe Media Futures Project
The Media Futures Project
 
Drones for journalism
Drones for journalismDrones for journalism
Drones for journalism
 
Data visualization 2
Data visualization 2Data visualization 2
Data visualization 2
 
Data visualization 1
Data visualization 1Data visualization 1
Data visualization 1
 
TKclass: New photographers
TKclass: New photographersTKclass: New photographers
TKclass: New photographers
 
Storytelling Tools
Storytelling ToolsStorytelling Tools
Storytelling Tools
 
TKclass: Crowdsourcing tools
TKclass: Crowdsourcing toolsTKclass: Crowdsourcing tools
TKclass: Crowdsourcing tools
 
Digital portfolio advice for today's students
Digital portfolio advice for today's studentsDigital portfolio advice for today's students
Digital portfolio advice for today's students
 
Tkclass Social Media Data for Research, Reporting
Tkclass Social Media Data for Research, ReportingTkclass Social Media Data for Research, Reporting
Tkclass Social Media Data for Research, Reporting
 
TKclass Social media 2: Facebook
TKclass Social media 2: FacebookTKclass Social media 2: Facebook
TKclass Social media 2: Facebook
 
TKclass social media 1: Twitter, SocialCam
TKclass social media 1: Twitter, SocialCamTKclass social media 1: Twitter, SocialCam
TKclass social media 1: Twitter, SocialCam
 
TKclass: News business models
TKclass: News business modelsTKclass: News business models
TKclass: News business models
 
TKclass mobile trends slides
TKclass mobile trends slidesTKclass mobile trends slides
TKclass mobile trends slides
 

Dernier

+971581248768>> SAFE AND ORIGINAL ABORTION PILLS FOR SALE IN DUBAI AND ABUDHA...
+971581248768>> SAFE AND ORIGINAL ABORTION PILLS FOR SALE IN DUBAI AND ABUDHA...+971581248768>> SAFE AND ORIGINAL ABORTION PILLS FOR SALE IN DUBAI AND ABUDHA...
+971581248768>> SAFE AND ORIGINAL ABORTION PILLS FOR SALE IN DUBAI AND ABUDHA...
?#DUbAI#??##{{(☎️+971_581248768%)**%*]'#abortion pills for sale in dubai@
 
Cloud Frontiers: A Deep Dive into Serverless Spatial Data and FME
Cloud Frontiers:  A Deep Dive into Serverless Spatial Data and FMECloud Frontiers:  A Deep Dive into Serverless Spatial Data and FME
Cloud Frontiers: A Deep Dive into Serverless Spatial Data and FME
Safe Software
 
Architecting Cloud Native Applications
Architecting Cloud Native ApplicationsArchitecting Cloud Native Applications
Architecting Cloud Native Applications
WSO2
 

Dernier (20)

Connector Corner: Accelerate revenue generation using UiPath API-centric busi...
Connector Corner: Accelerate revenue generation using UiPath API-centric busi...Connector Corner: Accelerate revenue generation using UiPath API-centric busi...
Connector Corner: Accelerate revenue generation using UiPath API-centric busi...
 
Understanding the FAA Part 107 License ..
Understanding the FAA Part 107 License ..Understanding the FAA Part 107 License ..
Understanding the FAA Part 107 License ..
 
Boost Fertility New Invention Ups Success Rates.pdf
Boost Fertility New Invention Ups Success Rates.pdfBoost Fertility New Invention Ups Success Rates.pdf
Boost Fertility New Invention Ups Success Rates.pdf
 
+971581248768>> SAFE AND ORIGINAL ABORTION PILLS FOR SALE IN DUBAI AND ABUDHA...
+971581248768>> SAFE AND ORIGINAL ABORTION PILLS FOR SALE IN DUBAI AND ABUDHA...+971581248768>> SAFE AND ORIGINAL ABORTION PILLS FOR SALE IN DUBAI AND ABUDHA...
+971581248768>> SAFE AND ORIGINAL ABORTION PILLS FOR SALE IN DUBAI AND ABUDHA...
 
Apidays New York 2024 - Accelerating FinTech Innovation by Vasa Krishnan, Fin...
Apidays New York 2024 - Accelerating FinTech Innovation by Vasa Krishnan, Fin...Apidays New York 2024 - Accelerating FinTech Innovation by Vasa Krishnan, Fin...
Apidays New York 2024 - Accelerating FinTech Innovation by Vasa Krishnan, Fin...
 
Cloud Frontiers: A Deep Dive into Serverless Spatial Data and FME
Cloud Frontiers:  A Deep Dive into Serverless Spatial Data and FMECloud Frontiers:  A Deep Dive into Serverless Spatial Data and FME
Cloud Frontiers: A Deep Dive into Serverless Spatial Data and FME
 
DBX First Quarter 2024 Investor Presentation
DBX First Quarter 2024 Investor PresentationDBX First Quarter 2024 Investor Presentation
DBX First Quarter 2024 Investor Presentation
 
TrustArc Webinar - Unlock the Power of AI-Driven Data Discovery
TrustArc Webinar - Unlock the Power of AI-Driven Data DiscoveryTrustArc Webinar - Unlock the Power of AI-Driven Data Discovery
TrustArc Webinar - Unlock the Power of AI-Driven Data Discovery
 
ICT role in 21st century education and its challenges
ICT role in 21st century education and its challengesICT role in 21st century education and its challenges
ICT role in 21st century education and its challenges
 
Strategize a Smooth Tenant-to-tenant Migration and Copilot Takeoff
Strategize a Smooth Tenant-to-tenant Migration and Copilot TakeoffStrategize a Smooth Tenant-to-tenant Migration and Copilot Takeoff
Strategize a Smooth Tenant-to-tenant Migration and Copilot Takeoff
 
Mcleodganj Call Girls 🥰 8617370543 Service Offer VIP Hot Model
Mcleodganj Call Girls 🥰 8617370543 Service Offer VIP Hot ModelMcleodganj Call Girls 🥰 8617370543 Service Offer VIP Hot Model
Mcleodganj Call Girls 🥰 8617370543 Service Offer VIP Hot Model
 
Apidays New York 2024 - Scaling API-first by Ian Reasor and Radu Cotescu, Adobe
Apidays New York 2024 - Scaling API-first by Ian Reasor and Radu Cotescu, AdobeApidays New York 2024 - Scaling API-first by Ian Reasor and Radu Cotescu, Adobe
Apidays New York 2024 - Scaling API-first by Ian Reasor and Radu Cotescu, Adobe
 
Exploring Multimodal Embeddings with Milvus
Exploring Multimodal Embeddings with MilvusExploring Multimodal Embeddings with Milvus
Exploring Multimodal Embeddings with Milvus
 
EMPOWERMENT TECHNOLOGY GRADE 11 QUARTER 2 REVIEWER
EMPOWERMENT TECHNOLOGY GRADE 11 QUARTER 2 REVIEWEREMPOWERMENT TECHNOLOGY GRADE 11 QUARTER 2 REVIEWER
EMPOWERMENT TECHNOLOGY GRADE 11 QUARTER 2 REVIEWER
 
WSO2's API Vision: Unifying Control, Empowering Developers
WSO2's API Vision: Unifying Control, Empowering DevelopersWSO2's API Vision: Unifying Control, Empowering Developers
WSO2's API Vision: Unifying Control, Empowering Developers
 
DEV meet-up UiPath Document Understanding May 7 2024 Amsterdam
DEV meet-up UiPath Document Understanding May 7 2024 AmsterdamDEV meet-up UiPath Document Understanding May 7 2024 Amsterdam
DEV meet-up UiPath Document Understanding May 7 2024 Amsterdam
 
How to Troubleshoot Apps for the Modern Connected Worker
How to Troubleshoot Apps for the Modern Connected WorkerHow to Troubleshoot Apps for the Modern Connected Worker
How to Troubleshoot Apps for the Modern Connected Worker
 
Apidays New York 2024 - Passkeys: Developing APIs to enable passwordless auth...
Apidays New York 2024 - Passkeys: Developing APIs to enable passwordless auth...Apidays New York 2024 - Passkeys: Developing APIs to enable passwordless auth...
Apidays New York 2024 - Passkeys: Developing APIs to enable passwordless auth...
 
Architecting Cloud Native Applications
Architecting Cloud Native ApplicationsArchitecting Cloud Native Applications
Architecting Cloud Native Applications
 
Navigating the Deluge_ Dubai Floods and the Resilience of Dubai International...
Navigating the Deluge_ Dubai Floods and the Resilience of Dubai International...Navigating the Deluge_ Dubai Floods and the Resilience of Dubai International...
Navigating the Deluge_ Dubai Floods and the Resilience of Dubai International...
 

Data visualizations are not boring anymore! (updated)

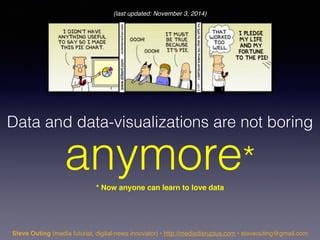
  • 1. anymore* Steve Outing (media futurist, digital-news innovator) • http://mediadisruptus.com • steveouting@gmail.com * Now anyone can learn to love data Data and data-visualizations are not boring (last updated: November 3, 2014)
  • 2. Steve Outing (media futurist, digital-news innovator) • http://mediadisruptus.com • steveouting@gmail.com Should all journalists learn data visualization, infographics skills?
  • 3. Steve Outing (media futurist, digital-news innovator) • http://mediadisruptus.com • steveouting@gmail.com No one can escape the massive growth of data – especially journalists Exponential growth in data Social media data Sensor data Mobile-phone sensor data Government data Treasure trove of news and story ideas for journalists (much not possible in past) News organizations hiring more data editors “Internet of Things” means even more sensors!
  • 4. Steve Outing (media futurist, digital-news innovator) • http://mediadisruptus.com • steveouting@gmail.com Rate of growth in data is scary fast But this presents enormous opportunity for journalists to spot trends and identify untold stories
  • 5. Steve Outing (media futurist, digital-news innovator) • http://mediadisruptus.com • steveouting@gmail.com Social media data is a big part of growth (because we voluntarily share so much) Tweets per day: 500 million Source: Twitter Source: Instagram Source: Statistica Facebook per day: • likes per day: 4.5 billion • items shared: 4.75 billion • photos posted: 350 million Instagram: • photos per day: 58 million • “likes” per day: 1.65 billion Source: Facebook
  • 6. Steve Outing (media futurist, digital-news innovator) • http://mediadisruptus.com • steveouting@gmail.com Social media analysis tools find insights in all that data }The “Social Cocktail”
  • 7. Steve Outing (media futurist, digital-news innovator) • http://mediadisruptus.com • steveouting@gmail.com Much can be understood by visualizing social-media data
  • 8. Data in action: Ebola doctor’s movements from his mobile phone Steve Outing (media futurist, digital-news innovator) • http://mediadisruptus.com • steveouting@gmail.com
  • 9. Steve Outing (media futurist, digital-news innovator) • http://mediadisruptus.com • steveouting@gmail.com A data visualization can tell the story all by itself
  • 10. Steve Outing (media futurist, digital-news innovator) • http://mediadisruptus.com • steveouting@gmail.com A data visualization can tell the story mostly by itself
  • 11. Trends More and more data becoming accessible (exponential growth) Data analysis tools available for everyone (You don’t need a degree in statistics) Data visualization tools continue to be easier to use and more powerful Steve Outing (media futurist, digital-news innovator) • http://mediadisruptus.com • steveouting@gmail.com
  • 12. Great tools … Not easy to master More powerful, capable Static or interactive or video … But expensive Takes time to learn Steep learning curve Perhaps too much for a busy multi- tasking journalist Steve Outing (media futurist, digital-news innovator) • http://mediadisruptus.com • steveouting@gmail.com
  • 13. Steve Outing (media futurist, digital-news innovator) • http://mediadisruptus.com • steveouting@gmail.com More-powerful, easy-to-use tools are here: Still need Excel and Adobe applications? Client app: free trial … Or use Tableau Public for free … Embed visualizations on your site
  • 14. Steve Outing (media futurist, digital-news innovator) • http://mediadisruptus.com • steveouting@gmail.com Example of interactive data visualization using Tableau
  • 15. Many easier-to-use tools are now
 not on desktop: Use them in the cloud Steve Outing (media futurist, digital-news innovator) • http://mediadisruptus.com • steveouting@gmail.com
  • 16. The problem when data visualization tools are available for everyone Steve Outing (media futurist, digital-news innovator) • http://mediadisruptus.com • steveouting@gmail.com Pretty… Nearly incomprehensible!! Effective data visualization… But a bit plain looking Sources: Harvard Business Review, JunkCharts.com
  • 17. But even if you’re not an expert, you can learn the ropes Bar Chart: As simple as you can get with data visualization Steve Outing (media futurist, digital-news innovator) • http://mediadisruptus.com • steveouting@gmail.com Flawed Much better! No need to turn head to read type
  • 18. What’s wrong with this map? (So many things!) Steve Outing (media futurist, digital-news innovator) • http://mediadisruptus.com • steveouting@gmail.com via Alberto Cairo, University of Miami
  • 19. This is much better Steve Outing (media futurist, digital-news innovator) • http://mediadisruptus.com • steveouting@gmail.com via Alberto Cairo, University of Miami
  • 20. Please don’t use data to lie or misrepresent the real story Steve Outing (media futurist, digital-news innovator) • http://mediadisruptus.com • steveouting@gmail.com via Alberto Cairo, University of Miami
  • 21. Steve Outing (media futurist, digital-news innovator) • http://mediadisruptus.com • steveouting@gmail.com A few data visualization tips Not all big data is useful data … e.g., Twitter data may not help you answer some questions, but will help on others With social-media data, pick the best source(s) … Disqus comments or Tumblr might be better fit for what you seek; combining sources in “social cocktail” may yield best insight Tell a story! … Dont’ just create charts; use data and visualizations as the means to telling a story Presentation: How much data, complexity does reader need? … Keep it as simple as possible in visualization Data: Attribute your sources; link to source data Don’t let your numbers lie! … Proper chart form; 0 baseline; etc. Choose the right chart type for your data … Here’s a handy guide Design: Don’t clutter with useless illustration Design follows data! Design: Keep color blindness in mind … 8-10% males; <1% females
  • 22. ProPublica Nerds Blog
 http://www.propublica.org/nerds/
 PP’s Tools and Style Guides
 https://github.com/propublica/ The Guardian Data Blog
 http://www.theguardian.com/news/datablog Texas Tribune: The Data
 http://www.texastribune.org/library/data/ Information Aesthetics
 http://infosthetics.com Chart Porn blog
 http://chartporn.org Book: “The Functional Art: An introduction to information graphics and visualization” - by Alberto Cairo Good news data-viz resources Steve Outing (media futurist, digital-news innovator) • http://mediadisruptus.com • steveouting@gmail.com
  • 23. Steve Outing Media futurist, Digital-news innovator | steveouting@gmail.com http://mediadisruptus.com http://www.slideshare.net/steveouting1