2. (MIT ESD Working Paper Series) GARCH PROOF OF CONCEPT: Forecasting and Risk Analysis in Supply Chain Management
Page 2 of 22 Datta et al shoumen@mit.edu MIT Forum for Supply Chain Innovation, ESD‐CEE, School of Engineering
1. Introduction
Uncertainty fuels the need for risk management although risk, if adequately measured, may be less than
uncertainty, if measurable. Forecasting may be viewed as a bridge between uncertainty and risk if a forecast
peels away some degrees of uncertainty but on the other hand, for example, may increase the risk of
inventory. Therefore, forecasting continues to present significant challenges. Boyle et al (2008) presented
findings from electronics industry, where original equipment manufacturers (OEM) could not predict demand
beyond a 4 week horizon. Moon et al (2000) presented demand forecasting from Lucent (Alcatel‐Lucent),
demonstrating improvement in forecasting accuracy (60% to 80‐85%). Related observations (Datta 2008a)
resulted in inventory markdowns.
Availability of increasing volumes of data (Reyes et al 2007, Reyes and Frazier 2008) demands tools that can
extract value from data. Recent research has shown that advanced forecasting tools enable improvements in
supply chain performance (Zhao et al 2001, Zhao et al 2002, Bayraktar et al 2008, Wright and Yuan 2008), if
certain pre‐requisites are optimized (ordering policies, inventory collaboration). Autoregressive models have
been effective in macroeconomic inventory forecasts (Albertson and Aylen 2003). Zhao et al (2002) and
Bayraktar et al (2008) emphasize that the role of forecasting in supply chain is to indicate the right direction
for the actors rather than being exactly right, at every moment. Choosing the correct forecasting method is
often a complex issue (Chatfield and Yar 1988).
The purpose of this work is to explore how advanced forecasting methods could be applied in global supply
chain management and their requirements. We present real world results and use simulation of a 4‐stage
supply chain model, beer‐game (Vensim simulation). We have also used SPSS statistical analysis software to
construct autoregressive forecasting models. The problems may be described as: (1) how to construct
autoregressive forecasting models for a supply chain environment and (2) what changes may be needed in
supply chain design to apply these advanced forecasting models? In the next section, we introduce a few
challenges and section 3 discusses demand amplification in supply chain management. In section 4 we discuss
features of autoregressive models and generalized autoregressive conditional heteroskedasticity (GARCH).
Data and analysis from a supply chain inventory model using GARCH is presented and although the results are
preliminary, they are encouraging. Concluding thoughts and further research issues are proposed in section 5.
4. (MIT ESD Working Paper Series) GARCH PROOF OF CONCEPT: Forecasting and Risk Analysis in Supply Chain Management
Page 4 of 22 Datta et al shoumen@mit.edu MIT Forum for Supply Chain Innovation, ESD‐CEE, School of Engineering
It follows that demand amplification may have serious consequences due to increased uncertainty and
increases the significance of risk management. During a down turn, Towill (2005) showed that amplification
causes possible shortages on product volume (products are not ordered, even if demand is undiminished) and
variety as well as on idle capacity in operations and involves potential layoff costs. In the case of positive
demand, Towill (2005) identifies that stock deterioration and sales cannibalization produces lost income.
Consumers purchase products lured by discounts and that diminishes sales in the following time periods or
seasons (Warburton & Stratton 2002). During upswings, operations cost a premium for manufacturing and
distribution (orders increase rapidly), but also decreases productivity development and increases waste
levels. Recent emphasis on outsourcing and large‐scale utilization of low cost sourcing has worsened demand
amplification (Lowson 2001, Warburton and Stratton 2002, Stratton and Warburton 2003, Hilletofth and
Hilmola 2008). Risks associated with production and transportation delays are considerably higher. To
mitigate such risks, some corporations are using responsiveness as a strategic differentiator and have built
their supply chains to react on market changes through more localized supply networks, for example,
Benetton (Dapiran 1992), Zara (Fraiman and Singh 2002), Griffin (Warburton and Stratton 2002, Stratton and
Warburton 2003), Obermeyer (Fisher et al 1994) and NEXT (Towill 2005). The carbon footprint of sourcing
strategies will become increasingly relevant in view of future legislation. Logistics may ultimately benefit from
a disruptive innovation (Datta 2008b) in energy sourcing and management using wireless sensors networks.
In recent decades, even macroeconomists are including inventory as a key indicator of economic decline of
national economies (Ramey 1989, Albertson an Aylen 2003). Ramey (1989) argued that manufacturing input
inventories, raw materials and work in process (WIP), fluctuated most in recession, while end‐item or finished
goods inventories fluctuate less (Table 1). However, the labour market volatility is also an issue in changing
economic environments (Ramey 1989). Although, inventory positions seem to fluctuate, Albertson and Aylen
(2003) argue that autoregressive forecasting models are able to forecast next period situation with a 50%
accuracy. While autoregressive techniques have been widely used in finance (and economics) in the past few
decades, they may not have been applied or explored as decision support tools by supply chain planners or
analysts in the area of supply chain management (Datta et al 2007) or in other verticals (healthcare, energy).
5. Page 5 of 22 Datta et al shoumen@mit.edu MIT Forum for Supply Chain Innovation, ESD‐CEE, School of Engineering
(MIT ESD Working Paper Series) GARCH PROOF OF CONCEPT: Forecasting and Risk Analysis in Supply Chain Management
Table 1. Inventory changes in recession in USA during 1960‐1982 (Ramey 1989)
Recessions Retail Wholesale
Manufact.
Finished
Inventories
Manufact.
Input
Inventories
1960:1-1960:4 -6.3 -1.7 -3.1 -6.3
1969:3-1970:4 -8.2 1.2 -0.4 -5.2
1973:4-1975:1 -16.0 -5.8 2.4 -13.2
1980:1-1980:2 3.6 1.9 -0.3 -4.1
1981:3-1982:4 -7.6 -2.3 -7.8 -11.1
All numbers billions of US dollars (1972), annual rates of change.
‐2
0
2
4
6
8
10
1986
1987
1988
1989
1990
1991
1992
1993
1994
1995
1996
1997
1998
1999
2000
2001
2002
2003
2004
2005
2006
2007
2008
Computers Semiconductors
Figure 1. Capacity addition change in US computer and semiconductor 1986‐2008 (Federal Reserve 2008)
Logic of demand amplification is evident in economic cycles (Forrester 1976, Sterman 1985). Order backlog,
existing inventory holdings, amount of production, amount of employment and capacity additions were used
in simulation trials to forecast different levels of economic cycles. In long‐term changes, both Forrester (1976)
and Sterman (1985) have emphasized the importance of capacity additions. A similar methodology has been
used in maritime economics to estimate price level changes (Dikos et al 2006) and investment cycle lengths in
capital intensive industries (Berends & Romme 2001). Hilmola (2007) has shown that capacity additions in US
in semiconductors and computers industries may explain the behavior of stock market indices.
8. (MIT ESD Working Paper Series) GARCH PROOF OF CONCEPT: Forecasting and Risk Analysis in Supply Chain Management
Page 8 of 22 Datta et al shoumen@mit.edu MIT Forum for Supply Chain Innovation, ESD‐CEE, School of Engineering
chain
40
36
32
28
24
20
16
12
8
4
0
100 105 110 115 120 125 130 135 140 145 150 155 160 165 170 175 180 185 190 195 200
Time (Month)
Customer demand : transparency bottles per hour
Retailordes : transparency bottles per hour
Distributionorders : transparency bottles per hour
Wholesalerorders : transparency bottles per hour
Production orders : transparency bottles per hour
Figure 4. Forrester effect in four stage supply chain, where we have transparency for the next stage
(delay = 4, step‐wise demand change from 4 to 8 units during time unit 100).
In previous and current work, we suggest that improving forecasting accuracy could be profitable by using
advanced forecasting methods, such as autoregressive moving average (ARMA) models. Figure 5 shows that
demand forecasting in an amplified environment may be completed by assigning a positive value for last
observed demand and a negative co‐efficient for older observations (we have used lag of one and two).
13. Page 13 of 22 Datta et al shoumen@mit.edu MIT Forum for Supply Chain Innovation, ESD‐CEE, School of Engineering
(MIT ESD Working Paper Series) GARCH PROOF OF CONCEPT: Forecasting and Risk Analysis in Supply Chain Management
Extracting the value from this high volume near real‐time data and deciphering the meaning of the implicit
volatility may be a boon to business intelligence and predictive analytics, including forecasting.
Indeed many warehouses adopt an inventory policy of ordering products when stock levels fall below a
certain minimum amount s and order up to a maximum amount S [the (s, S) policy]. With auto id it is possible
to ascertain this at the instant the threshold is attained, thereby, eliminating the likelihood of out of stock
(OOS). Hence, it follows that capitalizing on the increased volume of near real‐time demand data from auto id
may have profound impact on supply chain forecasting.
However, current software with its CLRM engines and clustering approach, does not improve forecasts even
with high volume data. The assumption of error terms implicit in CLRM limits the gains in forecast accuracy
from high volume data and fails to show return on investment (ROI) from adoption of (new) auto id tools.
It is our objective to justify why deployment of new tools, for example, auto id, calls for adoption of new
techniques for data analytics, for example, advanced techniques from financial econometrics. It is safe to
state that new streams of data emerging from a multitude of sources, for example, auto id and sensors,
cannot yield value or ROI if used in conjunction with archaic software systems running ancient forms of
analytical engines that are typically CLRM based, at least, in the forecasting domain.
To extract decisionable information from high volume near real‐time auto id and sensor data, the use of
techniques like GARCH deserves intense exploration. The fact that GARCH may be a clue to generating ROI
from auto id and RFID data is no accident because GARCH requires high volume data to be effectively utilized
and generate results with higher accuracy levels. Hence, this convergence of auto id data with tools from
econometrics may be an innovative confluence that may be useful in any vertical in any operation including
security and healthcare, as well as obvious and immediate use in supply chain management. Datta et al 2007
and this chapter, has attempted to highlight how to extract the advances in econometrics from the world of
finance and generalize their valuable use in decision systems, with a broad spectrum of general applications.
17. Page 17 of 22 Datta et al shoumen@mit.edu MIT Forum for Supply Chain Innovation, ESD‐CEE, School of Engineering
(MIT ESD Working Paper Series) GARCH PROOF OF CONCEPT: Forecasting and Risk Analysis in Supply Chain Management
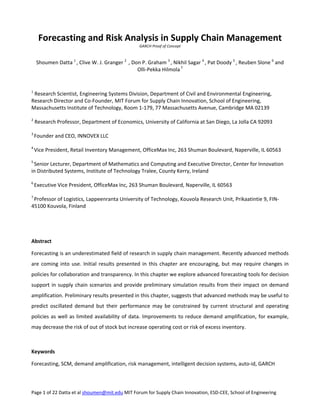
0%
20%
40%
60%
80%
100%
120%
140%
1 2 3 4 5 6 7 8 9
Product Line
ForecastingError
ARMA GARCH
Figure 9: Comparing autoregressive techniques: ARMA vs GARCH (same data set but excluding CLRM)
The results suggest that GARCH may be better (or as good as) across different SKU’s. GARCH outperforms
ARMA for a number of products. For the eight favorable tests, an average improvement of 800 basis points
was observed. The product‐dependent variability of GARCH performance may be linked to seasonality or
other factors (accuracy of input data). Further testing with granular data (hourly or daily) and higher volume
data per SKU may increase the accuracy and benefits from using the GARCH technique in forecasting.
It is not difficult to extrapolate that high volume item level retail sales or inventory data (per minute or by the
hour) may be available with the diffusion of item level tagging using RFID or radio frequency identification
tags. The volume of the data may increase exponentially if embedded sensors are deployed to enhance
security and/or detect movement of any physical object from any location. Businesses dealing with short life
cycle products (electronics, semi‐conductor industries) may explore how these advanced techniques may help
to reduce the volatility of supply‐demand since the ability to re‐address sales or marketing issues are often
limited if the shelf‐life of the product is merely a matter of a few months (laptops, MP3 players, cell phones).