SlideShare a Scribd company logo
1 of 11
Running head: Wells Fargo Case Study                      1


                                 Wells Fargo Case Study

                                         Daniel Davis

                                   Liberty University

                                       Business 400-B02

                                 Professor Nicole Lowes
Wells Fargo Case Study                                                                       2


                                             Abstract

       Using the case study in our textbook on page 111-119, the purpose of this paper is to

answer the following questions: How should Wells Fargo Position itself for the future? Should it

strengthen its retail presence, grow internationally, or move into the void created by the

disappearance of investment banks? Develop Projected Financial Statements that fully assess and

evaluate the impact of the proposed strategy. How are the acquisitions/growth financed? Will

debt be increased further, or ownership of WFC stock be diluted to raise the capital needed?

The author will attempt to answer these questions using charts and graphs as illustrations and

supporting evidence.
Wells Fargo Case Study                                                                     3


                                     Wells Fargo Case Study

Executive Summary

       The paper submitted will contain a proposed plan of action using primarily data from

Morningstar to show a proposed acquisition for Wells Fargo. This acquisition will greatly

increase the Wealth, Brokerage, & Retirement segment of Wells Fargo that has been

underutilized and overlooked. This proposal will “marry” the benefits of TD Ameritrade with the

Cross-selling strength of Wells Fargo.

       The primary purpose that TD Ameritrade was selected was convenience. Although

Charles Schwab and E*TRADE are competitors of TD Ameritrade, but they were not selected

for varying reasons. Charles Schwab has a history of refusing overtures for takeovers after his

disappointing episode of being bought up by a large corporation many years ago.

       E*TRADE, whom some experts consider having a higher upside than TD Ameritrade, is

not nearly as stable or financially sound. Given the current economic uncertainty and the authors

penchant for avoiding risk, TD Ameritrade is the best option available of the large independent

retail brokerages. According to Zacks Equity Research, an interesting side note is “that Wells

Capital Management, the wholly owned institutional asset management subsidiary of Wells

Fargo Bank, N.A., and part of Wells Fargo’s Asset Management Group” (Zacks Equity

Research, 2011) already owns about 2.58% of TD Ameritrade. (Morningstar.com, 2012)

How should Wells Fargo Position itself for the future?

       Wells Fargo can position itself for the future by capitalizing on its one-stop shopping

format for all financial products. Already with one of the highest cross-selling ratios in the

world “…at 5.81 products per banking household…” this number can and should go higher in

the not too distant future. (APA editorial, 2009)
Wells Fargo Case Study                                                                    4


       According to the 2010 Annual Report for Wells Fargo, they have set an internal target of

8 products per banking household out of about 16 products normally available. While this may

seem excessive, a brief look at the historical data suggests that this focus is working

exceptionally well. The 1999-2010 Annual Reports along with revenue date from Morningstar

shows year over year growth in the number of products per household and that information has

corresponded to a rise in Total Revenue:


       Year            Banking Products per Household                Total Revenue
       1999                         3.2                              18,091,000,000
       2000                         3.4                              19,708,000,000
       2001                            3.7                           20,150,000,000
       2002                            3.8                           24,496,000,000
       2003                            4.2                           28,389,000,000
       2004                            4.3                           30,059,000,000
       2005                            4.6                           32,949,000,000
       2006                            4.8                           35,691,000,000
       2007                            5.2                           39,390,000,000
       2008                            5.5                           41,897,000,000
       2009                            5.7                           88,686,000,000
     2010                         5.9                                85,210,000,000
(Morningstar.com, Accessed on 2012) and

(Wells Fargo, 2010,2009,2008,2007,2006,2005,2004,2003,2001,2001,2000,1999)

Should it strengthen its retail presence, grow internationally, or move into the void created

by the disappearance of investment banks?

               Over the past few months, Wells Fargo has been on a buying spree. In December

2011, it was announced by Zacks Equity Research that Wells Fargo had “acquired investment

boutique firm EverKey Global Partners”. (Zacks Equity Research, 2011)
Wells Fargo Case Study                                                                    5


       On February 21, 2012, Reuters announced Wells Fargo was purchasing the BNP Paribas

energy lending unit as some European banks have started shedding assets the credit crunch

overseas has been getting progressively worse. (Rothacker, 2012)

       This buying spree has already been financed in some way, but the main strength of Wells

Fargo has been expanding its line of products to existing customers. Expanding the Wholesale

Banking segment would fund its acquisitions in the Wealth, Brokerage, & Retirement Segments.

For Example, Chrysler Inc. and GM have made some headlines recently with indications that

they are looking to give Wells Fargo control of an auto financing partnership. As of March 1,

2012, only GM has made the decision to do so. (http://media.gm.com, 2012)

       Looking over the business segment results in Case Study 11 on page 117 of our textbook,

the Wealth, Brokerage & Retirement Services stands out as the weakest segment. This particular

segment could benefit from Cross-selling services the most. My assertion is that Wells Fargo

should aggressively expand its offerings of investment services by purchasing TD Ameritrade.

This would strengthen its electronic brokerage business and diversify its complementary

investment portfolio by offering a wider range of services. This backwards integration would

make sense for Wells Fargo and give it an online presence in one of the few independent firms

that have survived in the online brokerage business.

Develop Projected Financial Statements that fully assess and evaluate the impact of the

proposed strategy.

       Included is the Projected Combined Balance Sheet, Income Statement, Statement of Cash

Flow. This acquisition would give Wells Fargo about 5.6 million online brokerage accounts.
Wells Fargo Case Study                                   6


             Wells Fargo Projected Combined Balance Sheet
                          Enter Expected Growth Rate:             3%

 Fiscal year ends in December.                  2011            2012
 Assets

 Cash and due from banks                $     20,472    $     21,086
 Deposits with banks                    $        -      $        -
 Federal funds sold                     $     44,367    $     45,698
 Trading assets                         $     77,814    $     80,148
 Debt securities                        $    222,613    $    229,291
 Loans                                  $    819,326    $    843,906

 Allowance for loan losses              $    (19,372)   $    (19,953)
 Net loans                              $    799,954    $    823,953
 Receivables                            $     40,562    $     41,779

 Premises and equipment                 $      9,872    $     10,168
 Goodwill                               $     27,582    $     28,409

 Other intangible assets                $     23,985    $     24,705
 Other assets                           $     63,325    $     65,225

 Securities and investments             $       447     $       460
 Total assets                           $ 2,130,947     $ 2,194,875
 Liabilities and stockholders' equity                   $       -
 Liabilities                                            $       -
 Deposits                               $   920,070     $   947,672
 Short-term borrowing                   $    49,091     $    50,564
 Long-term debt                         $   126,691     $   122,890
 Other liabilities                      $    80,091     $    82,494
 Payables                               $    10,693     $    11,014
 Total liabilities                      $ 1,186,636     $ 1,214,634
 Stockholders' equity                                   $       -
 Preferred stock                        $     11,431    $    11,088
 Common stock                           $      8,937    $     8,669
 Other Equity                           $       (926)   $      (898)

 Additional paid-in capital             $     57,540    $     59,266
 Retained earnings                      $     68,031    $     70,072
 Treasury stock                         $     (3,864)   $     (3,748)

  Accumulated other comprehensive
 income                                 $      3,207    $      3,303

 Total stockholders' equity              $   144,356    $    147,752
 Total liabilities and stockholders'
 equity                                  $ 1,330,992    $ 1,362,386
Wells Fargo Case Study                                     7


 Wells Fargo & Co (WFC) Frojected Combined Income Statement
                        Enter Expected Growth Rate:      3.00%
 Fiscal year ends in December.                 2011       2012
 Revenue
 Interest income                   $            497  $     512
 Loans and Leases                  $         38,949  $ 40,117
 Securities                        $          8,475  $   8,729
 Trading assets                    $          1,440  $   1,483
 Other assets                      $        (48,864) $ (47,398)
 Other income                      $          2,271  $   2,339
 Total interest income             $          2,768  $   5,783
 Interest expense                  $             37  $      38
 Deposits                          $          2,275  $   2,343
 Short-term borrowing              $             80  $      82
 Long-term debt                    $          3,978  $   4,097
 Other expense                     $         (6,333) $  (6,143)
 Total interest expense            $             37  $     418
 Net interest income               $          2,731  $   5,365
 Noninterest revenue
 Commissions and fees              $         23,430  $ 24,133
 Principal transactions            $          1,014  $   1,044
 Equity investment income          $          1,482  $   1,526

 Lending and deposit-related fees   $         4,280    $   4,408
 Securities gains (losses)          $             54   $      56
 Credit card income                 $         3,653    $   3,763
 Other income                       $       (33,913)   $ (32,896)
 Total noninterest revenue          $           -      $   2,035
 Total net revenue                  $         2,731    $   7,400
 Provisions for credit losses       $       (49,412)   $ (50,894)
 Noninterest expenses
 Compensation and benefits          $       19,485     $   20,070
 Occupancy expense                  $        3,011     $    3,101
 Tech, communication and
 equipment                          $         2,283    $   2,351
  Amortization of intangibles       $         1,977    $   2,036
  Other expenses                    $       (25,465)   $ (24,701)
  Total noninterest expenses        $         1,291    $   2,858
 Income (loss) from cont ops
 before taxes                       $        50,852    $ 55,436
  Provision (benefit) for taxes     $         7,824    $   8,059
  Other income (expense)            $       (26,098)   $ (26,881)
  Net income                        $        69,126    $ 74,259
  Preferred dividend                $           844    $     869
  Net income available to common
 shareholders                       $       68,282     $ 73,389
Wells Fargo Case Study                                        8


    Wells Fargo & Co (WFC) Projected Statement of Cash Flow
                      Enter Expected Growth Rate:        3.00%

 Fiscal year ends in December             2011           2012
 Cash Flows From Operating Activities
  Net income                              $    16,849    $    17,354
  Provision for credit losses             $     7,899    $     8,136
  Depreciation & amortization             $     2,372    $     2,443
  Deferred tax (benefit) expense          $         2    $         2
  Stock based compensation                $       564    $       581
  Receivable                              $      (739)   $      (761)
  Accrued liabilities                     $     2,638    $     2,717
  Interest payable                        $     1,582    $     1,629
  Other assets and liabilities            $    25,915    $    26,692
  Other operating activities              $   (42,603)   $   (41,325)
  Investments (gains) losses              $        (2)   $        (2)
  Deferred charges                        $       (21)   $       (20)
 Net cash provided by operating
 activities                               $   14,456     $   17,447
  Cash Flows From Investing Activities
 Sales/maturity of investments            $ 111,950      $ 115,309
 Purchases of investments                 $ (121,244)    $ (124,881)
 Acquisitions and dispositions            $     (351)    $     (362)

 Property, and equipments, net            $      (153)   $      (158)
 Other investing activities               $    10,344    $    10,654
 Changes in loans, net                    $   (35,749)   $   (34,677)

 Net cash used for investing activities   $ (35,203)     $ (34,114)
 Cash Flows From Financing Activities
 Change in deposits                       $   72,128     $   74,292

  Change in federal funds purchased       $       119    $       123
  Long-term debt issued                   $    11,687    $    11,336
  Long-term debt repayment                $   (50,559)   $   (52,076)
  Excess tax benefit from stock based
 compensation                             $       79     $        81

 Repurchases of treasury stock            $    (2,765)   $    (2,848)
 Cash dividends paid                      $    (3,495)   $    (3,600)
 Other financing activities               $      (332)   $      (342)

  Change in short-term borrowing          $    (6,231)   $    (6,044)
  Common stock issued                     $     1,296    $     1,257
  Preferred stock issued                  $     2,501    $     2,426
  Net cash provided by (used for)
 financing activities                     $   24,428     $   24,606
  Effect of exchange rate changes         $      -       $      -
  Net change in cash                      $    3,681     $    7,939
  Cash at beginning of period             $   16,785     $   20,472
  Cash at end of period                   $   20,472     $   28,411
Wells Fargo Case Study                                                                     9


       The combined company would effectively merge TD Ameritrade’s online retail discount

brokerage with Wells Fargo sophisticated cross-selling strategy and further expand consumer

options along the entire spectrum of products.

How are the acquisitions/growth financed?


       Using the chart as a guide, the best option seems to be a common stock financed path.


                                    EPS/EBIT Analysis
          16.00


           8.00
   EPS


           4.00                                                           Common Stock Financing
                                                                          Debt Financing
                                                                          70% Stock
           2.00
                                                                          70.00% Debt


           1.00
                     $35,571.00      $50,582.00      $66,133.00


                                     EBIT
This returns the highest levels of growth to the shareholders and seems the most reasonable.

However, looking over the cash flows for Wells Fargo, it becomes clear with almost 20 billion

dollars of cash on hand at the beginning of 2012, they could almost entirely buy TD Ameritrade

directly. (Morningstar.com, 2012)

       A more probable course of action is to fund the acquisition using cash on hand for about

50% and then issuing common stock for the remaining 50% purchase.
Wells Fargo Case Study                                                                 10


Will debt be increased further, or ownership of WFC stock be diluted to raise the capital

needed?

       As suggested above, the best possible solution would dilute Wells Fargo stock, but given

the overwhelming strength of the company, it is difficult to see where this would become a

serious concern. TD Ameritrade is approximately 1/10 the size of Wells Fargo and is on very

good financial footing itself.

       In conclusion, this assignment was extremely thought provoking and an excellent excuse

to spend a lot of time using excel and researching financial data.
Wells Fargo Case Study                                                                         11


                                            References

APA editorial. (2009, May 4). Bankinter tops global cross-selling league. Retrieved from http://www.vrl-

        financial-news.com: http://www.vrl-financial-news.com/bpa/banking--payments-

        asia/issues/bpa-2009/bpa3/bankinter-tops-global-cross-se.aspx

http://media.gm.com. (2012, March 1). GM and Wells Fargo Launch Auto Financing Partnership.

        Retrieved from http://media.gm.com:

        http://media.gm.com/media/us/en/gm/news.detail.html/content/Pages/news/us/en/2012/Ma

        r/0301_wellsfargo

Morningstar.com. (2012, March 2). Financials: Cash Flow. Retrieved from http://www.morningstar.com:

        http://financials.morningstar.com/cash-flow/cf.html?t=WFC&region=USA&culture=en-us

Morningstar.com. (Accessed on 2012, March 1). Key Ratios. Retrieved from Morningstar.com:

        http://financials.morningstar.com/ratios/r.html?t=WFC&region=USA&culture=en-us

Rothacker, R. (2012, February 21). Wells Fargo buys BNP Paribas energy lending unit. Retrieved from

        http://www.reuters.com: http://www.reuters.com/article/2012/02/22/us-wellsfargo-

        acquisition-idUSTRE81L00O20120222

Wells Fargo. (2010,2009,2008,2007,2006,2005,2004,2003,2001,2001,2000,1999). 2010 Annual Report.

Zacks Equity Research. (2011, December 16). Wells Fargo to Acquire EverKey. Retrieved from

        http://www.zacks.com:

        http://www.zacks.com/stock/news/66480/Wells+Fargo+to+Acquire+EverKey

More Related Content

What's hot

What's hot (20)

Wells fargo
Wells fargoWells fargo
Wells fargo
 
Wells Fargo By Jomy Mathew
Wells Fargo By Jomy MathewWells Fargo By Jomy Mathew
Wells Fargo By Jomy Mathew
 
The Wells Fargo Cross-Selling Scandal
The Wells Fargo Cross-Selling Scandal The Wells Fargo Cross-Selling Scandal
The Wells Fargo Cross-Selling Scandal
 
Lehman Brothers fall
Lehman Brothers fallLehman Brothers fall
Lehman Brothers fall
 
Fall of lehman brothers
Fall of lehman brothers Fall of lehman brothers
Fall of lehman brothers
 
JPMorgan Chase Analysis Project_WC
JPMorgan Chase Analysis Project_WCJPMorgan Chase Analysis Project_WC
JPMorgan Chase Analysis Project_WC
 
Why Lehman Bros Went Bust!!
Why Lehman Bros Went Bust!!Why Lehman Bros Went Bust!!
Why Lehman Bros Went Bust!!
 
Lehman brothers scam
Lehman brothers scamLehman brothers scam
Lehman brothers scam
 
Lehman brothers
Lehman brothersLehman brothers
Lehman brothers
 
Fall Of Lehman Brother
Fall Of Lehman BrotherFall Of Lehman Brother
Fall Of Lehman Brother
 
Meryll lynch : Rise and Downfall
Meryll lynch  : Rise and DownfallMeryll lynch  : Rise and Downfall
Meryll lynch : Rise and Downfall
 
Collapse of Silicon valley bank.pptx
Collapse of Silicon valley bank.pptxCollapse of Silicon valley bank.pptx
Collapse of Silicon valley bank.pptx
 
Wells Fargo Case Study
Wells Fargo Case StudyWells Fargo Case Study
Wells Fargo Case Study
 
Financial crisis 2008
Financial crisis 2008Financial crisis 2008
Financial crisis 2008
 
Lehman Brothers - Collapse and Bankruptcy
Lehman Brothers - Collapse and BankruptcyLehman Brothers - Collapse and Bankruptcy
Lehman Brothers - Collapse and Bankruptcy
 
WorldCom Scandal
WorldCom ScandalWorldCom Scandal
WorldCom Scandal
 
COLLAPSE OF SILICON VALLEY BANK.pptx
COLLAPSE OF SILICON VALLEY BANK.pptxCOLLAPSE OF SILICON VALLEY BANK.pptx
COLLAPSE OF SILICON VALLEY BANK.pptx
 
General electric
General electricGeneral electric
General electric
 
The Subprime Crisis
The Subprime CrisisThe Subprime Crisis
The Subprime Crisis
 
Lehman Brothers Bankruptcy
Lehman Brothers BankruptcyLehman Brothers Bankruptcy
Lehman Brothers Bankruptcy
 

Similar to Wells Fargo Case Study

northan trust corp.2005SummaryAnnual
northan trust corp.2005SummaryAnnualnorthan trust corp.2005SummaryAnnual
northan trust corp.2005SummaryAnnualfinance38
 
American Express Centurion Bank2006
American Express Centurion Bank2006American Express Centurion Bank2006
American Express Centurion Bank2006finance8
 
Analysis of the Federal Reserve's Balance Sheet
Analysis of the Federal Reserve's Balance SheetAnalysis of the Federal Reserve's Balance Sheet
Analysis of the Federal Reserve's Balance SheetGaetan Lion
 
Expeditors International of Washington, 2nd05qer
Expeditors International of Washington, 2nd05qerExpeditors International of Washington, 2nd05qer
Expeditors International of Washington, 2nd05qerfinance39
 
Expeditors International of Washington, 4th03qer
Expeditors International of Washington, 4th03qerExpeditors International of Washington, 4th03qer
Expeditors International of Washington, 4th03qerfinance39
 
csx 02 annual
csx 02 annualcsx 02 annual
csx 02 annualfinance27
 
csx 02 annual
csx 02 annualcsx 02 annual
csx 02 annualfinance27
 
Expeditors International of Washington, 3rd05qer
Expeditors International of Washington, 3rd05qerExpeditors International of Washington, 3rd05qer
Expeditors International of Washington, 3rd05qerfinance39
 
Expeditors International of Washington, 1st05qer
Expeditors International of Washington, 1st05qerExpeditors International of Washington, 1st05qer
Expeditors International of Washington, 1st05qerfinance39
 
SLM Q408EarningsStatisticsFinal
SLM  Q408EarningsStatisticsFinalSLM  Q408EarningsStatisticsFinal
SLM Q408EarningsStatisticsFinalfinance42
 
Access 4 Q11 Earnings
Access 4 Q11 EarningsAccess 4 Q11 Earnings
Access 4 Q11 Earningstomciolkosz
 
Investment Analysis Final Project
Investment Analysis  Final ProjectInvestment Analysis  Final Project
Investment Analysis Final Projectnroopraj24
 
Chapter 3 slide.ppt(1)
Chapter 3 slide.ppt(1)Chapter 3 slide.ppt(1)
Chapter 3 slide.ppt(1)bhaskarsingh95
 
Q2 2009 Earning Report of Webster Financial Corp.
Q2 2009 Earning Report of Webster Financial Corp.Q2 2009 Earning Report of Webster Financial Corp.
Q2 2009 Earning Report of Webster Financial Corp.earningreport earningreport
 
bed bath&beyond 2004ar
bed bath&beyond 2004arbed bath&beyond 2004ar
bed bath&beyond 2004arfinance44
 
bed bath&beyond 2004ar
bed bath&beyond 2004arbed bath&beyond 2004ar
bed bath&beyond 2004arfinance44
 
ConAgra Q4Jul04
ConAgra Q4Jul04ConAgra Q4Jul04
ConAgra Q4Jul04finance21
 
bed bath&beyond 2001ar_bbby2
bed bath&beyond 2001ar_bbby2bed bath&beyond 2001ar_bbby2
bed bath&beyond 2001ar_bbby2finance44
 

Similar to Wells Fargo Case Study (20)

northan trust corp.2005SummaryAnnual
northan trust corp.2005SummaryAnnualnorthan trust corp.2005SummaryAnnual
northan trust corp.2005SummaryAnnual
 
Fm
FmFm
Fm
 
American Express Centurion Bank2006
American Express Centurion Bank2006American Express Centurion Bank2006
American Express Centurion Bank2006
 
Analysis of the Federal Reserve's Balance Sheet
Analysis of the Federal Reserve's Balance SheetAnalysis of the Federal Reserve's Balance Sheet
Analysis of the Federal Reserve's Balance Sheet
 
An Analysis of Berkshire Hathaway
An Analysis of Berkshire HathawayAn Analysis of Berkshire Hathaway
An Analysis of Berkshire Hathaway
 
Expeditors International of Washington, 2nd05qer
Expeditors International of Washington, 2nd05qerExpeditors International of Washington, 2nd05qer
Expeditors International of Washington, 2nd05qer
 
Expeditors International of Washington, 4th03qer
Expeditors International of Washington, 4th03qerExpeditors International of Washington, 4th03qer
Expeditors International of Washington, 4th03qer
 
csx 02 annual
csx 02 annualcsx 02 annual
csx 02 annual
 
csx 02 annual
csx 02 annualcsx 02 annual
csx 02 annual
 
Expeditors International of Washington, 3rd05qer
Expeditors International of Washington, 3rd05qerExpeditors International of Washington, 3rd05qer
Expeditors International of Washington, 3rd05qer
 
Expeditors International of Washington, 1st05qer
Expeditors International of Washington, 1st05qerExpeditors International of Washington, 1st05qer
Expeditors International of Washington, 1st05qer
 
SLM Q408EarningsStatisticsFinal
SLM  Q408EarningsStatisticsFinalSLM  Q408EarningsStatisticsFinal
SLM Q408EarningsStatisticsFinal
 
Access 4 Q11 Earnings
Access 4 Q11 EarningsAccess 4 Q11 Earnings
Access 4 Q11 Earnings
 
Investment Analysis Final Project
Investment Analysis  Final ProjectInvestment Analysis  Final Project
Investment Analysis Final Project
 
Chapter 3 slide.ppt(1)
Chapter 3 slide.ppt(1)Chapter 3 slide.ppt(1)
Chapter 3 slide.ppt(1)
 
Q2 2009 Earning Report of Webster Financial Corp.
Q2 2009 Earning Report of Webster Financial Corp.Q2 2009 Earning Report of Webster Financial Corp.
Q2 2009 Earning Report of Webster Financial Corp.
 
bed bath&beyond 2004ar
bed bath&beyond 2004arbed bath&beyond 2004ar
bed bath&beyond 2004ar
 
bed bath&beyond 2004ar
bed bath&beyond 2004arbed bath&beyond 2004ar
bed bath&beyond 2004ar
 
ConAgra Q4Jul04
ConAgra Q4Jul04ConAgra Q4Jul04
ConAgra Q4Jul04
 
bed bath&beyond 2001ar_bbby2
bed bath&beyond 2001ar_bbby2bed bath&beyond 2001ar_bbby2
bed bath&beyond 2001ar_bbby2
 

Wells Fargo Case Study

  • 1. Running head: Wells Fargo Case Study 1 Wells Fargo Case Study Daniel Davis Liberty University Business 400-B02 Professor Nicole Lowes
  • 2. Wells Fargo Case Study 2 Abstract Using the case study in our textbook on page 111-119, the purpose of this paper is to answer the following questions: How should Wells Fargo Position itself for the future? Should it strengthen its retail presence, grow internationally, or move into the void created by the disappearance of investment banks? Develop Projected Financial Statements that fully assess and evaluate the impact of the proposed strategy. How are the acquisitions/growth financed? Will debt be increased further, or ownership of WFC stock be diluted to raise the capital needed? The author will attempt to answer these questions using charts and graphs as illustrations and supporting evidence.
  • 3. Wells Fargo Case Study 3 Wells Fargo Case Study Executive Summary The paper submitted will contain a proposed plan of action using primarily data from Morningstar to show a proposed acquisition for Wells Fargo. This acquisition will greatly increase the Wealth, Brokerage, & Retirement segment of Wells Fargo that has been underutilized and overlooked. This proposal will “marry” the benefits of TD Ameritrade with the Cross-selling strength of Wells Fargo. The primary purpose that TD Ameritrade was selected was convenience. Although Charles Schwab and E*TRADE are competitors of TD Ameritrade, but they were not selected for varying reasons. Charles Schwab has a history of refusing overtures for takeovers after his disappointing episode of being bought up by a large corporation many years ago. E*TRADE, whom some experts consider having a higher upside than TD Ameritrade, is not nearly as stable or financially sound. Given the current economic uncertainty and the authors penchant for avoiding risk, TD Ameritrade is the best option available of the large independent retail brokerages. According to Zacks Equity Research, an interesting side note is “that Wells Capital Management, the wholly owned institutional asset management subsidiary of Wells Fargo Bank, N.A., and part of Wells Fargo’s Asset Management Group” (Zacks Equity Research, 2011) already owns about 2.58% of TD Ameritrade. (Morningstar.com, 2012) How should Wells Fargo Position itself for the future? Wells Fargo can position itself for the future by capitalizing on its one-stop shopping format for all financial products. Already with one of the highest cross-selling ratios in the world “…at 5.81 products per banking household…” this number can and should go higher in the not too distant future. (APA editorial, 2009)
  • 4. Wells Fargo Case Study 4 According to the 2010 Annual Report for Wells Fargo, they have set an internal target of 8 products per banking household out of about 16 products normally available. While this may seem excessive, a brief look at the historical data suggests that this focus is working exceptionally well. The 1999-2010 Annual Reports along with revenue date from Morningstar shows year over year growth in the number of products per household and that information has corresponded to a rise in Total Revenue: Year Banking Products per Household Total Revenue 1999 3.2 18,091,000,000 2000 3.4 19,708,000,000 2001 3.7 20,150,000,000 2002 3.8 24,496,000,000 2003 4.2 28,389,000,000 2004 4.3 30,059,000,000 2005 4.6 32,949,000,000 2006 4.8 35,691,000,000 2007 5.2 39,390,000,000 2008 5.5 41,897,000,000 2009 5.7 88,686,000,000 2010 5.9 85,210,000,000 (Morningstar.com, Accessed on 2012) and (Wells Fargo, 2010,2009,2008,2007,2006,2005,2004,2003,2001,2001,2000,1999) Should it strengthen its retail presence, grow internationally, or move into the void created by the disappearance of investment banks? Over the past few months, Wells Fargo has been on a buying spree. In December 2011, it was announced by Zacks Equity Research that Wells Fargo had “acquired investment boutique firm EverKey Global Partners”. (Zacks Equity Research, 2011)
  • 5. Wells Fargo Case Study 5 On February 21, 2012, Reuters announced Wells Fargo was purchasing the BNP Paribas energy lending unit as some European banks have started shedding assets the credit crunch overseas has been getting progressively worse. (Rothacker, 2012) This buying spree has already been financed in some way, but the main strength of Wells Fargo has been expanding its line of products to existing customers. Expanding the Wholesale Banking segment would fund its acquisitions in the Wealth, Brokerage, & Retirement Segments. For Example, Chrysler Inc. and GM have made some headlines recently with indications that they are looking to give Wells Fargo control of an auto financing partnership. As of March 1, 2012, only GM has made the decision to do so. (http://media.gm.com, 2012) Looking over the business segment results in Case Study 11 on page 117 of our textbook, the Wealth, Brokerage & Retirement Services stands out as the weakest segment. This particular segment could benefit from Cross-selling services the most. My assertion is that Wells Fargo should aggressively expand its offerings of investment services by purchasing TD Ameritrade. This would strengthen its electronic brokerage business and diversify its complementary investment portfolio by offering a wider range of services. This backwards integration would make sense for Wells Fargo and give it an online presence in one of the few independent firms that have survived in the online brokerage business. Develop Projected Financial Statements that fully assess and evaluate the impact of the proposed strategy. Included is the Projected Combined Balance Sheet, Income Statement, Statement of Cash Flow. This acquisition would give Wells Fargo about 5.6 million online brokerage accounts.
  • 6. Wells Fargo Case Study 6 Wells Fargo Projected Combined Balance Sheet Enter Expected Growth Rate: 3% Fiscal year ends in December. 2011 2012 Assets Cash and due from banks $ 20,472 $ 21,086 Deposits with banks $ - $ - Federal funds sold $ 44,367 $ 45,698 Trading assets $ 77,814 $ 80,148 Debt securities $ 222,613 $ 229,291 Loans $ 819,326 $ 843,906 Allowance for loan losses $ (19,372) $ (19,953) Net loans $ 799,954 $ 823,953 Receivables $ 40,562 $ 41,779 Premises and equipment $ 9,872 $ 10,168 Goodwill $ 27,582 $ 28,409 Other intangible assets $ 23,985 $ 24,705 Other assets $ 63,325 $ 65,225 Securities and investments $ 447 $ 460 Total assets $ 2,130,947 $ 2,194,875 Liabilities and stockholders' equity $ - Liabilities $ - Deposits $ 920,070 $ 947,672 Short-term borrowing $ 49,091 $ 50,564 Long-term debt $ 126,691 $ 122,890 Other liabilities $ 80,091 $ 82,494 Payables $ 10,693 $ 11,014 Total liabilities $ 1,186,636 $ 1,214,634 Stockholders' equity $ - Preferred stock $ 11,431 $ 11,088 Common stock $ 8,937 $ 8,669 Other Equity $ (926) $ (898) Additional paid-in capital $ 57,540 $ 59,266 Retained earnings $ 68,031 $ 70,072 Treasury stock $ (3,864) $ (3,748) Accumulated other comprehensive income $ 3,207 $ 3,303 Total stockholders' equity $ 144,356 $ 147,752 Total liabilities and stockholders' equity $ 1,330,992 $ 1,362,386
  • 7. Wells Fargo Case Study 7 Wells Fargo & Co (WFC) Frojected Combined Income Statement Enter Expected Growth Rate: 3.00% Fiscal year ends in December. 2011 2012 Revenue Interest income $ 497 $ 512 Loans and Leases $ 38,949 $ 40,117 Securities $ 8,475 $ 8,729 Trading assets $ 1,440 $ 1,483 Other assets $ (48,864) $ (47,398) Other income $ 2,271 $ 2,339 Total interest income $ 2,768 $ 5,783 Interest expense $ 37 $ 38 Deposits $ 2,275 $ 2,343 Short-term borrowing $ 80 $ 82 Long-term debt $ 3,978 $ 4,097 Other expense $ (6,333) $ (6,143) Total interest expense $ 37 $ 418 Net interest income $ 2,731 $ 5,365 Noninterest revenue Commissions and fees $ 23,430 $ 24,133 Principal transactions $ 1,014 $ 1,044 Equity investment income $ 1,482 $ 1,526 Lending and deposit-related fees $ 4,280 $ 4,408 Securities gains (losses) $ 54 $ 56 Credit card income $ 3,653 $ 3,763 Other income $ (33,913) $ (32,896) Total noninterest revenue $ - $ 2,035 Total net revenue $ 2,731 $ 7,400 Provisions for credit losses $ (49,412) $ (50,894) Noninterest expenses Compensation and benefits $ 19,485 $ 20,070 Occupancy expense $ 3,011 $ 3,101 Tech, communication and equipment $ 2,283 $ 2,351 Amortization of intangibles $ 1,977 $ 2,036 Other expenses $ (25,465) $ (24,701) Total noninterest expenses $ 1,291 $ 2,858 Income (loss) from cont ops before taxes $ 50,852 $ 55,436 Provision (benefit) for taxes $ 7,824 $ 8,059 Other income (expense) $ (26,098) $ (26,881) Net income $ 69,126 $ 74,259 Preferred dividend $ 844 $ 869 Net income available to common shareholders $ 68,282 $ 73,389
  • 8. Wells Fargo Case Study 8 Wells Fargo & Co (WFC) Projected Statement of Cash Flow Enter Expected Growth Rate: 3.00% Fiscal year ends in December 2011 2012 Cash Flows From Operating Activities Net income $ 16,849 $ 17,354 Provision for credit losses $ 7,899 $ 8,136 Depreciation & amortization $ 2,372 $ 2,443 Deferred tax (benefit) expense $ 2 $ 2 Stock based compensation $ 564 $ 581 Receivable $ (739) $ (761) Accrued liabilities $ 2,638 $ 2,717 Interest payable $ 1,582 $ 1,629 Other assets and liabilities $ 25,915 $ 26,692 Other operating activities $ (42,603) $ (41,325) Investments (gains) losses $ (2) $ (2) Deferred charges $ (21) $ (20) Net cash provided by operating activities $ 14,456 $ 17,447 Cash Flows From Investing Activities Sales/maturity of investments $ 111,950 $ 115,309 Purchases of investments $ (121,244) $ (124,881) Acquisitions and dispositions $ (351) $ (362) Property, and equipments, net $ (153) $ (158) Other investing activities $ 10,344 $ 10,654 Changes in loans, net $ (35,749) $ (34,677) Net cash used for investing activities $ (35,203) $ (34,114) Cash Flows From Financing Activities Change in deposits $ 72,128 $ 74,292 Change in federal funds purchased $ 119 $ 123 Long-term debt issued $ 11,687 $ 11,336 Long-term debt repayment $ (50,559) $ (52,076) Excess tax benefit from stock based compensation $ 79 $ 81 Repurchases of treasury stock $ (2,765) $ (2,848) Cash dividends paid $ (3,495) $ (3,600) Other financing activities $ (332) $ (342) Change in short-term borrowing $ (6,231) $ (6,044) Common stock issued $ 1,296 $ 1,257 Preferred stock issued $ 2,501 $ 2,426 Net cash provided by (used for) financing activities $ 24,428 $ 24,606 Effect of exchange rate changes $ - $ - Net change in cash $ 3,681 $ 7,939 Cash at beginning of period $ 16,785 $ 20,472 Cash at end of period $ 20,472 $ 28,411
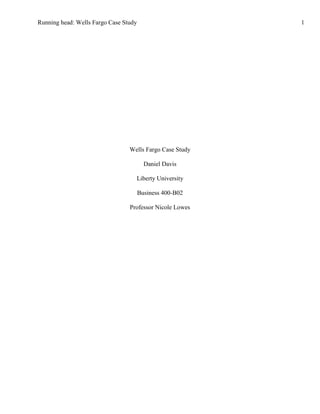
  • 9. Wells Fargo Case Study 9 The combined company would effectively merge TD Ameritrade’s online retail discount brokerage with Wells Fargo sophisticated cross-selling strategy and further expand consumer options along the entire spectrum of products. How are the acquisitions/growth financed? Using the chart as a guide, the best option seems to be a common stock financed path. EPS/EBIT Analysis 16.00 8.00 EPS 4.00 Common Stock Financing Debt Financing 70% Stock 2.00 70.00% Debt 1.00 $35,571.00 $50,582.00 $66,133.00 EBIT This returns the highest levels of growth to the shareholders and seems the most reasonable. However, looking over the cash flows for Wells Fargo, it becomes clear with almost 20 billion dollars of cash on hand at the beginning of 2012, they could almost entirely buy TD Ameritrade directly. (Morningstar.com, 2012) A more probable course of action is to fund the acquisition using cash on hand for about 50% and then issuing common stock for the remaining 50% purchase.
  • 10. Wells Fargo Case Study 10 Will debt be increased further, or ownership of WFC stock be diluted to raise the capital needed? As suggested above, the best possible solution would dilute Wells Fargo stock, but given the overwhelming strength of the company, it is difficult to see where this would become a serious concern. TD Ameritrade is approximately 1/10 the size of Wells Fargo and is on very good financial footing itself. In conclusion, this assignment was extremely thought provoking and an excellent excuse to spend a lot of time using excel and researching financial data.
  • 11. Wells Fargo Case Study 11 References APA editorial. (2009, May 4). Bankinter tops global cross-selling league. Retrieved from http://www.vrl- financial-news.com: http://www.vrl-financial-news.com/bpa/banking--payments- asia/issues/bpa-2009/bpa3/bankinter-tops-global-cross-se.aspx http://media.gm.com. (2012, March 1). GM and Wells Fargo Launch Auto Financing Partnership. Retrieved from http://media.gm.com: http://media.gm.com/media/us/en/gm/news.detail.html/content/Pages/news/us/en/2012/Ma r/0301_wellsfargo Morningstar.com. (2012, March 2). Financials: Cash Flow. Retrieved from http://www.morningstar.com: http://financials.morningstar.com/cash-flow/cf.html?t=WFC&region=USA&culture=en-us Morningstar.com. (Accessed on 2012, March 1). Key Ratios. Retrieved from Morningstar.com: http://financials.morningstar.com/ratios/r.html?t=WFC&region=USA&culture=en-us Rothacker, R. (2012, February 21). Wells Fargo buys BNP Paribas energy lending unit. Retrieved from http://www.reuters.com: http://www.reuters.com/article/2012/02/22/us-wellsfargo- acquisition-idUSTRE81L00O20120222 Wells Fargo. (2010,2009,2008,2007,2006,2005,2004,2003,2001,2001,2000,1999). 2010 Annual Report. Zacks Equity Research. (2011, December 16). Wells Fargo to Acquire EverKey. Retrieved from http://www.zacks.com: http://www.zacks.com/stock/news/66480/Wells+Fargo+to+Acquire+EverKey