A Critique of the Proposed National Education Policy Reform
Jana Diesner, "Words and Networks: Considering the Content of Text Data for Network Analysis"
1. Words and Networks:
Considering the Content of Text Data
for Network Analysis
Jana Diesner
Assistant Professor
The iSchool, University of Illinois at Urbana-Champaign
Talk at Summer Social Webshop 2012
1
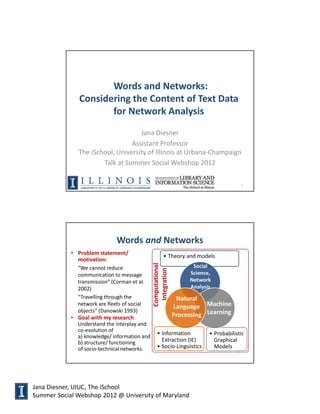
Words and Networks
• Problem statement/
• Theory and models
motivation:
Computational
“We cannot reduce Social
Integration
communication to message Science,
transmission” (Corman et al. Network
2002) Analysis
“Travelling through the Natural
network are fleets of social
Language Machine
objects” (Danowski 1993)
• Goal with my research: Processing Learning
Understand the interplay and
co-evolution of
• Information • Probabilistic
a) knowledge/ information and
b) structure/ functioning Extraction (IE) Graphical
of socio-technical networks. • Socio-Linguistics Models
2
Jana Diesner, UIUC, The iSchool
Summer Social Webshop 2012 @ University of Maryland
2. Classic Approach: Semantic Networks
Collins and Loftus (1975). A spreading activation theory of semantic
memory. Psychological Review, 82, 407-428.
Overview: From Words to Networks
Text Data Network Data Applications
• Unstructured • Need: scalable, • Network Analysis
• At any scale reliable, robust • Answer substantive
methods & tools and graph-theoretic
questions
• Visualizations
• Develop and test
hypothesis and
theories
• Populate databases
• Input to further
computations, e.g.
simulations, machine
learning
4
Jana Diesner, UIUC, The iSchool
Summer Social Webshop 2012 @ University of Maryland
3. Example for application context: Sudan
Problem: Develop, evaluate and apply a methodology and
computational solution for extracting socio-technical network
data from large-scale text corpora.
Paper: Diesner J, Tamabyong L, Carley KM (accepted) Mapping socio-cultural networks of
Sudan from open-source, large-scale text data. Journal of Computational and
Mathematical Organization Theory.
Methods for Constructing
Networks of Words
1. Mental Models (Spreading Activation) (Collins & Loftus 1975)
2. Case Grammar and Frame Semantics (Fillmore 1982, 1986)
3. Discourse Representation Theory (Kamp 1981)
4. Knowledge representation in AI, assertional semantic networks
(Shapiro 1971, Woods 1975)
Generalization
5. Centering Resonance Analysis (Corman et al. 2002)
Automation
Abstraction
6. Mind maps (Buzan 1974)
7. Concept maps (Novak & Gowin 1984)
8. Hypertext (Trigg & Weiser 1986)
9. Qualitative text coding (Grounded Theory) (Glaser & Strauss 1967)
10. Definitional semantic networks incl. text coding with ontologies
(Fellbaum 1998)
11. Semantic Web (Berners-Lee et al. 2001, Van Atteveldt 2008)
12. Frames (Minsky 1974)
13. Semantic Grammars (Franzosi 1989, Roberts 1997)
14. Network Text Analysis in social science (Carley & Palmquist 1991)
15. Event Coding in pol. science (King & Lowe 2003, Schrodt et al. 2008)
16. Semantic networks in comm. science (Danowski 1993, Doerfel 1998)
17. Probabilistic graphical models (Howard 1989, Pearl 1988) 6
Jana Diesner, UIUC, The iSchool
Summer Social Webshop 2012 @ University of Maryland
4. Nodes for Networks:
Named Entities and Beyond
Where? Who?
(places) (people, groups)
What? When?
(tasks, (time)
events)
Food UN
Sudan
How? Conflict Oil
(resources, Why?
Security (beliefs, sentiments,
knowledge)
mental models) 7
Recipe for using machine learning to build a
prediction model for text data
• Get some labeled ground-truth data
• Build a classifier/model (h) that for every
sequence of words (x) and label per word (y)
predicts one category per word (y = h (x)),
incl. for new and unseen text data
• Exploit many clues from the text data (lexical,
syntactic, statistical)
• Train and validate the model
• 87% to 89% accuracy (compare to intercoder
reliability)
• Make model available in end-user product
Jana Diesner, UIUC, The iSchool
Summer Social Webshop 2012 @ University of Maryland
5. Recipe for extraction network data from text
data
• Use prediction model to extract entities from
text data, consider them as nodes
– Applied to about 80,000 text data documents
• Link the nodes according to
– Proximity
– Surface patterns
– Syntax
– Statistical information
Results
Activity: Control: Close to power:
Degree Centrality 03 04 05 06 07 08 09 10 Betweenness Centr. 03 04 05 06 07 08 09 10 Eigenvector Centr. 03 04 05 06 07 08 09 10
Omar al-Bashir 3 3 2 1 1 1 1 1 Omar al-Bashir 1 1 1 1 1 1 1 1 Ali Osman Taha 1 2 3 3 3 3 3 4
Ali Osman Taha 1 2 3 4 3 3 3 3 Salva Kiir Mayardit 6 10 2 5 2 2 2 2 Omar al-Bashir 3 3 5 2 2 2 2 3
John Garang 2 1 1 3 3 4 6 8 Ali Osman Taha 4 3 3 7 6 7 5 4 Salva Kiir Mayardit 7 10 4 1 1 1 1 1
Salva Kiir Mayardit 8 10 4 2 2 2 2 2 John Garang 3 6 5 4 4 6 7 7 John Garang 2 1 1 4 4 4 7 9
Hosni Mubarak 4 7 5 6 9 8 4 6 Sadiq al-Mahdi 2 8 10 2 7 5 6 3 Hosni Mubarak 4 5 6 5 11 5 4 7
Sadiq al-Mahdi 6 5 10 9 5 7 8 4 Abdul Wahid al Nur 8 4 7 8 3 4 3 6 Kofi Annan 8 4 7 6 6 11 11 1
Hassan al-Turabi 5 6 7 10 5 8 9 5 Kofi Annan 7 2 4 3 10 11 8 10 Yoweri Museveni 9 8 8 7 9 6 5 8
Abdul Wahid al Nur 10 9 9 8 7 4 5 7 Yoweri Museveni 5 5 9 6 5 9 8 10 Hassan al-Turabi 5 7 10 8 8 10 8 5
Yoweri Museveni 7 8 7 6 11 10 7 8 Deng Alor 8 10 10 9 9 3 8 5 Sadiq al-Mahdi 6 6 9 9 7 8 10 6
Kofi Annan 9 4 6 5 8 11 11 11 Hosni Mubarak 8 9 8 11 8 8 4 8 Deng Alor 11 11 1 10 5 7 9 10
Deng Alor 11 11 11 11 10 6 9 8 Hassan al-Turabi 8 7 6 10 11 10 8 9 Abdul Wahid al Nur 10 9 11 11 10 9 6 11
Triads 03 04 05 06 07 08 09 10
Omar al-Bashir
Ali Osman Taha
1 1 1 1 1 1 1 1 • President North: Known performer
2 3 3 4 4 3 2 2
John Garang
Salva Kiir Mayardit
3 2 2
7 10 4
2
3
2 6
3 2
7
3
7
3 • President South: Now established
Hosni Mubarak 7 4 5 6 6 8 4 5
Sadiq al-Mahdi
Abdul Wahid al Nur
4 7 7
10 9 9
7
7
6 7
4 5
7
5
3
7
• Legacy of religious leaders
Kofi Annan 7 5 5 5 11 11 7 7
Yoweri Museveni 6 6 8 9 9 10 6 5 • Presence of neighboring
Hassan al-Turabi 5 8 9 9 8 9 7 7
Deng Alor 10 10 9 9 10 4 7 7 presidents
2003 2004 2005 2007 2010
Darfur Continuous Comprehensive Peace Agreement SPLA withdraws Votum in South Sudan
conflict civil war (since Garang 1st VP, followed by Kiir from government about Separation
10
1993) Autonomous South Sudan
Jana Diesner, UIUC, The iSchool
Summer Social Webshop 2012 @ University of Maryland
6. Prominent Organizations
Degree Centrality 0304 05 06 07 08 09 10 Betweenness Centr. 0304 05 06 07 08 09 10 Eigenvector Centr. 0304 05 06 07 08 09 10
United Nations 4 2 1 1 1 1 1 5 Military 1 1 3 3 1 1 2 1 United Nations 4 2 1 2 1 2 1 5
Rebel Groups 1 1 2 3 4 3 2 3 United Nations 3 6 2 2 3 2 1 3 Military 2 3 3 1 2 1 5 2
Military 2 3 3 2 2 2 4 2 SPLA # 3 1 1 2 3 5 2 Rebel Groups 1 1 4 3 4 3 6 3
SPLA # 6 5 4 3 4 3 1 Rebel Groups 4 2 4 4 7 5 3 4 Security Council 5 5 2 4 5 4 2 8
Security Council 5 5 4 5 5 5 5 6 Sudan government 2 4 5 8 4 7 6 10 SPLA # 6 5 5 3 5 7 1
Sudan government 3 4 6 6 8 8 9 7 Nat. Congress Party 6 9 8 5 5 4 8 7 Sudan government 3 4 7 6 8 7 8 6
Nat. Congress Party 6 9 9 8 6 7 10 4 Churches 5 7 9 10 6 6 9 9 African Union 8 7 8 7 6 9 4 10
African Union 8 7 8 7 7 9 7 10 Dinka 8 5 6 6 8 11 11 6 Inter. Criminal Court # 10 6 9 9 6 3 7
Inter. Criminal Court # 11 7 11 9 6 6 9 African Union 7 8 7 11 10 10 10 5 Nat. Congress Party 6 9 10 8 7 8 9 4
Dinka 9 10 11 9 10 10 8 8 Inter. Criminal Court # 11 10 9 9 8 4 11 Churches 7 8 9 10 10 10 10 11
Churches 7 8 10 10 11 11 11 11 Security Council 9 10 11 7 11 9 7 8 Dinka 9 11 11 11 11 11 11 9
Triads
Military
0304 05
1 1 1
06 07 08
1 2 1
09 10
6 1
• Strong presence of armed forces
United Nations
Rebel Groups
4 3 2
2 2 4
2 1 4
4 4 2
1 2
4 5 • Strong influence of external groups
SPLA # 5 3 3 3 3 2 4
Sudan government
Nat. Congress Party
3 4 5
5 9 10
7 5 7
8 6 6
4 6
9 3
• Not shown from top 10 Sudanese
African Union
Security Council
8 6 6
7 7 7
6 7 10
5 8 9
7 9
8 8
groups:
Inter. Criminal Court
Churches
# 11 8
6 8 9
9 10 5
10 9 8
3 7
10 11
– Janjaweed, Nuer, Oil and gas
Dinka 9 10 11 11 11 11 11 10 corporation, prisons and jails
• Two ethnic groups/ tribes among top
ten Sudanese groups 11
What themes connect tribes?
Degree Centrality (Activity)
2003 2004 2005 2006
population conflict population conflict
conflict kinship conflict population
cultural population cultural kinship
peace_making pol_boundary kinship cultural
biomes_land_cover biomes_land_cover pol_boundary pol_boundary
2007 2008 2009 2010
population pol_boundary pol_boundary kinship
conflict population conflict peace_making
kinship measures_num. peace_making conflict
cultural conflict cultural pol_boundary
peace_making cultural kinship cultural
Betweenness Centrality (Bridging)
2003 2004 2005 2006
industry economy water_mgmt. climate_change
measures_num. hunger discourse subsistence
emotion labor disaster disaster
rumors ideology_political environment ideology_religion
disaster preposition aid water_mgmt.
2007 2008 2009 2010
ideology_religion finance education emotion
welfare preposition literature law
security_forces ideology_political war internal_conflict
political prejudice_discrim. ideology_pol. kinship
12
water_mgmt. economy health age
Jana Diesner, UIUC, The iSchool
Summer Social Webshop 2012 @ University of Maryland
7. 2003 2004 2005
2006 2007 2008
Year Number Tribes linked Intertribal links
of to conflict or for pairs linked
tribes war to conflict or war
• High and increasing rate of tribes
2003
2004
32
44
38%
45%
32%
66%
associated with conflict or war
2005
2006
33
46
39%
50%
40%
83%
• Many of links between tribes for
2007
2008
47
50
62%
60%
78%
65%
tribes associated with conflict and
2009 28 68% 95% war 13
2010 27 56% 100%
What resources are associated with war and
conflict?
• Conflict: Agriculture, Livestock (farmers vs. herders)
• War: Land Resource (concept of dar)
• Conflict and War: Oil, Civic, Transportation 14
Jana Diesner, UIUC, The iSchool
Summer Social Webshop 2012 @ University of Maryland
8. 15
From Words to Networks:
Dimensions of Accuracy
Hmm,
I fine-tuned our
Information
method and
Extraction looks
technology based
like a nice idea.
on F-values and
How accurate are
feedback from
your results?
SMEs.
The F values
tell me all I
But the F only shows the
need to know.
increase in accuracy over
a baseline or
benchmark. Maybe we
need to ask a different
question…
Research Question
– Problem: Impact of Relation Extraction methods and
subroutines on network data and analysis results
unknown
– Question: How do network data and analysis results differ
depending on specific relation extraction methods?
– Who cares?
– Increased comparability, generalizability,
transparency of methods and tools
– Increased control and power for developers and users
– Supports drawing of reasonable and valid conclusions
• Paper: Diesner J, Carley KM (2012) Impact of Relation Extraction Methods
from Text Data on Network Data and Analysis Results. ACM Web Science
16
Conference, Words and Networks Workshop (WON 2012), Evanston, IL
Jana Diesner, UIUC, The iSchool
Summer Social Webshop 2012 @ University of Maryland
9. Methods
17
18
Data
Sudan Corpus Funding Corpus Enron Corpus
Genre Newswire Scientific Writing Emails
Size 80,000 articles 56,000 proposals 53,000 emails
Source LexisNexis Cordis FERC/ SEC
Time span 8 years 22 years 4 years
Text-based Article bodies Project description Email bodies
networks
Meta-data Index terms Index terms Email headers (social)
network (knowledge) (knowledge) and
collaborators (social)
• All: large scale, over time, open source data from different domains
Jana Diesner, UIUC, The iSchool
Summer Social Webshop 2012 @ University of Maryland
10. Results: Performance of node prediction
models in application domains
• Method: systematic evaluation of auto-generated thesauri
on all 3 datasets
• No meaningful differences in accuracy across domains, time,
writing styles
– Technology generalizes AND generalizes better than manually
built thesauri
– Creation and refinement more efficient (time) and effective
(finding nodes) than manually built thesauri
• Subtype “specific” more unique/different instances, but
“generic” far more total instances
– Rethink focus of network analysis:
• More references to roles and collectives than to individuals
• Importance of extracting unnamed entities
• Specific” instances lower accuracy than “generic” ones due
to sparseness 19
Results: How do relation extraction methods
compare?
• Ground truth data (SME) hardly resembled by
analyzing text bodies, not at all by meta-data
networks
• SME in TextM: 53% nodes 20% links
• SME in TextA: 11% nodes, 5% edges
• Agreement in structure and key entities mainly
function of:
• Size of extracted graph
• External material/ sources used
• Post-processing/ cleaning
– Agreement can be coincidental if no proper word
sense disambiguation performed
• Type of network
20
Jana Diesner, UIUC, The iSchool
Summer Social Webshop 2012 @ University of Maryland
11. Results: How do relation extraction methods
compare?
3. Type Text-Based Networks Meta-Data Network
Agreement between text-based, and with meta-data
Social depends on type of network - Small overlap in key entities
- Substantial overlap TextM
networks and TextA, esp. key players with text-based networks
(identity, rank) - Key players: major
- Localized view on geo- international agents, hardly
political entities and culture localized views
Knowledge - Minimal overlap between - Seem more informative
networks manual and automated (crafted mini-summaries)
- Gist of information in terms -Less coreference resolution
of common sense, highly issues
salient entities - Minimal overlap with text-
based
For more complete view, combine automated text-based
with meta-data network
21
Cover common/highly salient terms and entities and domain-specific ones
Behavioral Data Data management
Utilization
and analysis
• Enhance social
network data with
content nodes in a
none-arbitrary
Database
fashion
• Combine social
networks and
Interaction data semantic networks
• Cluster social
Data integration networks and
and management compare content per
group
• Reveal
alliances,
factions,
Text data redundancies
Analysis tools
Jana Diesner, UIUC, The iSchool
Summer Social Webshop 2012 @ University of Maryland
12. Research Question
• Question: What
thematic profiles are Change agents
used by individuals or
groups who assume
theoretically grounded
roles that make them
prone to actuate or
inhibit changes and
innovation in socio-
technical networks? Preservation agents
Paper: Diesner J, Carley KM (2010) A methodology for integrating network theory and topic modeling and its
application to innovation diffusion. IEEE International Conference on Social Computing (SocComp), Workshop
on Finding Synergies Between Texts and Networks, Minneapolis, MN, August 2010. 23
Theory for relationship between
language and networks
• Socio-linguistic theory (Milroy & Milroy 1985):
– Structural position/role of agents in networks impacts their
motivation and ability to introduce or adopt changes in system.
– Network features more powerful explanation of language change
than alterative extra-linguistic factors (status, class, socio-
demographics).
• Structural roles:
– Innovators: marginal to adopting group, globally peripheral,
mobile, under-conforming to deviant, many weak ties.
– Early adopters: central & strongly tied members of adoption group.
– Late adopters: members of dense, multiplex, close-knit networks
benefit from organizational capabilities (support, resistance to
external pressures) and are constrained by them.
Jana Diesner, UIUC, The iSchool
Summer Social Webshop 2012 @ University of Maryland
14. Methodology: Text Analysis
• Analysis of substance of language data via Topic
Modeling:
– Reduces dimensionality of text data to gist of a body of
information (Griffiths, Steyvers & Tenenbaum, 2007)
– Output: user-defined number of words clusters (topics)
– Topic: text terms, where each term has probabilistic
weight indicates strength of association of term with
topic.
– Tool: Mallet (McCallum)
27
Methodology: Computational Integration
of Texts and Networks
Topic Modeling
some latent process
structure, probabilistic
graphical model
Social
Process
Generative
Probabilistic
Inference
Bayesian
Network
Analysis
Preservation Change
Agents Agents
28
Image from: Wikipedia, Latent Dirichlet allocation
Jana Diesner, UIUC, The iSchool
Summer Social Webshop 2012 @ University of Maryland
15. Results for FP 6 (2002-2006)
change agents
networking regional
project project waste alternative emission emission public regional
topic and developmen engineering medical
management management management energies reduction reduction health development
learning t,
1st project research data regional water structures energy water engine food services tnf
2nd development european management policy waste aircraft gas monitoring diesel europe ict disease
3rd systems europe assessment regions european material hydrogen eu combustion human business gene
4th system network tools policies europe materials combustion chemical fuel virus satellite arthritis
5th based innovation project development land performance biomass pollutants sensor studies rural human
6th high knowledge information sustainable market composite solar directive emission million information mouse
7th develop training fisheries region eu damping fuel system integrated developing robot genes
8th technologies projects support national smes forming low pollution power health communication diseases
9th control support studies sustainability aquaculture monitoring process groundwater emissions forest systems mice
DP 0.731 0.276 0.165 0.080 0.070 0.055 0.053 0.050 0.046 0.044 0.038 0.036
preservation agents
project research in networking environment transportati public
topic industry genetics energy cancer security industry
management EU and learning al issues on health
1st project research production research water genetic energy services drug governance materials food
2nd european european products network management gene environmentaltransport clinical security properties consumer
3rd development activities industry european risk genes eu solutions cancer social devices quality
4th develop countries design excellence environmentaldisease policy business cell science temperature products
5th research information manufacturing integration data genomic assessment information cells eu techniques production
6th systems eu product training monitoring factors agricultural cities hiv issues high animal
7th based projects industrial europe information molecular european end tumour public industrial safety
8th integrated europe processes knowledge assessment genomics sustainable service therapeutic ethical based health
9th knowledge action materials researchers practices studies impact data molecular europe structures project
DP 0.921 0.414 0.160 0.102 0.080 0.077 0.076 0.071 0.062 0.061 0.056 0.05529
Results FP6
Preservation agents Change agents
• Both: dominating topic • 2nd: “networking”, “training”
project management, PA’s (inherent to innovators?)
load higher on it • Term/ topics addressed only
• 2nd highest ranking topic for by them: “innovation”,
change agents: generic terms “waste”, “regional”
relating to research in the • Environment, sustainability,
European Union alternative energies,
• Topics addressed only by emission reduction: both, but
hubs: industry in the context more prevalent among
of manufacturing, nuclear change agents
energy, cancer research
30
Jana Diesner, UIUC, The iSchool
Summer Social Webshop 2012 @ University of Maryland
16. Results: FP4 – FP6
Fourth FP 1994–1998 Fifth FP 1998–2002 Sixth FP 2002–2006
change agent preserv. agent change agent preserv. agent change agent preserv. agent
project mngmt. 0.767 project mngmt. 0.708 project mngmt. 0.660 project mngmt. 0.765 project mngmt. 0.731 project mngmt. 0.921
industry 0.420 industry 0.326 industry 0.319 project mngmt. 0.315 networking & learning 0.276 project mngmt. 0.414
networking 0.171 environment 0.093 project mngmt. 0.214 transportation 0.234 project mngmt. 0.165 industry 0.160
climate 0.075 transportation 0.090 transportation 0.147 project mngmt. 0.230 regional development 0.080 networking & learning 0.102
environment & tech 0.065 environment 0.059 computing 0.137 material science 0.090 waste mngmt. 0.070 environment 0.080
material science 0.065 aviation 0.055 environment 0.092 public health 0.087 engineering 0.055 genetics 0.077
satellite data 0.062 aviation 0.048 genetics 0.080 genetics 0.074 energy 0.053 energy 0.076
environment & tech 0.057 e-commerce 0.045 public health 0.075 energy 0.065 pollution 0.050 transportation 0.071
energy 0.054 public health 0.040 aviation 0.057 genetics 0.064 emission 0.046 cancer 0.062
environment & tech 0.049 environment 0.036 material science 0.054 services & tech 0.063 public health 0.044 security 0.061
environment & tech 0.049 data mngmt. 0.030 genetics 0.051 aviation 0.062 regional development 0.038 industry 0.056
energy 0.043 environment 0.030 energy 0.050 ? 0.060 medical 0.036 public health 0.055
aviation 0.039 material science 0.028 environment 0.050 environment 0.057 automobiles 0.035 energy 0.043
environment & food 0.034 environment 0.025 public health 0.045 environment 0.055 transportation 0.029 emissions 0.040
energy 0.027 genetics 0.017 climate 0.044 emission 0.048 environmental 0.027 ecology & climate 0.039
pollution 0.026 medical 0.009 hightech 0.043 public health 0.045 medical 0.025 nuclear energy 0.039
genetics 0.015 environment 0.003 climate 0.040 climate 0.040 energy 0.025 aviation 0.031
services & tech 0.036 hightech 0.033 genetics 0.024 public health 0.024
environment 0.035 genetics 0.030
science 0.031 environment 0.026
• Trends over time:
• Change agents strongly associated with research related to the environment
and climate, preservation addressed this topic with lower weight.
• Preservation agents: focus on transportation and related industries.
• Topics occasionally overlap in subject matter but then differ in prevalence. 31
Limitations and What’s Next
• Limitations:
– Incomplete data, no rejected proposals.
– Validation of unsupervised learning results (Chang et al.
2009).
• Next steps:
– Very coarse level of aggregation: use more fine-grained
levels/ clusters (fields, socio-demographic attributes, …)
– Test robustness of role operationalization.
– Take award money and other meta data into account as
additional constraint.
– Investigate competition.
Jana Diesner, UIUC, The iSchool
Summer Social Webshop 2012 @ University of Maryland
17. Technology-Mediated Social Participation
1) Clarify national priorities
• Apply methods to analyze large collections of text data in application
contexts/ domains to reveal patterns and explain underlying mechanisms
2) Develop deep science questions
motivation, trust, empathy, responsibility, identity
3) Promote novel research methodologies
• Consider substance of text data for network analysis
• Combine two types of behavioral data (quantitative, qualitative) in
scalable, robust, systematic fashion
4) Identify extreme technology challenges
• Human side of security (protect not only technical infrastructures, but also
data and reputation)
• Scalability: make data sets analyzable that were traditionally assessed via
manual or computer-supported methods
5) Influence national policy
6) Increase educational opportunities
Acknowledgements
• This work was supported by the National Science
Foundation (NSF) IGERT 9972762, the Army Research
Institute (ARI) W91WAW07C0063, the Army Research
Laboratory (ARL/CTA) DAAD19-01- 2-0009, the Air Force
Office of Scientific Research (AFOSR) MURI FA9550-05-1-
0388, the Office of Naval Research (ONR) MURI
N00014-08-11186, and a Siebel Scholarship. Additional
support was provided by CASOS, the Center for
Computational Analysis of Social and Organizational
Systems at Carnegie Mellon University. The views and
conclusions contained in this paper are those of the
authors and should not be interpreted as representing the
official policies, either expressed or implied, of the NSF,
ARI, ARL, AFOSR, ONR, or the United States Government.
34
Jana Diesner, UIUC, The iSchool
Summer Social Webshop 2012 @ University of Maryland
18. Thank you!
• For questions, comments, feedback, follow-up:
Jana Diesner
jdiesner@illinois.edu
Phone: (217) 244-3576
• (Copies of) Publications at
http://people.lis.illinois.edu/~jdiesner/publications.h
tml 35
Jana Diesner, UIUC, The iSchool
Summer Social Webshop 2012 @ University of Maryland