SlideShare une entreprise Scribd logo
1  sur  11
Télécharger pour lire hors ligne
February 2012


Travel Management
    Category Sourcing Guide                                                       Authors
                                                                                  Tom Bokowy
     Corporate Travel, at $838 Billion Worldwide, represents one of the          +1 208 610 0032
      largest controllable cost categories for companies. Despite higher          tbokowy@costandcapital.com
      demand and rising costs, effective management of the travel category        Ryan Hatcher
      can manage spend and increase service levels.                               +1 617 459 0356
                                                                                  rhatcher@costandcapital.com
     Procurement’s role in corporate travel is increasing. Applying
      procurement tools such as benchmarking, consolidation, negotiation          Sebastian Fritz
      and demand management can deliver savings of 50% or more in some            +1 646 620 4204
      cases.                                                                      sfritz@costandcapital.com

     Assessorial charges and fees have been introduced by providers
                                                                                  Cost and Capital Partners is a
      and travel management companies. These fees are often referred to           management consulting firm that works
      in negotiations as “junk on the lawn.” The intent is to put fees and        with companies to improve cost and
      charges on the table to be traded away. Most corporate customers are        capital efficiency. Our client base
      not expected to pay these fees.                                             includes Fortune 1000 companies from
                                                                                  the industrial, automotive, electronics,
     Effective travel management must coordinate policy, rates and               hospitality, process, consumer goods,
      service levels. The complexity and breadth of requirements to execute       transportation    and    white    goods
      a best-in-class travel management program requires alignment with           industries. We work with clients to
                                                                                  improve results and enhance visibility
      internal stakeholders, travel management third parties and service
                                                                                  for strategy development. Supplier
      providers.                                                                  engagement is a core focus ranging
                                                                                  from direct supplier negotiations to
     Benchmarking can show achievable targets. Unlike other spend
                                                                                  market       and    financial   viability
      categories, external benchmarking of travel highlights rates and service    assessments. In addition to working
      levels secured by peer companies for similar and often identical            with clients to execute sourcing
      providers.                                                                  initiatives, we also deliver sourcing
                                                                                  training that enables organizations to
                                                                                  increase their level of professionalism
                                                                                  in supplier engagement.


Table of contents                                                                 For more information please visit our
                                                                                  website www.costandcapital.com

Introduction                                                                 2
Industry Overview                                                            2
Spend Visibility                                                             3
Opportunity Identification                                                   5
Negotiation Preparation                                                      7
Case Study: Hotel Rate Benchmarking                                          10
Conclusion                                                                   11
Travel Management                                                                                      February 2012


    Introduction
    Effective travel management requires an organization to have visibility into their spend, an approval process
    to direct and sometimes to restrict spending, rate optimization and the required documentation to track and
    manage the safety of employees. While most organizations use travel agents to manage travel, the value
    derived from their travel programs differs. According to American Express, travel and entertainment typically
    represents the second largest controllable expense for corporations. Tools to maximize the value from travel
    include consolidation, leverage, benchmarking and demand management.
    Best in class travel management programs balance the business need for travel and employee morale with
    cost management to deliver shareholder value. Since travel affects the majority of employees in a company
    and nearly 100% of the senior leadership, this category can become fraught with political tradeoffs and
    external influence into the sourcing process. Everyone agrees that that there is a difference between the
    Best Western and Hyatt as well as a coach flight with 3 connections compared to business class direct. What
    everyone has difficulty agreeing to is the value of one option to another.
    The responsibility for managing travel is increasingly coming under the domain of procurement. The ability of
    a procurement organization to perform a spend analysis, benchmark rates, audit fees, set service levels and
    leverage volume can yield savings of 50% compared to unmanaged travel.


    Industry Overview
    In 2010, companies spent about $838 billion for corporate travel and expenses, with the US representing
    about one third of the global market. According to American Express, travel and entertainment (T&E) is
    typically the second largest controllable expense for corporations (after salaries and benefits) and represents
    about 7% of an average company’s overall spend.

    The role of corporate travel management is to coordinate           Figure 1: Travel Management Illustration
    the needs of employees with travel service providers—
    airlines, hotels, car rental, etc. As seen in Figure 1, travel
    management must deal with a large number of users
    creating demand for travel services with a number of
    providers based on geography, needs, service levels and
    volume. Each user typically has unique needs such as the
    class of service, timing, pricing limits and the value of their
    travel need. When corporate travel management is at its
    best, it aligns the costs of business travel with the value to
    the organization for travel. Striking this balance is difficult.
    The right decision is not always the cheapest cost or the
    fastest and most comfortable option. Each user will value
    the timing and service differently. It is the role of corporate
    travel management to create the process, structure and
    policies to manage a large and unique spend. Most
    corporations use a third party to manage this spend to
    deliver the best prices for providers and enforce policies to
    limit demand.
    About 18% of the global managed corporate travel market
    is dominated by the four biggest travel management
    companies (TMC): American Express, BCD Travel, Carlson Wagonlit Travel and Hogg Robinson Group.
    Each reported 5-10% growth rates in transaction volume for 2011 compared to 2010. The level of
    involvement and value delivered by TMCs can range from simply documenting travel spend to acting as a
    source of savings and leverage. Organizations that leverage the rates, pricing systems and apply proprietary
    compliance processes to ensure fidelity to corporate contracts, organization approval and preferred providers
    will extract the most value from their programs.
    After a decrease during the recession in 2008 and 2009, corporate business travel grew steadily in 2010 and
    2011, with both demand and prices returning to pre-recession levels. Airfare and car rental rates have
    returned to pre-recession levels, while hotel rates lag pricing levels previously achieved. The International
    Monetary Fund (IMF) forecasted global output to increase by 3.3% in 2012, leading to an expected growth in
    corporate business travel by 4-5% and with an average annual growth rate of 4.3% over the next decade.


Cost and Capital Partners, LLC                                                                                        2|Page
Travel Management                                                                                        February 2012


    As demand for travel increases to meet the needs of business growth, so have many of the costs. Airlines in
    the US and Europe continue to consolidate and trim unprofitable routes, thus increasing pricing. Each $10
    per bbl. increase in crude oil translates to a 3% increase in airfares. Airlines are also increasing assessorial
    charges such as credit card processing fees in Europe, and change fees and phone based support fees
    worldwide. Providers are set to increase rates to reflect the additional cost inflation as well as react to
    increasing market demand. Figure 2 shows the average hotel rate increase estimates for 2012 by region.

   Figure 2: Hotel Rate Increase Predictions 2012           All these factors force enterprises across the globe to
                                                            approach T&E more strategically and to find new
                                                            solutions to realize value from their expense
        Middle East                                    7%   management programs. Many T&E processes are still
        Asia Pacific
                                                            manual, highly inefficient and policy compliance is
                                                       7%
                                                            difficult to monitor. These are seen as the biggest
     North America                                6%        areas of improvement, according to a recent study
                                                            conducted by the Aberdeen Group.
      Latin America                               6%
                                                            Automation is a key industry trend and is seen as a
             Africa                       4%                good way to deliver tangible benefits around cost
            Europe                   3%                     containment, productivity, satisfaction and compliance
                                                            to company policies. Technology and software
                                                            developments give clients the ability to audit pre-trip,
  Source: Advito 2012 Industry Forecast                     ensure policy compliance, and review process
    exceptions.
    For each element in the travel management process, corporate management must set service levels, track
    compliance, measure the actual spend, benchmark to identify the best rates, and set expectations for the
    providers and travel management firms. Using the benchmark data provided by TMCs is one step to
    measure current performance and quantify the amount of savings that is possible.
    When using a TMC, setting expectations early in the process will extract the most value out of using a third
    party to manage the travel spend. Most TMCs will want to showcase the savings they have delivered for the
    organization. This data needs to be challenged to ensure that the best airfare, hotel and car rental rates are
    provided to the company travelers. Best in class corporate travel management will set the metrics and KPIs
    for the TMC to report and be measured against. In these cases, the TMC should be measured on the rate
    history compared to external benchmarks, quality performance, class of service provided and compliance to
    corporate policies. When setting rate benchmarks, it is important to utilize tools in addition to the TMC’s
    report of the savings achieved. Many times, as can be seen in this paper’s case study, the actual rates for
    many corporations are higher than the rack rates that any traveler could have achieved just by using the
    internet to book the same travel. Measuring the TMC on performance to external metrics can highlight how
    well they perform and the actual leverage they have in the market.
    The compensation structure for the TMC can also create conflicts of interest between the volume bonus they
    receive from the carriers and hotels and the rates they pass along to their corporate clients. In these cases, it
    is imperative that the corporate travel management function identifies benchmark rates to challenge and
    measure the efficacy of their travel partner.
    A part of the value of using a TMC is to receive reporting and spend analytics for the travel buy. Corporate
    travel management should set expectations in terms of the reporting level of detail, frequency and which
    external benchmarks will be used to quantify savings and service levels.


    Spend Visibility
    One of the most challenging and important areas for travel managers is having detailed visibility into their
    spend. Typically, standard tools available to buyers such as expenditure reports or aggregated purchase
    orders are not internally available since much of the data is tied to personal or corporate credit cards.
    Oftentimes, this data can be captured in a structured manner by service providers or TMCs. Key data
    relating to vendor, volume, price, service levels should be aggregated on a monthly basis to ensure
    compliance and monitor progress of relevant volume expectations for upcoming negotiations. Figure 3
    outlines the level of spend detail that is useful for tracking compliance and preparing for negotiations.


Cost and Capital Partners, LLC                                                                                          3|Page
Travel Management                                                                                         February 2012


   Figure 3: Key spend categories by medium


            Category                 Air                  Hotel               Car Rental                 TMC
    Price                   Cost per Ticket        Cost per Stay         Cost per Rental        Cost per Transaction
                            Key Origin-
    Location                                       Key Markets           Key Markets            Regional/ Global
                            Destination Pairs
    Volume                  Total Tickets          Total Nights          Total Days             Total Transactions
                            Top Suppliers          Top Suppliers (by     Top Suppliers (by      Supplier (Regional or
    Provider
                            (Regional or Global)   city)                 Region)                Global)
                                                   Room Type / Number                           Response Time, Live
    Service Level           Ticket Class                                 Vehicle Type
                                                   of Stars                                     or Online
                            Baggage,
                                                   Internet
                            Change/ cancel fees,
                                                   Breakfast
                            Food                                         Insurance              Expenditure Reports
                                                   Parking
    Ancillary               Lounge Access                                GPS                    Travel Consulting
                                                   Lounge Access
                            Internet                                     Fuel                   Passport Services
                                                   Shuttle
                            Airport Transfer
                                                   Phone
                            Insurance


  Source: Cost & Capital analysis


    Prior to negotiations, buyers should pay close attention to travelers’ usage of services and ancillary fees. For
    example, charges such as checked baggage or change fees can rapidly eliminate any savings on airline
    tickets if they are not taken into account during initial negotiations. As illustrated in Figure 4, extra fees for
                                                             airlines can account for a significant portion of travel
   Figure 4: Total Cost of Travel (Airline Ticket)           spend if not managed properly. Ancillary fees are
                                                             greatly influenced by travel behavior. Basic surveys
                   Ticket Price          $370                can be distributed to employees to understand the
           Ticket Change Fee             $125                desire for various ancillary services. The survey results
                 Baggage Fee             $23                 can then be compared to actual spend data. This
                On-board Wi-Fi           $11                 comparison will allow travel managers to understand
                 Seat Upgrade            $60                 which items are “nice-to-have” (e.g. services that are
                          Total          $589                merely desired by travelers but not used in practice)
                                                             and must-haves (i.e. are desired and used by travelers)
                   % Ancillary           59%                 which should be included in negotiations.

  Source: C&C Research, Bureau of Transportation
          Statistics. All prices are average prices
          throughout all airlines


Cost and Capital Partners, LLC                                                                                           4|Page
Travel Management                                                                                        February 2012


    Opportunity Identification
    Once the spend visibility process is complete and a thorough spend map is prepared, an organization can begin to
    identify the savings opportunities. There are four key tools to optimize travel spend: Leverage, Demand
    Management, Consolidation and Benchmarking. These tools can be used on the categories of airfare, hotels and car
    rental once the spend visibility is complete.

    Leverage
    For most travel services, the marginal cost is low. For an airline, the cost of carrying one additional
    passenger only includes commissions to book the ticket, a negligible increase in fuel due to the weight, food,
    landing fees and taxes. As seen in Figure 5, most costs are fixed and include the crew and ground labor,
    fuel, depreciation, marketing, overhead and Figure 5: Airfare Cost Model
    maintenance. Being able to leverage volume
    on specific routes and increase volume is how                                Profit
    best in class airfare managers can deliver                           Other
    savings while helping the carrier to achieve
                                                            Food Service
    their financial objectives.                                                                       Fuel
                                                                   Fees
    To determine the amount of leverage available,
                                                         Commissions
    the spend analysis should highlight the major
                                                          Equipment 
    routes by volume, frequency, class and rates.
                                                            Rental
    This data can then be analyzed to determine
                                                            Depreciation
    the level of competition, capacity utilization and
    total contribution the additional volume will            Maintenance
    contribute to the airline’s cash flow. With high
    fixed costs, the airline can model how the
                                                                                         Labor
    additional volume can fill out existing routes or
    justify new service starts. These advantages Source: Cost and Capital Partners Financial Analysis
    for the airline allow them to offer corporate
    pricing at a significant savings to standard rates, especially for high profit services such as international
    business class fares as well as the elimination of assessorial fees that are typically charged such as payment
    fees, phone service fees, change fees and baggage fees.

    Similar to airlines, the majority of hotels’ costs are fixed or semi-fixed (e.g. Debt Service and Renovation 33%,
    Employees 30%, Other Operating Expenses 23%, Energy 8%, and Sales & Marketing 6%). To maintain
    profitability, most large hotels must maintain a minimum average occupancy of 50-60%. In markets with low
    average occupancy or seasonal shifts in conventions and tourism, business volume can act as a buffer. This
    can allow travel managers to achieve deep discounts if a relatively steady high volume forecast can be
    provided to the local sales manager. As with air travel, a spend analysis must first be conducted on the major
    markets where travelers are most likely to stay. Lower volume locations can be bundled and negotiated at a
    higher level or even left to TMCs to manage. In competitive markets, it is very likely that ancillary fees can be
    included in the room rate at little to no extra cost. Such ancillary fees should coincide and be included in the
    company’s travel policy to limit confusion or double spending.

    For the last few years, Marriott International’s sales employees have had access to the use of a tool called
    Group Price Optimizer. The goal of this tool is to increase revenue and profitability by improving the manner
    in which Marriott determines pricing for group business. This IT solution uses price elasticity models to allow
    sales managers to set rates locally or across hotels depending upon dynamic market conditions. This
    competitive bid response model allows sales managers to understand profitability at various volumes and
    price points. The fact that hotel sales managers now have access to sophisticated IT solutions such as the
    Group Price Optimizer make negotiation preparation and market analysis even more important for travel
    managers. Although these types of tools mainly benefit the hotels, they do allow sales managers to respond
    rapidly to buyers’ requests for quotes, thus reducing the overall sourcing timeline.


Cost and Capital Partners, LLC                                                                                          5|Page
Travel Management                                                                                            February 2012


    Key levers for car rental companies are relatively similar to hotels in that volume, which is measured in rental
    days, is extremely important. Again, it is important for travel managers to understand the demand at a city or
    regional level to gain ground during negotiations. This understanding will help align buyers to sales
    employees or local franchise owners who are concerned with metrics such as number of days a car is rented
    divided by number of days a car is owned. Travel managers should also ensure that a consistent policy
    exists regarding the level of car to be rented.

    Spend on ancillary items such as insurance and GPS should be reviewed prior to any rate negotiations. The
    prevalence of mobile phones with GPS and credit cards that cover rental insurance makes a proper travel
    policy extremely important in the rental car space. Surveying frequent travelers and regularly reviewing travel
    policies such as only using a corporate credit card to rent cars can help travel buyers focus on only the
    important ancillary fees during negotiations. Eliminating insurance and GPS can reduce the daily rental fee
    by ~50% or more in certain markets.

    Demand Management
    The least expensive business trip is the one not taken. Demand management is the process of enforcing
    travel policies that limit trips, selecting the best provider rates and encourage behavior that reduces costs. To
    be effective, travel policies need to be clearly communicated, easy for users to comply and enforced through
    the travel submission process.

    Travel policies can be used to limit travel based on seniority, authorization or function. In addition, policies
    can encourage behaviors that reduce costs such as online booking, directing spend to preferred providers
    and automating the authorization process. Automating the validation of travel plans can ensure users book
    the right class of service, receive approval and use the preferred service providers. These actions work to
    maximize the power of the organization and apply a standard set of principles.

    Consolidation

   Travel service providers traditionally have a cost structure that is high in fixed cost investments such as
   airplanes, buildings and IT systems. Winning volume from corporate customers helps to aggregate volume
   and leverage their costs. One strategy to balance the need for volume with the desire for extracting value
                                                                   from their services is to set up agreements with
  Figure 6: Hotel Pricing Models                                   service providers that include variable pricing
                                                                   (Figure 6). In this case, the provider maximizes
      100%                                                Rack     revenue while also filling capacity with corporate
       90%                                                Variable volume at the best rates. IBM, one of the leaders
    Rate as a percentage of Rack Rate


       80%
                                                                   in the hotel benchmarking case study, is able to
       70%
                                                                   leverage both its size as well as the fact that hotels
       60%
                                                          Fixed    want to fill up their open capacity, but not lose their
       50%
       40%
                                                                   opportunity to secure the most profitable users. To
       30%
                                                                   work with hotels, IBM has rates based on the
       20%                                                         capacity of the property. The rates start off lower,
       10%                                                         typically the lowest in the market, but as the hotel
        0%                                                         increases its load, the IBM rate increases. This
           0%     20%      40%         60%     80%    100%
                                                                   way, the hotel can make higher margins as
                         Hotel Booked Capacity
                                                                   demand increases. IBM can choose the higher
  Source: Cost and Capital Partners Financial Analysis             rate or revert to a lower rate with a backup
   location. This model maximizes the value of the volume to the property but also allows the hotel to increase
   incremental margin during times of high demand.

    The downside of a variable model is that realizing savings from such a program is dependent upon external
    factors such as overall demand in a region, conferences and peak days. The complexities of measuring the
    value of this kind of program also limit adoption for most organizations.


Cost and Capital Partners, LLC                                                                                               6|Page
Travel Management                                                                                        February 2012


    Benchmarking
    Providing travel service is a combination of understanding the costs and market. Some categories are driven
    by underlying costs, while others are priced based on market demand. In these cases, external
    benchmarking can prove to be very effective in securing better rates. As seen in the hotel benchmarking
    case study, the prices that other companies can achieve in addition to alternative booking methods, can
    highlight the range of prices in the market.

    To achieve better prices requires using consolidation as well as the visibility into the spend to understand the
    nights spent at hotels in a particular city, the number of flights on particular origin and destination pairs and
    the days of car rentals. External benchmarking can help to identify the floor prices in a particular market and
    begin to start negotiations. For spend such as hotels, knowing the distribution of spend in a particular city
    can help to highlight the value of consolidation and sell the opportunity to the service provider. Utilizing
    benchmarking to identify the best rates and then leveraging volume to show how it will support the sales
    goals of the individual hotel can motivate local sales managers to offer their best rates.

                                                              Benchmarking is also effective for negotiating with
   Figure 7: Average Gross Per-Booking Fees                   TMCs. Figure 7 is a list of rates TMCs charge for
                                                              various booking methods. Many service providers
                                                              use extra fees and charges to supplement revenue
                                                $29.85
                                                              streams. Many firms are able to eliminate online
                                $20.30                        booking fees since the provider does not incur any
                                                              additional costs to perform.
            $12.35
                                                              Since most organizations cannot negotiate rates in
                                                              every location, a combination of benchmarking rates
                                                              on the highest use markets combined with corporate
         Online without    Online with agent   Telephone
        agent assistance       assistance
                                                              discount rates often works best. Unlocking the value
                                                              of benchmarking also requires full spend visibility for
  Source: Business Travel News Corporate Travel 100 2011      the team to prioritize the biggest opportunities to
    leverage volume and secure savings.


    Negotiation Preparation
    Preparation
    Once opportunities have been identified, a travel buyer can begin to prepare for negotiations. The first step in
    the process outlined below, in Figure 8, is to conduct a detailed spend analysis. All of the areas previously
    identified in the Spend Visibility section should be taken into consideration. Merely taking into account spend
    per supplier will not sufficiently prepare the organization to identify and achieve aggressive targets. Service
    levels (e.g. ticket class, hotel level, and car type) and locations are key data dimensions that must be taken
    into consideration for each major travel market.

    The next step is to compare actual spend data to existing policies. It is important to determine where and how
    ancillary fees are being utilized by travelers. Typically the less fees or extras that need to be considered, the
    easier the negotiation will be for the buyer. However, a buying organization can and will lose any savings
    advantage if proper ancillary fees are not considered upfront. Additionally all ancillary fees should be
    included in the organization’s travel policy. This will help to ensure that travelers spend in the proper manner
    and are held accountable for rogue spending. It is extremely important to gain organizational signoff on any
    proposed changes to the travel policy or level of service required by travel service providers. Travel
    negotiations held on the wrong foundation will inevitably be a wasted exercise if users and management
    refuse to utilize the selected vendors.

    A market analysis is particularly important when preparing for travel negotiations. It is vital to understand
    service provider options as well as current capacity utilization in high spend markets. Typically, a TMC or
    even local offices can help provide insight into a global organization’s far flung markets. This type of


Cost and Capital Partners, LLC                                                                                          7|Page
Travel Management                                                                                                                 February 2012


    information is often available free of charge from a client’s TMC since this is part of their value proposition.
    Once key markets and expected volume within those markets have been identified, a bid list can be created.
    Since service providers such as hotels, car rental companies, and airlines are oftentimes in tight competition
    for similar markets and routes, it is best to have an extensive bid list. When initially reaching out to travel
    service providers it is also beneficial for a travel buyer to indicate that their company is looking to find a
    preferred supplier in several key markets. While not a commitment of volume, this preferred supplier
    approach can help motivate travel service providers to be more aggressive when quoting business.

    Once preparation is complete, it is best to execute the RFQ in a rapid and standardized manner.
    Negotiations can either be held via e-auction or face to face. It is our experience that face to face
    negotiations which clearly communicate the advantage to the hotel if they win the business are most effective
    for achieving savings. In this case, it is best to highlight the expected volumes (e.g. total nights for hotels,
    days for car rentals, and number of tickets for airlines) on an annual basis. The service provider should be
    requested to provide an aggressive quote during the first round. Depending upon volume, the service
    providers may quote extremely aggressively (i.e. over 50% below rack rate). The aggressive nature of this
    quoting can sometimes catch an inexperienced travel buyer off-guard and may exceed initial expectations.
    For this reason, it is best to refrain from providing targets to the suppliers during the first round. Once results
    are achieved, targets can be reviewed with management and communicated to suppliers during the second
    round.

    Once negotiations are complete and business is awarded, it is vital to communicate the new list of preferred
    vendors to any relevant TMCs as well as the organization as a whole. Obviously any negotiated savings
    cannot be achieved until travelers begin to utilize the new vendors.

   Figure 8: Travel Negotiation Process

            Internal                 Usage
                                                          Market                                      Negotiation             Negotiation
             Spend                Analysis &                                        RFQ
                                                          Analysis                                    Preparation             Execution
            Analysis             Policy Review

     • Gather spend          • Review policy vs.    • Determine key         • Determine RFQ       • Set negotiation       • Round 1
       information             spend data             markets                 method                strategy              • Communicate
         • TMC               • Determine                 • City             • Refine bid list     • Finalize market         targets/
         • Internal            necessary                 • Region           • Determine initial     strategy                expectations
           Systems             changes to travel         • Country            savings targets         • Preferred           (optional)
         • Corporate           policy               • Review capacity in    • Distribute RFQ to         supplier or       • Round 2
           Card Provider         • Ancillary          key markets             bid list                  tiers             • Communicate final
         • Service               • Service level    • Set volume                                      • Volume              targets
           Provider              • Order method       expectation by                                    commitment?       • Supplier selection
     • Review level of       • Receive approvals      market                                          • Ancillary to be   • Communicate
       detail                  for policy changes   • Select target                                     included in         updated supplier
         • Spend by          • Communicate            suppliers (i.e. bid                               base rate?          list to organization
           supplier, city,     travel policy          list) by market,                                • Must-have           and relevant TMC
           service level       changes to             spend category,                                   ancillaries
         • Ancillary data      organization           and service level                           • Finalize savings
         • Volume (e.g.                             • Review bid list and                           targets
           number of                                  service levels with                             • Base rate
           nights, airline                            relevant                                        • Ancillaries
           tickets, rental                            management                                  • Develop
           days)                                                                                    negotiation
                                                                                                    agendas based on
                                                                                                    targets and RFQ
                                                                                                    responses

  Source: Cost & Capital analysis


Cost and Capital Partners, LLC                                                                                                                     8|Page
Travel Management                                                                                  February 2012


    Segregation of Duties
    Prior to engaging a TMC, or when switching to a new provider, a client company should be well aware of its
    spend by market, category, and service level. This will allow aggressive savings targets to be assigned to
    their designated TMC when business is awarded. Depending upon organizational bandwidth, it is also
    beneficial to negotiate initial agreements in major markets. This will force the TMC to focus upon more
    challenging markets where limited competition or lower volumes can hinder savings opportunities. Client
    companies should work together with their TMC to set process requirements. Oftentimes, TMCs have well
                                                                 defined systems and processes which can help
   Figure 9: TMC vs. Client Tasks (Mature State)                 to create savings opportunities and monitor
                                                                 policy adherence.
    Task                        Client         TMC
                                                                Apart from process control, a major advantage
    Preparation                                                 of utilizing a TMC is access to market analysis
      Requirements              Responsible    Support          and benchmarking (e.g. market benchmarks,
      Data Collection           Support        Responsible      policy benchmarks, ancillary/ service level
    Expectation                                                 benchmarks).      TMCs are also capable of
      Internal Policy           Responsible    Support          collecting and aggregating data in an efficient
      External Benchmarks       Support        Responsible      manner. Once a TMC is in use, these types of
    Negotiation Execution                                       duties should be primarily performed by a TMC
      Key Markets               Responsible    Support          rather than the client company. Figure 9
      Other Markets             Support        Responsible
                                                                illustrates which duties should be performed by
                                                                a TMC and which should be performed by the
                                                                client once a mature relationship exists.

  Source: Cost & Capital analysis


Cost and Capital Partners, LLC                                                                                    9|Page
Travel Management                                                                                              February 2012


    Case Study: Hotel Rate Benchmarking
    Part of the challenge in quantifying travel    Figure 10: Atlanta Four Star Hotel Rates, Feb. 2012
    management programs is to understand
    not only the fees being paid to TMCs but                                            $0   $50   $100   $150   $200   $
    also the rates that are able to be achieved                                 IBM
                                                                                IBM
    with the providers. The sourcing tools                         IBM incl Internet
    identified, when applied well, can leverage                      Goldman Sachs
                                                                    Bank of America
    volume and use the market to drive the                                     Coke
                                                                                  GE
    best rates.                                                   Procter & Gamble
                                                                   NBA incl Internet

    Cost and Capital recently conducted a                               Government
                                                                             Boeing
    detailed study of corporate rates at several                Northrop Grumman
                                                             Hyatt Online Rack Rate
    four star hotels within two blocks of the                                  Xerox
    ProcureCon Indirect Sourcing Conference                                     AAA
                                                                             Kellogg
    in downtown Atlanta. The hotels studied                     Hyatt Pre‐Paid Rack
    were the Atlanta Marriott Downtown, the                            Daimler‐Benz
                                                                                AAA
    Hyatt Regency Atlanta, and the Westin                                  Samsung
                                                                              Costco
    Peachtree Plaza. As can be seen in Figure                                Toshiba
    10, corporate rates for these hotels range                                 Xerox
                                                                               Coke
    from $93 to $209 per night (before taxes),                                   NFL
    or a difference of 125% from lowest to                                       Cox
                                                                  AT&T incl Internet
    highest. These corporate rates range from                         Ernst & Young

    47% below rack (IBM rate at the Westin) to               Accenture incl Internet
                                                                     HP incl Internet
    20% above rack (ACS at the Marriott).                                Wells Fargo
                                                                           Microsoft
    IBM, Coca Cola, Goldman Sachs, Bank of                                     BASF
    America and GE had the lowest rates.                                  Hyatt Rack
                                                                               AT&T
    Companies such as IBM and GE are                                            AAA
    known for having large, well-managed,                           General Motors
                                                                               Xerox
    corporate travel budgets and frequently                                    Pepsi
                                                                                 Dell
    achieve rates well below rack across the                                 Toyota
    country.                                                                  Oracle
                                                           Tyco International Group
                                                                       Daimler Benz
    It is important to note that company size                                Renault
                                                                              Nissan
    does not always equate to large discounts.                                  Shell
    This can be seen by the rates for General                                Toshiba
                                                                           Microsoft
    Motors, Pfizer, and United Technologies.                               Samsung
    Large companies can have high rates for a                                  Pfizer
                                                                                 GM
    variety of reasons, but oftentimes high                                     Intel
                                                               Bristol‐Myers Squibb
    rates are a result of poorly leveraged                                     Cisco
    spend. Only a well-structured travel policy                        Marriott Rack
                                                                         ProcureCon
    and negotiation approach can ensure                                   Prudential
    competitive market rates. It is important to                United Technologies
                                                                         MillerCoors
    note that any base rate savings will result                                 Ford

    in a tax savings multiplier. Taxes in many                                    HP
                                                                                 CVS
    cities range from 15%-30% per night. This             Marriott Rack incl Internet
                                                                                 GM
    tax multiplier should be considered when               Westin Online Rack Rate
    creating a business case to tackle travel                               Ericsson
                                                                                 ATK
    savings in any market.                                                   Gillette
                                                                                 ACS
                                                                               Pfizer
                                                                                AAA


                                                   Source: Cost & Capital research


Cost and Capital Partners, LLC                                                                                              10 | P a g e
Travel Management                                                                                         February 2012


    Conclusion
    Successful implementation of a travel management program requires data visibility, understanding of the
    available tools and engaging service providers with information and leverage to motivate their performance.
    The rewards of a well-executed travel program include improved service levels, reduced costs and automated
                                                              management.       Each corporation will have a
   Figure 11: Average 2011 U.S. Corporate Hotel Rate
                                                              different profile and value proposition to the
             Discounts
                                                              various providers of travel. The challenge is to
                                                              understand what aspects each provider is going to
                                                              value and also how well they understand their
                0%        4%
                                                              market and the benefits of corporate volume.
             1‐15%                            19%
            16‐25%                                  23%
                                                               The opportunity is clear. Managing corporate
                                                               travel can reduce costs through leveraging volume
            26‐31%                                 23%         and setting targets based on the market. When
            32‐50%                                   25%       done well, costs can be reduced by 50% or more.
     More than 50%
                                                               Organizations that are going to be successful need
                             6%
                                                               to aggregate spend, prioritize the best
                                                               opportunities based on the where the organization
  Source: Business Travel News Corporate Travel 100 2011       uses travel, apply the tools which will be most
   effective and execute with a well-defined corporate policy enforced through the travel requisitioning process.

    With a myriad of areas to optimize costs, the focus from a procurement perspective should be on the total
    value created. The levers to create value start with defining policies and supporting processes at the
    beginning to manage the consumption of travel. The next step is to work with TMCs to collect usage history.
    This enables a discussion on travel management fees as well as the process that will be used to ensure
    compliance. Finally, most large organizations should negotiate directly with the carriers and hotel properties
    for the major spend as the leverage position for the volume of business will typically result in better rates than
    the overall rates that TMCs can secure as a whole.


Cost and Capital Partners, LLC                                                                                       11 | P a g e

Contenu connexe

Similaire à Travel Management January 2012

Deloitte: Charting a course for renewed airline consumer loyalty
Deloitte: Charting a course for renewed airline consumer loyaltyDeloitte: Charting a course for renewed airline consumer loyalty
Deloitte: Charting a course for renewed airline consumer loyaltyRafat Ali
 
Future of outsourcing rise of integrated & specialised service provider
Future of outsourcing   rise of integrated & specialised service providerFuture of outsourcing   rise of integrated & specialised service provider
Future of outsourcing rise of integrated & specialised service providerInterGlobe Technologies
 
Travel Project - Why us?
Travel Project - Why us?Travel Project - Why us?
Travel Project - Why us?Ionut Dumitru
 
Dream Come True Travel
Dream Come True TravelDream Come True Travel
Dream Come True Travelbabbo2
 
Social Listening for the Travel & Hospitality Industry
Social Listening for the Travel & Hospitality IndustrySocial Listening for the Travel & Hospitality Industry
Social Listening for the Travel & Hospitality IndustryBrandwatch
 
Travel Trends - Comparison of Tech-Based Managed Models
Travel Trends - Comparison of Tech-Based Managed   ModelsTravel Trends - Comparison of Tech-Based Managed   Models
Travel Trends - Comparison of Tech-Based Managed ModelsRob Wald
 
Forrester: Customer Engagement Agencies, Report Q4 2012
Forrester: Customer Engagement Agencies, Report Q4 2012Forrester: Customer Engagement Agencies, Report Q4 2012
Forrester: Customer Engagement Agencies, Report Q4 2012Simon Usifo
 
Aberdeen T&E Trends
Aberdeen T&E TrendsAberdeen T&E Trends
Aberdeen T&E TrendsSAP Concur
 
The Growth Engine: Superior Customer Experience in Insurance
The Growth Engine: Superior Customer Experience in InsuranceThe Growth Engine: Superior Customer Experience in Insurance
The Growth Engine: Superior Customer Experience in InsuranceAlex Singla
 
ASTA Making Tough Business Decisions: data for agency business planning
ASTA Making Tough Business Decisions: data for agency business planningASTA Making Tough Business Decisions: data for agency business planning
ASTA Making Tough Business Decisions: data for agency business planningAmerican Society of Travel Agents
 
What we know_about_managing_advertising_agencies
What we know_about_managing_advertising_agenciesWhat we know_about_managing_advertising_agencies
What we know_about_managing_advertising_agenciesAdCMO
 
Why benchmark meetings spend_24.11.16
Why benchmark meetings spend_24.11.16Why benchmark meetings spend_24.11.16
Why benchmark meetings spend_24.11.16Mark Harris
 
H455264.pdf
H455264.pdfH455264.pdf
H455264.pdfaijbm
 
Best Practices in Consulting - Kennedy 2014
Best Practices in Consulting - Kennedy 2014Best Practices in Consulting - Kennedy 2014
Best Practices in Consulting - Kennedy 2014Erik Wayton
 
TravelInk'd Brochure
TravelInk'd BrochureTravelInk'd Brochure
TravelInk'd Brochurethinkinkpr
 
Controlling Spend | The Elements of an Improved T&E Process
Controlling Spend | The Elements of an Improved T&E ProcessControlling Spend | The Elements of an Improved T&E Process
Controlling Spend | The Elements of an Improved T&E ProcessCertifyInc
 

Similaire à Travel Management January 2012 (20)

Deloitte: Charting a course for renewed airline consumer loyalty
Deloitte: Charting a course for renewed airline consumer loyaltyDeloitte: Charting a course for renewed airline consumer loyalty
Deloitte: Charting a course for renewed airline consumer loyalty
 
Future of outsourcing rise of integrated & specialised service provider
Future of outsourcing   rise of integrated & specialised service providerFuture of outsourcing   rise of integrated & specialised service provider
Future of outsourcing rise of integrated & specialised service provider
 
Travel Project - Why us?
Travel Project - Why us?Travel Project - Why us?
Travel Project - Why us?
 
Dream Come True Travel
Dream Come True TravelDream Come True Travel
Dream Come True Travel
 
Social Listening for the Travel & Hospitality Industry
Social Listening for the Travel & Hospitality IndustrySocial Listening for the Travel & Hospitality Industry
Social Listening for the Travel & Hospitality Industry
 
Airline Customer Value
Airline Customer Value Airline Customer Value
Airline Customer Value
 
Travel Trends - Comparison of Tech-Based Managed Models
Travel Trends - Comparison of Tech-Based Managed   ModelsTravel Trends - Comparison of Tech-Based Managed   Models
Travel Trends - Comparison of Tech-Based Managed Models
 
Forrester: Customer Engagement Agencies, Report Q4 2012
Forrester: Customer Engagement Agencies, Report Q4 2012Forrester: Customer Engagement Agencies, Report Q4 2012
Forrester: Customer Engagement Agencies, Report Q4 2012
 
CWT Company Overview
CWT Company OverviewCWT Company Overview
CWT Company Overview
 
Aberdeen T&E Trends
Aberdeen T&E TrendsAberdeen T&E Trends
Aberdeen T&E Trends
 
The Growth Engine: Superior Customer Experience in Insurance
The Growth Engine: Superior Customer Experience in InsuranceThe Growth Engine: Superior Customer Experience in Insurance
The Growth Engine: Superior Customer Experience in Insurance
 
ASTA Making Tough Business Decisions: data for agency business planning
ASTA Making Tough Business Decisions: data for agency business planningASTA Making Tough Business Decisions: data for agency business planning
ASTA Making Tough Business Decisions: data for agency business planning
 
Peer growth.pdf
Peer growth.pdfPeer growth.pdf
Peer growth.pdf
 
What we know_about_managing_advertising_agencies
What we know_about_managing_advertising_agenciesWhat we know_about_managing_advertising_agencies
What we know_about_managing_advertising_agencies
 
Why benchmark meetings spend_24.11.16
Why benchmark meetings spend_24.11.16Why benchmark meetings spend_24.11.16
Why benchmark meetings spend_24.11.16
 
H455264.pdf
H455264.pdfH455264.pdf
H455264.pdf
 
Best Practices in Consulting - Kennedy 2014
Best Practices in Consulting - Kennedy 2014Best Practices in Consulting - Kennedy 2014
Best Practices in Consulting - Kennedy 2014
 
TravelInk'd Brochure
TravelInk'd BrochureTravelInk'd Brochure
TravelInk'd Brochure
 
TravelInk'd Brochure
TravelInk'd Brochure TravelInk'd Brochure
TravelInk'd Brochure
 
Controlling Spend | The Elements of an Improved T&E Process
Controlling Spend | The Elements of an Improved T&E ProcessControlling Spend | The Elements of an Improved T&E Process
Controlling Spend | The Elements of an Improved T&E Process
 

Travel Management January 2012

  • 1. February 2012   Travel Management Category Sourcing Guide Authors Tom Bokowy  Corporate Travel, at $838 Billion Worldwide, represents one of the +1 208 610 0032 largest controllable cost categories for companies. Despite higher tbokowy@costandcapital.com demand and rising costs, effective management of the travel category Ryan Hatcher can manage spend and increase service levels. +1 617 459 0356 rhatcher@costandcapital.com  Procurement’s role in corporate travel is increasing. Applying procurement tools such as benchmarking, consolidation, negotiation Sebastian Fritz and demand management can deliver savings of 50% or more in some +1 646 620 4204 cases. sfritz@costandcapital.com  Assessorial charges and fees have been introduced by providers Cost and Capital Partners is a and travel management companies. These fees are often referred to management consulting firm that works in negotiations as “junk on the lawn.” The intent is to put fees and with companies to improve cost and charges on the table to be traded away. Most corporate customers are capital efficiency. Our client base not expected to pay these fees. includes Fortune 1000 companies from the industrial, automotive, electronics,  Effective travel management must coordinate policy, rates and hospitality, process, consumer goods, service levels. The complexity and breadth of requirements to execute transportation and white goods a best-in-class travel management program requires alignment with industries. We work with clients to improve results and enhance visibility internal stakeholders, travel management third parties and service for strategy development. Supplier providers. engagement is a core focus ranging from direct supplier negotiations to  Benchmarking can show achievable targets. Unlike other spend market and financial viability categories, external benchmarking of travel highlights rates and service assessments. In addition to working levels secured by peer companies for similar and often identical with clients to execute sourcing providers. initiatives, we also deliver sourcing training that enables organizations to increase their level of professionalism in supplier engagement. Table of contents For more information please visit our website www.costandcapital.com Introduction 2 Industry Overview 2 Spend Visibility 3 Opportunity Identification 5 Negotiation Preparation 7 Case Study: Hotel Rate Benchmarking 10 Conclusion 11
  • 2. Travel Management February 2012 Introduction Effective travel management requires an organization to have visibility into their spend, an approval process to direct and sometimes to restrict spending, rate optimization and the required documentation to track and manage the safety of employees. While most organizations use travel agents to manage travel, the value derived from their travel programs differs. According to American Express, travel and entertainment typically represents the second largest controllable expense for corporations. Tools to maximize the value from travel include consolidation, leverage, benchmarking and demand management. Best in class travel management programs balance the business need for travel and employee morale with cost management to deliver shareholder value. Since travel affects the majority of employees in a company and nearly 100% of the senior leadership, this category can become fraught with political tradeoffs and external influence into the sourcing process. Everyone agrees that that there is a difference between the Best Western and Hyatt as well as a coach flight with 3 connections compared to business class direct. What everyone has difficulty agreeing to is the value of one option to another. The responsibility for managing travel is increasingly coming under the domain of procurement. The ability of a procurement organization to perform a spend analysis, benchmark rates, audit fees, set service levels and leverage volume can yield savings of 50% compared to unmanaged travel. Industry Overview In 2010, companies spent about $838 billion for corporate travel and expenses, with the US representing about one third of the global market. According to American Express, travel and entertainment (T&E) is typically the second largest controllable expense for corporations (after salaries and benefits) and represents about 7% of an average company’s overall spend. The role of corporate travel management is to coordinate Figure 1: Travel Management Illustration the needs of employees with travel service providers— airlines, hotels, car rental, etc. As seen in Figure 1, travel management must deal with a large number of users creating demand for travel services with a number of providers based on geography, needs, service levels and volume. Each user typically has unique needs such as the class of service, timing, pricing limits and the value of their travel need. When corporate travel management is at its best, it aligns the costs of business travel with the value to the organization for travel. Striking this balance is difficult. The right decision is not always the cheapest cost or the fastest and most comfortable option. Each user will value the timing and service differently. It is the role of corporate travel management to create the process, structure and policies to manage a large and unique spend. Most corporations use a third party to manage this spend to deliver the best prices for providers and enforce policies to limit demand. About 18% of the global managed corporate travel market is dominated by the four biggest travel management companies (TMC): American Express, BCD Travel, Carlson Wagonlit Travel and Hogg Robinson Group. Each reported 5-10% growth rates in transaction volume for 2011 compared to 2010. The level of involvement and value delivered by TMCs can range from simply documenting travel spend to acting as a source of savings and leverage. Organizations that leverage the rates, pricing systems and apply proprietary compliance processes to ensure fidelity to corporate contracts, organization approval and preferred providers will extract the most value from their programs. After a decrease during the recession in 2008 and 2009, corporate business travel grew steadily in 2010 and 2011, with both demand and prices returning to pre-recession levels. Airfare and car rental rates have returned to pre-recession levels, while hotel rates lag pricing levels previously achieved. The International Monetary Fund (IMF) forecasted global output to increase by 3.3% in 2012, leading to an expected growth in corporate business travel by 4-5% and with an average annual growth rate of 4.3% over the next decade. Cost and Capital Partners, LLC 2|Page
  • 3. Travel Management February 2012 As demand for travel increases to meet the needs of business growth, so have many of the costs. Airlines in the US and Europe continue to consolidate and trim unprofitable routes, thus increasing pricing. Each $10 per bbl. increase in crude oil translates to a 3% increase in airfares. Airlines are also increasing assessorial charges such as credit card processing fees in Europe, and change fees and phone based support fees worldwide. Providers are set to increase rates to reflect the additional cost inflation as well as react to increasing market demand. Figure 2 shows the average hotel rate increase estimates for 2012 by region. Figure 2: Hotel Rate Increase Predictions 2012 All these factors force enterprises across the globe to approach T&E more strategically and to find new solutions to realize value from their expense Middle East 7% management programs. Many T&E processes are still Asia Pacific manual, highly inefficient and policy compliance is 7% difficult to monitor. These are seen as the biggest North America 6% areas of improvement, according to a recent study conducted by the Aberdeen Group. Latin America 6% Automation is a key industry trend and is seen as a Africa 4% good way to deliver tangible benefits around cost Europe 3% containment, productivity, satisfaction and compliance to company policies. Technology and software developments give clients the ability to audit pre-trip, Source: Advito 2012 Industry Forecast ensure policy compliance, and review process exceptions. For each element in the travel management process, corporate management must set service levels, track compliance, measure the actual spend, benchmark to identify the best rates, and set expectations for the providers and travel management firms. Using the benchmark data provided by TMCs is one step to measure current performance and quantify the amount of savings that is possible. When using a TMC, setting expectations early in the process will extract the most value out of using a third party to manage the travel spend. Most TMCs will want to showcase the savings they have delivered for the organization. This data needs to be challenged to ensure that the best airfare, hotel and car rental rates are provided to the company travelers. Best in class corporate travel management will set the metrics and KPIs for the TMC to report and be measured against. In these cases, the TMC should be measured on the rate history compared to external benchmarks, quality performance, class of service provided and compliance to corporate policies. When setting rate benchmarks, it is important to utilize tools in addition to the TMC’s report of the savings achieved. Many times, as can be seen in this paper’s case study, the actual rates for many corporations are higher than the rack rates that any traveler could have achieved just by using the internet to book the same travel. Measuring the TMC on performance to external metrics can highlight how well they perform and the actual leverage they have in the market. The compensation structure for the TMC can also create conflicts of interest between the volume bonus they receive from the carriers and hotels and the rates they pass along to their corporate clients. In these cases, it is imperative that the corporate travel management function identifies benchmark rates to challenge and measure the efficacy of their travel partner. A part of the value of using a TMC is to receive reporting and spend analytics for the travel buy. Corporate travel management should set expectations in terms of the reporting level of detail, frequency and which external benchmarks will be used to quantify savings and service levels. Spend Visibility One of the most challenging and important areas for travel managers is having detailed visibility into their spend. Typically, standard tools available to buyers such as expenditure reports or aggregated purchase orders are not internally available since much of the data is tied to personal or corporate credit cards. Oftentimes, this data can be captured in a structured manner by service providers or TMCs. Key data relating to vendor, volume, price, service levels should be aggregated on a monthly basis to ensure compliance and monitor progress of relevant volume expectations for upcoming negotiations. Figure 3 outlines the level of spend detail that is useful for tracking compliance and preparing for negotiations. Cost and Capital Partners, LLC 3|Page
  • 4. Travel Management February 2012 Figure 3: Key spend categories by medium Category Air Hotel Car Rental TMC Price Cost per Ticket Cost per Stay Cost per Rental Cost per Transaction Key Origin- Location Key Markets Key Markets Regional/ Global Destination Pairs Volume Total Tickets Total Nights Total Days Total Transactions Top Suppliers Top Suppliers (by Top Suppliers (by Supplier (Regional or Provider (Regional or Global) city) Region) Global) Room Type / Number Response Time, Live Service Level Ticket Class Vehicle Type of Stars or Online Baggage, Internet Change/ cancel fees, Breakfast Food Insurance Expenditure Reports Parking Ancillary Lounge Access GPS Travel Consulting Lounge Access Internet Fuel Passport Services Shuttle Airport Transfer Phone Insurance Source: Cost & Capital analysis Prior to negotiations, buyers should pay close attention to travelers’ usage of services and ancillary fees. For example, charges such as checked baggage or change fees can rapidly eliminate any savings on airline tickets if they are not taken into account during initial negotiations. As illustrated in Figure 4, extra fees for airlines can account for a significant portion of travel Figure 4: Total Cost of Travel (Airline Ticket) spend if not managed properly. Ancillary fees are greatly influenced by travel behavior. Basic surveys Ticket Price $370 can be distributed to employees to understand the Ticket Change Fee $125 desire for various ancillary services. The survey results Baggage Fee $23 can then be compared to actual spend data. This On-board Wi-Fi $11 comparison will allow travel managers to understand Seat Upgrade $60 which items are “nice-to-have” (e.g. services that are Total $589 merely desired by travelers but not used in practice) and must-haves (i.e. are desired and used by travelers) % Ancillary 59% which should be included in negotiations. Source: C&C Research, Bureau of Transportation Statistics. All prices are average prices throughout all airlines Cost and Capital Partners, LLC 4|Page
  • 5. Travel Management February 2012 Opportunity Identification Once the spend visibility process is complete and a thorough spend map is prepared, an organization can begin to identify the savings opportunities. There are four key tools to optimize travel spend: Leverage, Demand Management, Consolidation and Benchmarking. These tools can be used on the categories of airfare, hotels and car rental once the spend visibility is complete. Leverage For most travel services, the marginal cost is low. For an airline, the cost of carrying one additional passenger only includes commissions to book the ticket, a negligible increase in fuel due to the weight, food, landing fees and taxes. As seen in Figure 5, most costs are fixed and include the crew and ground labor, fuel, depreciation, marketing, overhead and Figure 5: Airfare Cost Model maintenance. Being able to leverage volume on specific routes and increase volume is how Profit best in class airfare managers can deliver Other savings while helping the carrier to achieve Food Service their financial objectives. Fuel Fees To determine the amount of leverage available, Commissions the spend analysis should highlight the major Equipment  routes by volume, frequency, class and rates. Rental This data can then be analyzed to determine Depreciation the level of competition, capacity utilization and total contribution the additional volume will Maintenance contribute to the airline’s cash flow. With high fixed costs, the airline can model how the Labor additional volume can fill out existing routes or justify new service starts. These advantages Source: Cost and Capital Partners Financial Analysis for the airline allow them to offer corporate pricing at a significant savings to standard rates, especially for high profit services such as international business class fares as well as the elimination of assessorial fees that are typically charged such as payment fees, phone service fees, change fees and baggage fees. Similar to airlines, the majority of hotels’ costs are fixed or semi-fixed (e.g. Debt Service and Renovation 33%, Employees 30%, Other Operating Expenses 23%, Energy 8%, and Sales & Marketing 6%). To maintain profitability, most large hotels must maintain a minimum average occupancy of 50-60%. In markets with low average occupancy or seasonal shifts in conventions and tourism, business volume can act as a buffer. This can allow travel managers to achieve deep discounts if a relatively steady high volume forecast can be provided to the local sales manager. As with air travel, a spend analysis must first be conducted on the major markets where travelers are most likely to stay. Lower volume locations can be bundled and negotiated at a higher level or even left to TMCs to manage. In competitive markets, it is very likely that ancillary fees can be included in the room rate at little to no extra cost. Such ancillary fees should coincide and be included in the company’s travel policy to limit confusion or double spending. For the last few years, Marriott International’s sales employees have had access to the use of a tool called Group Price Optimizer. The goal of this tool is to increase revenue and profitability by improving the manner in which Marriott determines pricing for group business. This IT solution uses price elasticity models to allow sales managers to set rates locally or across hotels depending upon dynamic market conditions. This competitive bid response model allows sales managers to understand profitability at various volumes and price points. The fact that hotel sales managers now have access to sophisticated IT solutions such as the Group Price Optimizer make negotiation preparation and market analysis even more important for travel managers. Although these types of tools mainly benefit the hotels, they do allow sales managers to respond rapidly to buyers’ requests for quotes, thus reducing the overall sourcing timeline. Cost and Capital Partners, LLC 5|Page
  • 6. Travel Management February 2012 Key levers for car rental companies are relatively similar to hotels in that volume, which is measured in rental days, is extremely important. Again, it is important for travel managers to understand the demand at a city or regional level to gain ground during negotiations. This understanding will help align buyers to sales employees or local franchise owners who are concerned with metrics such as number of days a car is rented divided by number of days a car is owned. Travel managers should also ensure that a consistent policy exists regarding the level of car to be rented. Spend on ancillary items such as insurance and GPS should be reviewed prior to any rate negotiations. The prevalence of mobile phones with GPS and credit cards that cover rental insurance makes a proper travel policy extremely important in the rental car space. Surveying frequent travelers and regularly reviewing travel policies such as only using a corporate credit card to rent cars can help travel buyers focus on only the important ancillary fees during negotiations. Eliminating insurance and GPS can reduce the daily rental fee by ~50% or more in certain markets. Demand Management The least expensive business trip is the one not taken. Demand management is the process of enforcing travel policies that limit trips, selecting the best provider rates and encourage behavior that reduces costs. To be effective, travel policies need to be clearly communicated, easy for users to comply and enforced through the travel submission process. Travel policies can be used to limit travel based on seniority, authorization or function. In addition, policies can encourage behaviors that reduce costs such as online booking, directing spend to preferred providers and automating the authorization process. Automating the validation of travel plans can ensure users book the right class of service, receive approval and use the preferred service providers. These actions work to maximize the power of the organization and apply a standard set of principles. Consolidation Travel service providers traditionally have a cost structure that is high in fixed cost investments such as airplanes, buildings and IT systems. Winning volume from corporate customers helps to aggregate volume and leverage their costs. One strategy to balance the need for volume with the desire for extracting value from their services is to set up agreements with Figure 6: Hotel Pricing Models service providers that include variable pricing (Figure 6). In this case, the provider maximizes 100% Rack revenue while also filling capacity with corporate 90% Variable volume at the best rates. IBM, one of the leaders Rate as a percentage of Rack Rate 80% in the hotel benchmarking case study, is able to 70% leverage both its size as well as the fact that hotels 60% Fixed want to fill up their open capacity, but not lose their 50% 40% opportunity to secure the most profitable users. To 30% work with hotels, IBM has rates based on the 20% capacity of the property. The rates start off lower, 10% typically the lowest in the market, but as the hotel 0% increases its load, the IBM rate increases. This 0% 20% 40% 60% 80% 100% way, the hotel can make higher margins as Hotel Booked Capacity demand increases. IBM can choose the higher Source: Cost and Capital Partners Financial Analysis rate or revert to a lower rate with a backup location. This model maximizes the value of the volume to the property but also allows the hotel to increase incremental margin during times of high demand. The downside of a variable model is that realizing savings from such a program is dependent upon external factors such as overall demand in a region, conferences and peak days. The complexities of measuring the value of this kind of program also limit adoption for most organizations. Cost and Capital Partners, LLC 6|Page
  • 7. Travel Management February 2012 Benchmarking Providing travel service is a combination of understanding the costs and market. Some categories are driven by underlying costs, while others are priced based on market demand. In these cases, external benchmarking can prove to be very effective in securing better rates. As seen in the hotel benchmarking case study, the prices that other companies can achieve in addition to alternative booking methods, can highlight the range of prices in the market. To achieve better prices requires using consolidation as well as the visibility into the spend to understand the nights spent at hotels in a particular city, the number of flights on particular origin and destination pairs and the days of car rentals. External benchmarking can help to identify the floor prices in a particular market and begin to start negotiations. For spend such as hotels, knowing the distribution of spend in a particular city can help to highlight the value of consolidation and sell the opportunity to the service provider. Utilizing benchmarking to identify the best rates and then leveraging volume to show how it will support the sales goals of the individual hotel can motivate local sales managers to offer their best rates. Benchmarking is also effective for negotiating with Figure 7: Average Gross Per-Booking Fees TMCs. Figure 7 is a list of rates TMCs charge for various booking methods. Many service providers use extra fees and charges to supplement revenue $29.85 streams. Many firms are able to eliminate online $20.30 booking fees since the provider does not incur any additional costs to perform. $12.35 Since most organizations cannot negotiate rates in every location, a combination of benchmarking rates on the highest use markets combined with corporate Online without Online with agent Telephone agent assistance assistance discount rates often works best. Unlocking the value of benchmarking also requires full spend visibility for Source: Business Travel News Corporate Travel 100 2011 the team to prioritize the biggest opportunities to leverage volume and secure savings. Negotiation Preparation Preparation Once opportunities have been identified, a travel buyer can begin to prepare for negotiations. The first step in the process outlined below, in Figure 8, is to conduct a detailed spend analysis. All of the areas previously identified in the Spend Visibility section should be taken into consideration. Merely taking into account spend per supplier will not sufficiently prepare the organization to identify and achieve aggressive targets. Service levels (e.g. ticket class, hotel level, and car type) and locations are key data dimensions that must be taken into consideration for each major travel market. The next step is to compare actual spend data to existing policies. It is important to determine where and how ancillary fees are being utilized by travelers. Typically the less fees or extras that need to be considered, the easier the negotiation will be for the buyer. However, a buying organization can and will lose any savings advantage if proper ancillary fees are not considered upfront. Additionally all ancillary fees should be included in the organization’s travel policy. This will help to ensure that travelers spend in the proper manner and are held accountable for rogue spending. It is extremely important to gain organizational signoff on any proposed changes to the travel policy or level of service required by travel service providers. Travel negotiations held on the wrong foundation will inevitably be a wasted exercise if users and management refuse to utilize the selected vendors. A market analysis is particularly important when preparing for travel negotiations. It is vital to understand service provider options as well as current capacity utilization in high spend markets. Typically, a TMC or even local offices can help provide insight into a global organization’s far flung markets. This type of Cost and Capital Partners, LLC 7|Page
  • 8. Travel Management February 2012 information is often available free of charge from a client’s TMC since this is part of their value proposition. Once key markets and expected volume within those markets have been identified, a bid list can be created. Since service providers such as hotels, car rental companies, and airlines are oftentimes in tight competition for similar markets and routes, it is best to have an extensive bid list. When initially reaching out to travel service providers it is also beneficial for a travel buyer to indicate that their company is looking to find a preferred supplier in several key markets. While not a commitment of volume, this preferred supplier approach can help motivate travel service providers to be more aggressive when quoting business. Once preparation is complete, it is best to execute the RFQ in a rapid and standardized manner. Negotiations can either be held via e-auction or face to face. It is our experience that face to face negotiations which clearly communicate the advantage to the hotel if they win the business are most effective for achieving savings. In this case, it is best to highlight the expected volumes (e.g. total nights for hotels, days for car rentals, and number of tickets for airlines) on an annual basis. The service provider should be requested to provide an aggressive quote during the first round. Depending upon volume, the service providers may quote extremely aggressively (i.e. over 50% below rack rate). The aggressive nature of this quoting can sometimes catch an inexperienced travel buyer off-guard and may exceed initial expectations. For this reason, it is best to refrain from providing targets to the suppliers during the first round. Once results are achieved, targets can be reviewed with management and communicated to suppliers during the second round. Once negotiations are complete and business is awarded, it is vital to communicate the new list of preferred vendors to any relevant TMCs as well as the organization as a whole. Obviously any negotiated savings cannot be achieved until travelers begin to utilize the new vendors. Figure 8: Travel Negotiation Process Internal Usage Market Negotiation Negotiation Spend Analysis & RFQ Analysis Preparation Execution Analysis Policy Review • Gather spend • Review policy vs. • Determine key • Determine RFQ • Set negotiation • Round 1 information spend data markets method strategy • Communicate • TMC • Determine • City • Refine bid list • Finalize market targets/ • Internal necessary • Region • Determine initial strategy expectations Systems changes to travel • Country savings targets • Preferred (optional) • Corporate policy • Review capacity in • Distribute RFQ to supplier or • Round 2 Card Provider • Ancillary key markets bid list tiers • Communicate final • Service • Service level • Set volume • Volume targets Provider • Order method expectation by commitment? • Supplier selection • Review level of • Receive approvals market • Ancillary to be • Communicate detail for policy changes • Select target included in updated supplier • Spend by • Communicate suppliers (i.e. bid base rate? list to organization supplier, city, travel policy list) by market, • Must-have and relevant TMC service level changes to spend category, ancillaries • Ancillary data organization and service level • Finalize savings • Volume (e.g. • Review bid list and targets number of service levels with • Base rate nights, airline relevant • Ancillaries tickets, rental management • Develop days) negotiation agendas based on targets and RFQ responses Source: Cost & Capital analysis Cost and Capital Partners, LLC 8|Page
  • 9. Travel Management February 2012 Segregation of Duties Prior to engaging a TMC, or when switching to a new provider, a client company should be well aware of its spend by market, category, and service level. This will allow aggressive savings targets to be assigned to their designated TMC when business is awarded. Depending upon organizational bandwidth, it is also beneficial to negotiate initial agreements in major markets. This will force the TMC to focus upon more challenging markets where limited competition or lower volumes can hinder savings opportunities. Client companies should work together with their TMC to set process requirements. Oftentimes, TMCs have well defined systems and processes which can help Figure 9: TMC vs. Client Tasks (Mature State) to create savings opportunities and monitor policy adherence. Task Client TMC Apart from process control, a major advantage Preparation of utilizing a TMC is access to market analysis Requirements Responsible Support and benchmarking (e.g. market benchmarks, Data Collection Support Responsible policy benchmarks, ancillary/ service level Expectation benchmarks). TMCs are also capable of Internal Policy Responsible Support collecting and aggregating data in an efficient External Benchmarks Support Responsible manner. Once a TMC is in use, these types of Negotiation Execution duties should be primarily performed by a TMC Key Markets Responsible Support rather than the client company. Figure 9 Other Markets Support Responsible illustrates which duties should be performed by a TMC and which should be performed by the client once a mature relationship exists. Source: Cost & Capital analysis Cost and Capital Partners, LLC 9|Page
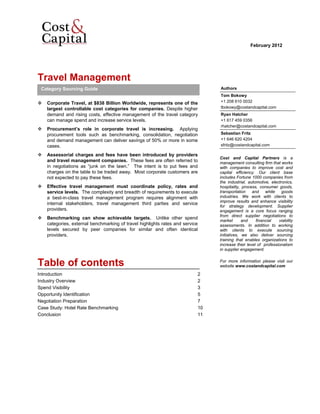
  • 10. Travel Management February 2012 Case Study: Hotel Rate Benchmarking Part of the challenge in quantifying travel Figure 10: Atlanta Four Star Hotel Rates, Feb. 2012 management programs is to understand not only the fees being paid to TMCs but $0 $50 $100 $150 $200 $ also the rates that are able to be achieved IBM IBM with the providers. The sourcing tools IBM incl Internet identified, when applied well, can leverage Goldman Sachs Bank of America volume and use the market to drive the Coke GE best rates. Procter & Gamble NBA incl Internet Cost and Capital recently conducted a Government Boeing detailed study of corporate rates at several Northrop Grumman Hyatt Online Rack Rate four star hotels within two blocks of the Xerox ProcureCon Indirect Sourcing Conference AAA Kellogg in downtown Atlanta. The hotels studied Hyatt Pre‐Paid Rack were the Atlanta Marriott Downtown, the Daimler‐Benz AAA Hyatt Regency Atlanta, and the Westin Samsung Costco Peachtree Plaza. As can be seen in Figure Toshiba 10, corporate rates for these hotels range Xerox Coke from $93 to $209 per night (before taxes), NFL or a difference of 125% from lowest to Cox AT&T incl Internet highest. These corporate rates range from Ernst & Young 47% below rack (IBM rate at the Westin) to Accenture incl Internet HP incl Internet 20% above rack (ACS at the Marriott). Wells Fargo Microsoft IBM, Coca Cola, Goldman Sachs, Bank of BASF America and GE had the lowest rates. Hyatt Rack AT&T Companies such as IBM and GE are AAA known for having large, well-managed, General Motors Xerox corporate travel budgets and frequently Pepsi Dell achieve rates well below rack across the Toyota country. Oracle Tyco International Group Daimler Benz It is important to note that company size Renault Nissan does not always equate to large discounts. Shell This can be seen by the rates for General Toshiba Microsoft Motors, Pfizer, and United Technologies. Samsung Large companies can have high rates for a Pfizer GM variety of reasons, but oftentimes high Intel Bristol‐Myers Squibb rates are a result of poorly leveraged Cisco spend. Only a well-structured travel policy Marriott Rack ProcureCon and negotiation approach can ensure Prudential competitive market rates. It is important to United Technologies MillerCoors note that any base rate savings will result Ford in a tax savings multiplier. Taxes in many HP CVS cities range from 15%-30% per night. This Marriott Rack incl Internet GM tax multiplier should be considered when Westin Online Rack Rate creating a business case to tackle travel Ericsson ATK savings in any market. Gillette ACS Pfizer AAA Source: Cost & Capital research Cost and Capital Partners, LLC 10 | P a g e
  • 11. Travel Management February 2012 Conclusion Successful implementation of a travel management program requires data visibility, understanding of the available tools and engaging service providers with information and leverage to motivate their performance. The rewards of a well-executed travel program include improved service levels, reduced costs and automated management. Each corporation will have a Figure 11: Average 2011 U.S. Corporate Hotel Rate different profile and value proposition to the Discounts various providers of travel. The challenge is to understand what aspects each provider is going to value and also how well they understand their 0% 4% market and the benefits of corporate volume. 1‐15% 19% 16‐25% 23% The opportunity is clear. Managing corporate travel can reduce costs through leveraging volume 26‐31% 23% and setting targets based on the market. When 32‐50% 25% done well, costs can be reduced by 50% or more. More than 50% Organizations that are going to be successful need 6% to aggregate spend, prioritize the best opportunities based on the where the organization Source: Business Travel News Corporate Travel 100 2011 uses travel, apply the tools which will be most effective and execute with a well-defined corporate policy enforced through the travel requisitioning process. With a myriad of areas to optimize costs, the focus from a procurement perspective should be on the total value created. The levers to create value start with defining policies and supporting processes at the beginning to manage the consumption of travel. The next step is to work with TMCs to collect usage history. This enables a discussion on travel management fees as well as the process that will be used to ensure compliance. Finally, most large organizations should negotiate directly with the carriers and hotel properties for the major spend as the leverage position for the volume of business will typically result in better rates than the overall rates that TMCs can secure as a whole. Cost and Capital Partners, LLC 11 | P a g e