SlideShare une entreprise Scribd logo
1  sur  19
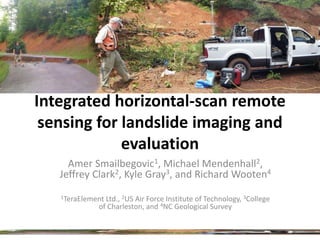
Integrated horizontal-scan remote
 sensing for landslide imaging and
             evaluation
     Amer Smailbegovic1, Michael Mendenhall2,
   Jeffrey Clark2, Kyle Gray3, and Richard Wooten4
   1TeraElementLtd., 2US Air Force Institute of Technology, 3College
             of Charleston, and 4NC Geological Survey
The Landslide: Franklin, NC


                                                           Located in the
                                                           Appalachian
                                                           Mountains of the
                                                           Eastern United States
              Image/map courtesy of NC Geological Survey
Landslide: Geology requirements


             Unstable slope:
             35 – 65 degrees
                                         Expansive Clays
                                                             Deteriorating host


                                                     Water


      Host rock: Amphibolites/schist
      withsignificant concentrations of pyrite
      aswell as deteriorating igneous rocks
      Alluvium, sands, clays all present as
      process of host rock decomposition
      continues
Landslide: How it works
                                  Deforestation: decreasing vegetative cover can
                                  increase risk by as much as 50%, change in water
                                  absorption-holding factor-climate.


                                                   Soil mineralogy: water expansive
                                                   clays, poorly draining soils, mixed soil
                                                   types, lateritization and deterioration
                                                   of the host rock by
                                                   weathering/leaching


                                        Increased loading: Loading unstable, poorly
                                        rooted layers may result in collapse (e.g.
                                        water load, structure load)

     Slope angle: determination of risky slopes particular for an area
Landslide: Observables

    Fracture


            Sulfates


 SPECTRAL SIDE:                           LIDAR side:
 -Identify zones of weathered rock and    -Identify zones of weakness (fractures,
 byproducts of acid-digestion: sulfates   faults, sliding blocks)

 -Identify zones of clay minerals that    -Identify zones of high / risky slope
 swell by as much as 200% when
 hydrated (e.g. montmorillonite)
The People   (is it a landslide if no one is around to notice)


                                Currently the area is contentious and attracting
                                different attention for variety of purposes: study,
                                safety, litigation, development, transportation and
                                infrastructure.
                                One must exercise caution in approach not to trigger
                                existing and other non-geological landslides
The Plan

    AREA IMAGED


                  Hyperspectral


                         LIDAR
Equipment


                                                   Velodyne High Def LIDAR (HDL-64E S2)
                                                   360 Deg Horizontal FOV
HyperSpecTIR (HST) -3                              26.8 Deg Vertical FOV
Third model of SpecTIR’s airborne scanner, which   1.3M Points per second
saw airborne action until 2006 when it was         2 Co-mounted Hi Res framing cameras
relegated to ground use.
227 bands, 1mRad FOV, 450-2450 spectral range.
Technical Challenge

  • Low signal-to-noise ratio (hyperspectral)
  • Cause: scene geometry & horizontal config
       – Specular component is the largest contributor of RTR
       – Specular component hits the ground plane
       – Only weak diffuse component reaches the imager
                         Result  low SNR…


              RDiff           RTR=RDiff+RSpec
                              RSpec  RDiff
                      RSpec

Hill Side                          Imager


                          Ground Plane
Mitigating SNR Issues
                                                                                           Transform-based denoising
                                                                                           may occur prior to atmospheric
                                                                                           compensation – work in progress

   • Processing Chain
  Image Acquisition


                      I1
                                                                                                  Reflectance
                      I2       Super Resolution:             ISR    Atmospheric       C                                      ˆC
                                                                                  I                 Signal
                               ISR    I1, I 2 , , I n                             SR                                     ISR
                                                                   Compensation
                           …


                      In                                                                           Denoising

   • Super Resolution:
                      – 10’s of images with stationary imager – average yields
                        good recovery of true radiance image
   • Atmospheric Compensation: Currently Flat Field
   • Denoising Efforts: Savitzy-Golay
                      – Savitzy-Golay filtering used in this study
                      – Ongoing: Discrete Wavelet Transform & Discrete Fourier
                        Transform denoising method
Some Intermediate Results
 • Super Resolution                                                                                               • (μOrig- μSR) white panel
            – (σOrig-σSR) white panel                                                                                – Orig overly bright w/large
                                     • Significant reduction in σ in VIS                                               deviation from estimate of μ
                                     • Notable reduction in σ in SWIR
                                                                                                                                           80


                      120                                                                                                                  60


                      100
                                                          Aprrox crossover point                                                           40


                       80                                 between VNIR & SWIR
                                                          Detectors                                                                        20


                                                                                                                                     
                       60
                 


                                                                                                                                            0
                       40


                                                                                                                                           -20
                       20


                          0                                                                                                                -40

                                                                                                                                                       600     800    1000    1200     1400       1600   1800   2000   2200    2400
                                                                                                                                                                                     Wavelength in nm
                      -20
                               600    800   1000   1200     1400       1600   1800    2000     2200     2400
                                                          Wavelength in nm


 • Savitzy-Golay Smoothing
                      1
                                                                                                                                     0.4


                                                                                                                                    0.35


                 0.95
                                                                                                                                     0.3


                  0.9                                                                                                               0.25
                                                                                                                      FFSG , FF
                                                                                                                      2
   FFSG , FF


                                                                                                                                     0.2
                 0.85
                                                                                                                      2


                                                                                                                                    0.15

                  0.8         White Panel Mean:                                                                                      0.1
                                                                                                                                                         White Panel Variance:
                 0.75
                               Savitzy-Golay (red)                                                                                  0.05
                                                                                                                                                          Savitzy-Golay (red)
                  0.7
                               Non-Noised (black)                                                                                     0
                                                                                                                                                          Non-Noised (black)
                              600     800   1000   1200       1400     1600    1800     2000     2200      2400                                  600         800     1000    1200      1400      1600    1800   2000    2200     2400
Hyperspectral Data


                      Scene 3                                         Scene 1
 Cal Panels for ELM             The King of Pop has reemerged


                                        In-scene spectral diversity
Target Minerals


    Reflectance Spectra De-noised
    using Savitzky-Golay regression
On Scene


           Example of hyperspectral detection of
           minerals – classification results overlain
           on natural-color RGB composite:

           RED – water expanding mineral suite with
           evidence of sulfate minerals indicating
           rock-decomposition processes
           GREEN – water expanding clay minerals
           only
LIDAR


        Color-shaded, horizontal-
        looking LIDAR data showing
        some of the apparent structural
        elements of significance to
        landslide formation and/or
        propagation.
LIDAR


        Water-expanding mineral suite on
        LIDAR scan
LIDAR

          Isolated block                             Some of the possible
                                                     targets for another
                                                     landslide: note
                                                     potentially
                                                     compromised block
                                                     in the center

                Structure                            Large area of
                                                     compromised rock
                           Zone of Weakness          and clay minerals on
                                                     the right is an
                                                     evidence of an
                                                     exposed face, but
                                                     lack of structural
                                                     elements does not
 Example of integrated LIDAR and HSI-produced maps   make it as risky as
                                                     the location on the
                                                     left
Directions

  • Technical
    – Atmospheric Correction
       • Tradeoffs between MODTRAN, on-site irradiance spectra,
         ELM, and Flat Field for the horizontal scan configuration
    – Digital Signal Processing
       • Incorporate Sensor Noise Model
       • Detailed study on denoising affects (S-G, DWT, DFT)
    – Create a workable geotechnical model from new
      input data
Conclusions
  – It is possible to delineate zones of “problematic”
    mineralogy on a wider scale using horizontal-
    looking hyperspectral imagery
  – It is possible to delineate zones of structural
    weakness and/or landslide formation elements
    using horizontal-looking LIDAR data
  – Integrating LIDAR and hyperspectral data shows
    promising results as a tool in observing and
    tracking existing landslide areas
  – Fills important elements in geotechnical
    evaluation: mineralogy and structure

Contenu connexe

Similaire à Integrated horizontal-scan remote sensing for landslide imaging and evaluation

110727Oshigami.pdf
110727Oshigami.pdf110727Oshigami.pdf
110727Oshigami.pdfgrssieee
 
Bright and dark_polar_deposits_on _mercury_evidence_for_surface _volatiles
Bright and dark_polar_deposits_on _mercury_evidence_for_surface _volatilesBright and dark_polar_deposits_on _mercury_evidence_for_surface _volatiles
Bright and dark_polar_deposits_on _mercury_evidence_for_surface _volatilesSérgio Sacani
 
Sudha radhika to upload in slide share [compatibility mode]
Sudha radhika to upload in slide share [compatibility mode]Sudha radhika to upload in slide share [compatibility mode]
Sudha radhika to upload in slide share [compatibility mode]radhikasabareesh
 
WP as per WS
WP as per WSWP as per WS
WP as per WSanoop_wp
 
Musgrave Minerals- Resources & Energy Symposium 2012
Musgrave Minerals- Resources & Energy Symposium 2012Musgrave Minerals- Resources & Energy Symposium 2012
Musgrave Minerals- Resources & Energy Symposium 2012Symposium
 
Dielectronic recombination and stability of warm gas in AGN
Dielectronic recombination and stability of warm gas in AGNDielectronic recombination and stability of warm gas in AGN
Dielectronic recombination and stability of warm gas in AGNAstroAtom
 
Overview To Linked In
Overview To Linked InOverview To Linked In
Overview To Linked Inkaadera
 
Space Weather Nov 2011 Open U Israel
Space Weather Nov 2011 Open U IsraelSpace Weather Nov 2011 Open U Israel
Space Weather Nov 2011 Open U IsraelMeidad Pariente
 
Microseismic monitoring at the CCS fields - what we learnt from Nagaoka
Microseismic monitoring at the CCS fields - what we learnt from NagaokaMicroseismic monitoring at the CCS fields - what we learnt from Nagaoka
Microseismic monitoring at the CCS fields - what we learnt from NagaokaGlobal CCS Institute
 
Petro challengenigeria1to6withcs rwc_2012-11_23_slideshare
Petro challengenigeria1to6withcs rwc_2012-11_23_slidesharePetro challengenigeria1to6withcs rwc_2012-11_23_slideshare
Petro challengenigeria1to6withcs rwc_2012-11_23_slidesharemarinabruce
 
Fuqin Li_A physics-based atmospheric and BRDF correction for Landsat data ove...
Fuqin Li_A physics-based atmospheric and BRDF correction for Landsat data ove...Fuqin Li_A physics-based atmospheric and BRDF correction for Landsat data ove...
Fuqin Li_A physics-based atmospheric and BRDF correction for Landsat data ove...TERN Australia
 
Critical Water Resource Monitoring - Sana´a Basin / Yemen
Critical Water Resource Monitoring - Sana´a Basin / YemenCritical Water Resource Monitoring - Sana´a Basin / Yemen
Critical Water Resource Monitoring - Sana´a Basin / YemenGlobal Risk Forum GRFDavos
 
Mapping Sea Level Rise: Tools for Community Assessment and Planning
Mapping Sea Level Rise: Tools for Community Assessment and PlanningMapping Sea Level Rise: Tools for Community Assessment and Planning
Mapping Sea Level Rise: Tools for Community Assessment and Planningriseagrant
 

Similaire à Integrated horizontal-scan remote sensing for landslide imaging and evaluation (15)

110727Oshigami.pdf
110727Oshigami.pdf110727Oshigami.pdf
110727Oshigami.pdf
 
Bright and dark_polar_deposits_on _mercury_evidence_for_surface _volatiles
Bright and dark_polar_deposits_on _mercury_evidence_for_surface _volatilesBright and dark_polar_deposits_on _mercury_evidence_for_surface _volatiles
Bright and dark_polar_deposits_on _mercury_evidence_for_surface _volatiles
 
Sudha radhika to upload in slide share [compatibility mode]
Sudha radhika to upload in slide share [compatibility mode]Sudha radhika to upload in slide share [compatibility mode]
Sudha radhika to upload in slide share [compatibility mode]
 
WP as per WS
WP as per WSWP as per WS
WP as per WS
 
Musgrave Minerals- Resources & Energy Symposium 2012
Musgrave Minerals- Resources & Energy Symposium 2012Musgrave Minerals- Resources & Energy Symposium 2012
Musgrave Minerals- Resources & Energy Symposium 2012
 
Dielectronic recombination and stability of warm gas in AGN
Dielectronic recombination and stability of warm gas in AGNDielectronic recombination and stability of warm gas in AGN
Dielectronic recombination and stability of warm gas in AGN
 
Hic06 spatial interpolation
Hic06 spatial interpolationHic06 spatial interpolation
Hic06 spatial interpolation
 
Overview To Linked In
Overview To Linked InOverview To Linked In
Overview To Linked In
 
Space Weather Nov 2011 Open U Israel
Space Weather Nov 2011 Open U IsraelSpace Weather Nov 2011 Open U Israel
Space Weather Nov 2011 Open U Israel
 
Microseismic monitoring at the CCS fields - what we learnt from Nagaoka
Microseismic monitoring at the CCS fields - what we learnt from NagaokaMicroseismic monitoring at the CCS fields - what we learnt from Nagaoka
Microseismic monitoring at the CCS fields - what we learnt from Nagaoka
 
Petro challengenigeria1to6withcs rwc_2012-11_23_slideshare
Petro challengenigeria1to6withcs rwc_2012-11_23_slidesharePetro challengenigeria1to6withcs rwc_2012-11_23_slideshare
Petro challengenigeria1to6withcs rwc_2012-11_23_slideshare
 
Fuqin Li_A physics-based atmospheric and BRDF correction for Landsat data ove...
Fuqin Li_A physics-based atmospheric and BRDF correction for Landsat data ove...Fuqin Li_A physics-based atmospheric and BRDF correction for Landsat data ove...
Fuqin Li_A physics-based atmospheric and BRDF correction for Landsat data ove...
 
Critical Water Resource Monitoring - Sana´a Basin / Yemen
Critical Water Resource Monitoring - Sana´a Basin / YemenCritical Water Resource Monitoring - Sana´a Basin / Yemen
Critical Water Resource Monitoring - Sana´a Basin / Yemen
 
Mapping Sea Level Rise: Tools for Community Assessment and Planning
Mapping Sea Level Rise: Tools for Community Assessment and PlanningMapping Sea Level Rise: Tools for Community Assessment and Planning
Mapping Sea Level Rise: Tools for Community Assessment and Planning
 
Observing Sea Level
Observing Sea Level Observing Sea Level
Observing Sea Level
 

Integrated horizontal-scan remote sensing for landslide imaging and evaluation

  • 1. Integrated horizontal-scan remote sensing for landslide imaging and evaluation Amer Smailbegovic1, Michael Mendenhall2, Jeffrey Clark2, Kyle Gray3, and Richard Wooten4 1TeraElementLtd., 2US Air Force Institute of Technology, 3College of Charleston, and 4NC Geological Survey
  • 2. The Landslide: Franklin, NC Located in the Appalachian Mountains of the Eastern United States Image/map courtesy of NC Geological Survey
  • 3. Landslide: Geology requirements Unstable slope: 35 – 65 degrees Expansive Clays Deteriorating host Water Host rock: Amphibolites/schist withsignificant concentrations of pyrite aswell as deteriorating igneous rocks Alluvium, sands, clays all present as process of host rock decomposition continues
  • 4. Landslide: How it works Deforestation: decreasing vegetative cover can increase risk by as much as 50%, change in water absorption-holding factor-climate. Soil mineralogy: water expansive clays, poorly draining soils, mixed soil types, lateritization and deterioration of the host rock by weathering/leaching Increased loading: Loading unstable, poorly rooted layers may result in collapse (e.g. water load, structure load) Slope angle: determination of risky slopes particular for an area
  • 5. Landslide: Observables Fracture Sulfates SPECTRAL SIDE: LIDAR side: -Identify zones of weathered rock and -Identify zones of weakness (fractures, byproducts of acid-digestion: sulfates faults, sliding blocks) -Identify zones of clay minerals that -Identify zones of high / risky slope swell by as much as 200% when hydrated (e.g. montmorillonite)
  • 6. The People (is it a landslide if no one is around to notice) Currently the area is contentious and attracting different attention for variety of purposes: study, safety, litigation, development, transportation and infrastructure. One must exercise caution in approach not to trigger existing and other non-geological landslides
  • 7. The Plan AREA IMAGED Hyperspectral LIDAR
  • 8. Equipment Velodyne High Def LIDAR (HDL-64E S2) 360 Deg Horizontal FOV HyperSpecTIR (HST) -3 26.8 Deg Vertical FOV Third model of SpecTIR’s airborne scanner, which 1.3M Points per second saw airborne action until 2006 when it was 2 Co-mounted Hi Res framing cameras relegated to ground use. 227 bands, 1mRad FOV, 450-2450 spectral range.
  • 9. Technical Challenge • Low signal-to-noise ratio (hyperspectral) • Cause: scene geometry & horizontal config – Specular component is the largest contributor of RTR – Specular component hits the ground plane – Only weak diffuse component reaches the imager Result  low SNR… RDiff RTR=RDiff+RSpec RSpec  RDiff RSpec Hill Side Imager Ground Plane
  • 10. Mitigating SNR Issues Transform-based denoising may occur prior to atmospheric compensation – work in progress • Processing Chain Image Acquisition I1 Reflectance I2 Super Resolution: ISR Atmospheric C ˆC I Signal ISR    I1, I 2 , , I n  SR ISR Compensation … In Denoising • Super Resolution: – 10’s of images with stationary imager – average yields good recovery of true radiance image • Atmospheric Compensation: Currently Flat Field • Denoising Efforts: Savitzy-Golay – Savitzy-Golay filtering used in this study – Ongoing: Discrete Wavelet Transform & Discrete Fourier Transform denoising method
  • 11. Some Intermediate Results • Super Resolution • (μOrig- μSR) white panel – (σOrig-σSR) white panel – Orig overly bright w/large • Significant reduction in σ in VIS deviation from estimate of μ • Notable reduction in σ in SWIR 80 120 60 100 Aprrox crossover point 40 80 between VNIR & SWIR Detectors 20  60  0 40 -20 20 0 -40 600 800 1000 1200 1400 1600 1800 2000 2200 2400 Wavelength in nm -20 600 800 1000 1200 1400 1600 1800 2000 2200 2400 Wavelength in nm • Savitzy-Golay Smoothing 1 0.4 0.35 0.95 0.3 0.9 0.25 FFSG , FF 2 FFSG , FF 0.2 0.85 2 0.15 0.8 White Panel Mean: 0.1 White Panel Variance: 0.75 Savitzy-Golay (red) 0.05 Savitzy-Golay (red) 0.7 Non-Noised (black) 0 Non-Noised (black) 600 800 1000 1200 1400 1600 1800 2000 2200 2400 600 800 1000 1200 1400 1600 1800 2000 2200 2400
  • 12. Hyperspectral Data Scene 3 Scene 1 Cal Panels for ELM The King of Pop has reemerged In-scene spectral diversity
  • 13. Target Minerals Reflectance Spectra De-noised using Savitzky-Golay regression
  • 14. On Scene Example of hyperspectral detection of minerals – classification results overlain on natural-color RGB composite: RED – water expanding mineral suite with evidence of sulfate minerals indicating rock-decomposition processes GREEN – water expanding clay minerals only
  • 15. LIDAR Color-shaded, horizontal- looking LIDAR data showing some of the apparent structural elements of significance to landslide formation and/or propagation.
  • 16. LIDAR Water-expanding mineral suite on LIDAR scan
  • 17. LIDAR Isolated block Some of the possible targets for another landslide: note potentially compromised block in the center Structure Large area of compromised rock Zone of Weakness and clay minerals on the right is an evidence of an exposed face, but lack of structural elements does not Example of integrated LIDAR and HSI-produced maps make it as risky as the location on the left
  • 18. Directions • Technical – Atmospheric Correction • Tradeoffs between MODTRAN, on-site irradiance spectra, ELM, and Flat Field for the horizontal scan configuration – Digital Signal Processing • Incorporate Sensor Noise Model • Detailed study on denoising affects (S-G, DWT, DFT) – Create a workable geotechnical model from new input data
  • 19. Conclusions – It is possible to delineate zones of “problematic” mineralogy on a wider scale using horizontal- looking hyperspectral imagery – It is possible to delineate zones of structural weakness and/or landslide formation elements using horizontal-looking LIDAR data – Integrating LIDAR and hyperspectral data shows promising results as a tool in observing and tracking existing landslide areas – Fills important elements in geotechnical evaluation: mineralogy and structure