1. Analyzing emerging innovation systems: A functions
approach to foresight
Floortje Alkemade1, Chris Kleinschmidt2, Marko Hekkert1
(1) Department of Innovation Studies, Utrecht University
PO Box 80125, NL-3508 TC Utrecht, The Netherlands
Email: {f.alkemade,m.hekkert}@geo.uu.nl
(2) KEMA Consultancy Europe, power generation and sustainables
P.O.Box 9035, NL-6800 ET Arnhem, The Netherlands
Email: chris.kleinschmidt@kema.com
Abstract: The success of sustainable innovations depends in a large part on their environment,
the innovation system. Insight into the structure and dynamics of the innovation system is thus
of crucial importance in foresight studies and policy analysis. The analytical framework
outlined in this paper allows us to study the relations between the components, the structure
and the functionality of the innovation system resulting in increased insight in (future) system
behaviour and performance. Furthermore, mapping the (actor-independent) functions of the
innovation system allows us to compare different cases, enabling timely and adequate policy
measures through improved foresight. The application of our framework to the California wind
energy innovation system shows a relation between system structure and performance and
gives us insight in system dynamics.
Keywords: foresight, innovation systems, innovation policy, functions of innovation systems,
wind energy
Acknowledgements: The research was performed while Chris Kleinschmidt was at Utrecht
University and the University of Davis. The authors would like to thank Case van Dam and
Scot Larwood at the University of Davis, Ruud Smits at Utrecht University, Jerry McNerny at
PG&E, Nancy Rader at the AWEA, Don Smith at the CPUC and Dora Yen Nakafuji at the
CEC as well as two anonymous referees for their valuable input.
1 Introduction
Innovation is a key determinant for long term economic growth and development. But the innovation
process is characterized by uncertainties, high risks, huge investments and late returns on investment
which make it a complex process. This is particularly true for sustainable innovation where market
forces alone cannot be relied upon to realize the desired transitions. To overcome existing system
inertia, governments try to manage sustainable technology development (Weaver et. al., 2000) through
environmental and innovation policy programs that lean on foresight programs (Martin and Johnston,
1999, Miles, 2005, Blind et.al, 1999). Insight into the structure and dynamics of emerging technologies
through normative foresight can help policy makers to influence the direction of the innovation onto a
socially desirable path (Linstone, 1969). As noted by Archibugi and Lundvall (2001) this is a very
difficult task since “most innovation policies are well suited when it comes to supporting existing
technological systems, but much less when it comes to stimulating the creation of new ones.” There
thus exists a need for effective information on such emerging technologies (Coates et. al., 2001).
In this paper, we present a functions of innovation systems framework that allows us to study the
relations between the components, the structure and the functionality of (emerging) innovation systems
resulting in increased insight in (future) system behaviour and performance. We apply our framework
2. to the California Wind Energy Innovation System (CAWEIS), a well documented and researched
example of sustainable development, see for example Norberg-Bohm (2000) and van Est (1996).
Renewable energy technologies, like wind energy, are technologies that radically change the embedded
technological system. Innovation is needed to introduce new energy technologies, to rearrange the
infrastructure, to adjust traditional working methods and to solve many problems along the way.
Complex system, such as the CAWEIS are characterized by uncertainty in technological developments
(Nelson and Winter, 1977, Wilson, 2004), bounded rationality of actors (Simon, 1957), feedback
processes (Lundvall, 1988, Rosenberg and Kline, 1986) and path dependencies (Arthur, 1994).
Furthermore, external factors such as global politics, fossil fuel prices and electricity imports also
influence the CAWEIS, and make foresight exercises extremely difficult.
Influencing technological change towards a sustainable direction does not only involve technical
change but also changes in the social dimension, such as user practices, regulation, and industrial
networks (Geels, 2002, Linstone, 2004). The concept of "Innovation System (IS)" is a heuristic attempt
developed to analyse all such societal subsystems, actors, and institutions contributing in one way or
the other, directly or indirectly, intentionally or not, to the emergence or production of innovation
(Nelson and Nelson, 2002, Sagar and Holdren, 2002). The central idea behind the innovation systems
approach is that innovation and diffusion is both an individual and a collective act (Edquist, 2001). The
IS approach encompasses individual firm dynamics, as well as particular technology characteristics and
adoption mechanisms. Determinants of technological change are not only to be found within the
individual firm but also in the IS. An IS can be defined as all these institutions and economic structures
that affect the rate and direction of technological change in society (Edquist and Lundvall, 1993). Or as
Freeman (1987) has put it: an IS is “The network of institutions in the public and private sectors whose
activities and interactions initiate, import, modify and diffuse new technologies”. Applying the
systemic aspect of the systems of innovation approach to understanding technological change has large
implications. The systemic character of technological change explains why technological change is
often a very slow process and why it is so difficult to influence (Smits and Kuhlmann, 2004). After all,
the rate and direction of technological change is not so much decided through a simple competition
between different technologies, but is predominantly decided through competition between various
existing innovation systems, both fully developed and emerging ones.
The primary goal of the CAWEIS is the diffusion and use of wind energy, this makes the CAWEIS a
technology specific innovation system:
Network(s) of agents interacting in a specific technology area under a particular institutional
infrastructure to generate, diffuse and utilize technology. Technological systems are defined in
terms of knowledge or competence flows rather than flows of ordinary goods and services.
They consist of dynamic knowledge and competence networks (Carlsson and Stankiewicz,
1991).
This means that all organizations, institutions and relations involved in the diffusion and use of wind
turbines are included in the wind innovation system, this includes influences of different sectoral and
national systems. This decision is in line with previous studies by Hekkert et. al. (forthcoming) and
Orozco (2004). A technology specific IS can be described by three main components: actors,
institutions and networks. These three components are interrelated and have a common goal, which in
our case is the successful diffusion of wind energy technology.
In a technology specific IS the number of actors, networks and relevant institutions is generally
much smaller than in a national system of innovation, a commonly used level of aggregation. This
reduces the complexity and therefore, on this aggregation level, a dynamic analysis seems well
possible. Jacobsson and Johnson (2000) even state that the technology specific approach is the most
dynamic of all the IS approaches.
However, while there currently is a strong emphasis on comparing the structure of different systems
and thereby explaining the differences in performance, less emphasis is placed on the analysis of the
dynamics of innovation systems. A technological system is not static but evolves with alterations in the
content of technologies and products as well as in the relationships among the various technologies
(Carlsson et. al., 2002). In other words, if we are to analyze a technological system we need to
understand the dynamics that make the system change and evolve over time.
3. In this paper we claim that the analysis of technological change should focus on systematically
mapping the activities that take place in innovation systems that result in technological change. Since
these activities have the function to contribute to the goal of the innovation system, which is the
generation and diffusion of innovations, the activities are often called functions of innovation systems
(Jacobsson and Bergek, 2004).
Jacobsson and Johnson (2001), Liu and White (2000) and Rickne (2000) have defined basic functions
that need to be served in a technological system. The (future) performance of an innovation system can
then be measured (or predicted) by analysing how these functions are facilitated by the system. Miles
(2005) also describes foresight as contributing to the functioning of innovation systems. Furthermore,
this close relation between, foresight, system performance and policy is in line with the
recommendation of Georghiou (forthcoming) who states that foresight and system behaviour should
not be treated as separate processes.
The central aim of this paper is to empirically validate the concept of functions of innovation systems
and demonstrate how this framework contributes to better foresight and policy recommendations.
Furthermore, the proposed theoretical framework makes it possible to compare different innovation
systems and explore the relation between innovation system structure and performance.
The paper proceeds by giving an outline of our theoretical framework in section 2, followed by the
analysis and discussion of the CAWEIS in section 3. Finally, general conclusions are presented in
section 4.
2 Theoretical framework: components, structure and functions
This section describes the boundaries and components of the CAWEIS, the system under investigation.
We analyze the Californian wind energy innovation system over a time span of 30 years, starting with
the first oil crisis in 1973. Within this 30 year time frame, we define 5 distinct periods determined by
key events that had a profound effect on the CAWEIS and the fulfilment of the functions. For each of
the periods we will analyze CAWEIS components, structure and functionality as well as the relations
between these system characteristics.
2. 1 CAWEIS components and structure
We include all organizations, institutions and relations involved in the diffusion and use of wind
turbines as well as external influences such as fossil fuel prices in our analysis of the CAWEIS. We
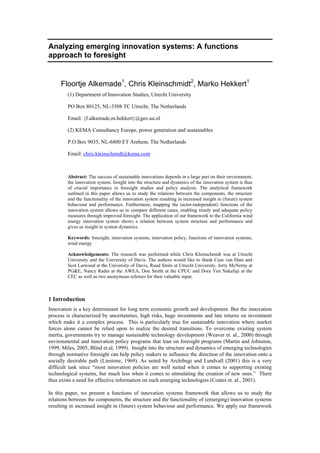
follow Kleinschmidt (2004) in depicting innovation system components and structure (see Figure 1).
Governmental/Political Subsystem
Intermediary
Supply Side Infrastructure Demand Side
Knowledge Infrastructure
Figure 1: Components and structure of the innovation system.
The supply side covers the actors that are involved in the physical production process of wind turbines.
This includes (a) large established manufacturers, such as General Electric and Boeing, (b) new
technology-based companies, which enter the wind turbine market, (c) suppliers of wind turbine
components, such as generator manufacturers, and (d) specialized suppliers such as turbine blade
manufacturers. The demand side consists of actors that consume wind energy directly, such as wind
farmers and utilities, or indirectly such as households or industries that use wind generated electricity.
4. The intermediary infrastructure comprises institutions and organizations aiming at improving the
interface and knowledge flow between the supply and demand side, such as project developers. The
knowledge infrastructure encompasses all organizations that support the other subsystems by
generating, assessing and transferring knowledge. Examples of organizations within this subsystem are
public research institutes, private R&D facilities as well as organizations within the educational system.
Finally, the governmental subsystem consists of government agencies, such as the California Energy
Commission (CEC), the Department of Water Resources (DWR), the U.S. Department of Energy
(DOE) and the California Public Utilities Commission (CPUC).
The particular CAWEIS structure in each period is determined by how well developed each of the
components is and by the relations that exist between components. A subsystem is well developed
when it contains a diversity of actors, which are actively contributing to the diffusion and use of wind
turbines.
2.2 Functions of innovation systems
We analyse the relation between CAWEIS structure and performance (over time) through the functions
of innovation systems concept. This allows us to measure performance of (emerging) innovation
systems by mapping how well each function of the IS is fulfilled. Applying the functions framework
will help us to gain insight in the relation between structure and performance as well as the dynamics
of the system. Thereby aiding policy makers in their assessment of the (desirability of the) direction of
the CAWEIS as well as provide guidelines for additional policy measures. Below, we will give a short
description of each of the seven functions.
F1. Entrepreneurial activities
Entrepreneurs are essential for a well functioning innovation system. The role of the entrepreneur is to
turn the potential of new knowledge, networks and markets into concrete actions to generate - and take
advantage of - new business opportunities, see i.e, Carlsson and Stankiewicz (1991). Entrepreneurs can
be new entrants that have the vision of business opportunities in new markets, or incumbent companies
who diversify their business strategy to take advantage of new developments. Entrepreneurs are very
important in overcoming the uncertainties which are present in the early stage of development of a new
technology.
This function can be analyzed by mapping the number of new entrants, the number of diversification
activities of incumbent actors and the number of experiments with the new technology.
F2. Knowledge development
Mechanisms of learning are at the heart of any innovation process. For instance, according to Lundvall
(1992) “the most fundamental resource in the modern economy is knowledge and, accordingly, the
most important process is learning”. Many scholars such as Hekkert et. al, (2004), Jacobsson and
Bergek (2004), and Johnson (2001), have recognized the importance of knowledge creation for the
innovation process. Therefore R&D and knowledge development are prerequisites within the
innovation system. This function encompasses ‘learning by searching’ as well as ‘learning by doing’
(Arrow 1962).
Three typical indicators to map this function over time are: 1) R&D projects, 2) patents, and 3)
investments in R&D. While these indicators map the effort put into knowledge development, one might
also map the increase in technological performance by means of so called learning curves (Frenken et.
al., 2004).
F3. Knowledge diffusion through networks
According to Carlsson and Stankiewicz (1991) the essential function of networks is the exchange of
information. This is important in a strict R&D setting, but especially in a heterogeneous context where
R&D meets government, competitors and market. Here policy decisions (standards, long term targets)
should be consistent with the latest technological insights and at the same time R&D agendas should be
affected by changing norms and values.
This function includes activities that facilitate interaction between organizations. The focus of this
function lies on knowledge transfer and the accessibility of knowledge and resources. An example of
learning by interacting through networks is the process of venturing, in which a firm can acquire new
capabilities and competencies in cooperation with another firm. Rickne (2001) argues that networking
5. often leads to new resources for innovation such as: intellectual capital, financial capital and physical
capital, thereby stimulating the market and diffusion of a certain technology. Important actors for
learning by interacting are the intermediaries who act as brokers between organizations in the system.
A good example of an intermediary organization is a branch organization. Furthermore, the
government is crucial in assuring and supporting the flow of knowledge from public research to
productive sector. Few firms have the resources to take the risks of developing a new technology
(industry), of which objectives are uncertain, when it has no clear estimate of payback (Autio and
Hameri, 1995).
This function can be analysed by mapping the number of workshops, conferences and research
collaborations devoted to a specific technology topic and by mapping the network size and intensity
over time.
F4. Guidance of the search
Since resources are almost always limited, it is important that, when various different technological
options exist, specific foci are chosen for further investments. Without this selection there will be
insufficient resources left over for the individual options.
This function can be analysed by mapping specific targets set by governments or industries
regarding the use of a specific technology and by mapping the number of articles in professional
journals that raise expectations about new technological developments. By counting the number of
articles that are positive or negative regarding the new technology development, the state of the debate
can be assessed. Foresight or forecasting exercises also provide guidance for the system (Georgiou,
forthcoming).
F5. Market formation
New technology often has difficulty to compete with embedded technologies. Rosenberg (1976) puts it
like this: ‘Most inventions are relatively crude and inefficient at the date when they are first recognized
as constituting a new innovation. They are, of necessity, badly adapted to many of the ultimate uses to
which they will eventually be put; therefore, they may offer only very small advantages, or perhaps
none at all, over previously existing techniques. Diffusion under these circumstances will necessarily
be slow’. Because of this it is important to create protected spaces for new technologies. Furthermore,
series of such niche markets can act as a bridge to mass markets (Andersson and Jacobsson, 2000,
Geels 2002). The government plays a crucial role in creating a niche market, because it holds the power
to change legislation and because it can act as a ‘launching customer’. The government can articulate
demand for a new technology by acting as an early user or by formulating policy targets.
This function can be analysed by mapping the number of niche markets that have been introduced,
specific tax regimes for new technologies, and new (environmental) standards that improve the chances
for new environmental technologies.
F6. Resources mobilization
Resources, both financial and human capital, are necessary as a basic input to all the activities within
the innovation system. For a specific technology, the allocation of sufficient resources is necessary to
make knowledge production possible. Jacobsson and Bergek (2002) and Johnson (2001) emphasize
competence and capital as the most important resources for innovation. An important group of actors in
creating resources to tackle a problem or to explore technological opportunities is the venture capital
industry. A proposal for a venture should identify potential opportunities for positive synergies across
existing technologies, in terms of technology, market and management capacity.
Examples of this activity are funds made available for long term R&D programs set up by industry or
government to develop specific technological knowledge and funds made available to allow testing of
new technologies in niche experiments.
F7. Creation of legitimacy/counteract resistance to change
In order to develop well, a new technology has to become part of an incumbent regime, or has to even
overthrow it. The economic potential of a new technology is not a direct indicator for the capacity that
will be realized in practice. The decisive factor is the motivation of investors to invest in this
technology, and the acceptance and utilization of wind energy by the operator as well as the public.
(Jahraus et al, 1991). Parties with vested interests will often oppose to this force of creative destruction.
In that case, advocacy coalitions can function as a catalyst; they put a new technology on the agenda
(f4), lobby for resources (f6), favourable tax regimes (f5) and by doing so create legitimacy for a new
6. technological trajectory (Sabatier, 1988). If successful, advocacy coalitions grow in size and influence
and may become powerful enough to lead to creative destruction. The scale and successes of these
coalitions are directly dependent on the available resources (f6) and the future expectations (f4)
associated with the new technology.
This function describes activities that influence the acceptance with respect to policy, industry and,
society of the technology on different levels of the system and can be analysed by mapping the rise and
growth of interest groups and their lobby actions.
2.3 Methodology: measuring system performance
Measuring the performance of a technological system is not straightforward but requires careful
consideration of the level of analysis applied and the degree of maturity of the technological system
(Carlsson et al 2002). Many studies focus on diffusion of new technological knowledge as an indicator
for system performance since diffusion curves are easy to construct and diffusion is the final stage of
development and application of new knowledge (Hekkert, 2004). However, this may not be such a
good performance indicator for emerging systems where the diffusion has yet to take off. Furthermore,
when emerging systems do show a high diffusion rate this is not necessarily a sign of a mature and well
functioning innovation system. Such ‘premature take-off’ was observed in the CAWEIS and will be
described in more detail in the next section. The functions of innovation systems approach allows us to
use other indicators for the performance of the developing CAWEIS. The use of several indicators is in
line with recommendations by Carlsson et. al., (2002) who state that several indicators rather than a
single one are preferable, in particular when it comes to assessing the performance of emerging
technological systems.
In this study we use the functions and their related indicators to assess CAWEIS performance. Data
about the CAWEIS was gathered through event analysis Van der Ven et. al., (1999). Furthermore,
interviews with important actors from all system components were conducted to get a complete
overview and to include different perspectives in our analysis. The analysis of key events is presented
in the next section, for a full event record we refer to Kleinschmidt (2004).
3 The California wind energy innovation system (CAWEIS)
California has been involved with the development of wind energy from an early stage. A favourable
political and financial climate resulted in a chain of wind energy developments, which gave California
a frontrunner position in the wind energy market until the late 1980s. After that point in time California
lost its position to countries such as Denmark and Germany. The initial hype around wind in California
is clearly illustrated by Figure 2 and Figure 3, which show diffusion (measured by installed capacity)
and federal funding of R&D respectively. If we consider the learning curve for wind energy in Figure
4, we notice that the wind energy hype occurred at a time when the technology was still immature and
not competitive with respect to the incumbent technology. However, we do not observe an increase in
the rate of diffusion when the technology does reach this competitive stage, indicating that other factors
besides knowledge development are important. The stagnating diffusion can be explained by factors
ranging from an immature state of the technology to environmental opposition and low gas prices,
illustrating the need for a systems approach to the analysis of the CAWEIS.
7. 2000
Capacity (MW)
1500
1000
500
0
1980
1982
1984
1986
1988
1990
1992
1994
1996
1998
2000
Tim e
Figure 2: Total installed capacity in California. (CEC, WPRS reports 1980 – 2001)
160
140
120
Million dollars
100
80
60
40
20
0
1980
1982
1984
1986
1988
1990
1992
1994
1996
1998
2000
Figure 3: Federal funding of wind energy R&D. (GAO: 1980 -1996 and AWEA, 1997 -2001 1)
40
Cost (1996 dollar cents)
35
30
25
20
15
10
5
0
1980
1982
1984
1986
1988
1990
1992
1994
1996
1998
2000
Tim e
Moderate wind High wind
Figure 4: Learning curves for wind energy (GAO, 1999)
1
Fiscal year 1978-92 figures represent actual spending. Fiscal year 1993-98 figures represent adjusted
or actual appropriations.
8. Period 1 (1973-1978) Changing priorities
The first oil crisis led to revised energy policy both at federal and state level and is one of the main
events leading to the emergence of the CAWEIS. Figure 5 shows the incomplete CAWEIS structure of
this first period. The emphasis of the innovation system was on government, supply side and
knowledge infrastructure.
The governmental and political subsystem initiated most activities in this period, however federal
and California state government had different visions on wind energy. The DOE allocated resources for
innovation to public research laboratories (knowledge infrastructure) and large established
manufacturers Boeing, Westinghouse Electric Company, Hamilton Standard and General Electric
Company (supply side) to develop and construct large prototype wind turbines in the context of the
Federal Wind Energy Program (FWEP). FWEP stimulated wind energy through mission-oriented
supply side incentives and focused on large-scale wind energy development (van Est, 1996, Lerner and
Ginosar, 1979).
Contrary to this focus on large scale, in California the small-scale distributed energy paradigm was
stimulated through the Soft Energy Policies of the Brown administration. The emphasis with regard to
sustainable energy technology had therefore been on solar energy. However, The FWEP also raised
awareness about the potential of wind energy in California. Towards the end of the period an
assessment of the California Energy Commission (CEC) showed that California possessed some
excellent wind sites. This led to a change in the renewable energy focus of California and Solar Tax
Credits also became available for wind energy. Furthermore, the administration facilitated wind energy
development with supportive legislation and initiatives. However the IOUs fiercely defended their
monopoly position and opposed this trend by imposing very strict conditions and regulations for the
use of wind energy. Below we will describe how these events contributed to the functionality of the
CAWEIS.
Functional pattern period 1.
F1: Some entrepreneurial activities were performed in the context of the FWEP program where the
DOE allocated resources for innovation to public research laboratories and large established
manufacturers (Boeing, Westinghouse Electric Company, Hamilton Standard and General Electric
Company) to develop and construct large prototype wind turbines. However no entrepreneurial activity
was found at the demand side or the intermediary subsystem.
F2: The FWEP also stimulated research driven knowledge development: The national renewable
energy laboratory (NREL) and the National Aeronautics and Space Agency (NASA) facilitated this
function by conducting fundamental research in wind energy, see Arthur (1982) and Norberg-Bohm
(2000). The manufacturers created knowledge through learning by doing during the construction and
evaluation of the prototypes.
F3: The cooperation between the large manufacturers, DOE, NASA and NREL created knowledge
diffusion through learning by interacting. This cooperation thus created a research based innovation
network between public research laboratories and the turbine manufacturers.
F4: The emphasis of the activities in the emerging CAWEIS was on guidance. The awareness about
the need for more sustainable energy technologies resulting from the first oil crises was a major factor
in the emergence of the CAWEIS.
The FWEP raised expectations and created awareness of the potential of wind energy. The federal
government and the California State Government both guided the direction of the search but with
different priorities. On federal level there had been chosen for energy technologies that fitted the
traditional paradigm of large-scale central energy production.
In California, on the other hand, the Soft Energy Policies of the Brown Administration guided the
direction of the search towards small-scale distributed energy generation. The Brown administration
believed solar energy would have the most potential to fit this paradigm. As a result wind energy had a
low priority in the beginning of this period. There thus existed a misalignment between the guidance at
the federal and at the state level.
In the last phase of the period, the Brown administration became more wind energy minded and started
to change the institutional setup in favour of wind energy. Tax credits, previously only available to
solar energy, became also available for wind energy and the administration facilitated wind energy
development with supportive legislation and initiatives. The Californian Energy Commission (CEC)
carried out an assessment which showed that California possessed some excellent wind sites.
F5: The function market formation (f5) was insufficiently addressed during this period due to a lack of
demand side initiatives. The federal government only supported the mission oriented R&D innovation
9. strategy, and overlooked the market-oriented insights of actors within production and consumption of
wind energy (van Est, 1996). This impeded user-producer relations between potential large-scale wind
turbine manufacturers and electric utilities, leaving the wind energy business without a market.
Moreover, the incumbent utilities obstructed small-scale wind energy development by using their
established monopoly position as the sole provider of electric services. “The distribution of small wind
turbines was blocked by all kinds of rules imposed by the utilities. This raised the price for extra
equipment so much that it was not worth buying a small wind turbine for private use (Don Smith,
2004).
F6: Government agencies such as the Department of Energy (DOE), the Office of Appropriate
Technology (OAT) and the California Public Utilities Commission (CPUC) allocated financial
resources for innovation to public research laboratories and large established manufacturers in the
context of the FWEP. The companies themselves also invested capital, competences and technological
resources
F7: The function creation of legitimacy was insufficiently addressed in this period. This is illustrated
by the fact that many wind energy initiatives in California were impeded by the unsupportive
regulatory system (van Est 1996) as well as by the successful opposition from the IOUs.
1.Entrepreneurial activity
Governmental/Political Subsystem:
DOE, CEC, OAT, CPUC 2.Knowledge development
3.Knowledge diffusion
Supply
Side: Intermediary Demand
Manufactu- Infrastructure Side
4.Guidance
rers and
suppliers
5.Market formation
6.Resources
Knowledge Infrastructure:
NASA, NREL, Sandia
7.Legitimacy
Developed
Underdeveloped
Undeveloped
Figure 5: Structure, relations and functionality of the CAWEIS in the period 1973-1978.
Summarizing we can see that not all functions were adequately addressed during this first period of
development of the CAWEIS. Furthermore, the functions were addressed by a limited number of actors
only. The CAWEIS is thus incomplete with respect to both structure and functionality in this period.
This is an indicator that the system is not ready for successful large-scale diffusion.
Period 2 (1978-1986): The Californian wind boom
This second period is characterized by a large rapid diffusion of wind turbines. When we look at the
system structure of this period (Figure 6) we can see that the CAWEIS shows a progressive
development. Not only did the subsystems develop through new entrants that became heavily involved
with wind energy, but additionally there were relations established between the supply side, the
intermediary infrastructure and the demand side subsystem.
The passing of the Public Utility Regulatory Policies Act (PURPA) in 1978 allowed third-party power
producers, which ended the monopoly power of the IOUs (Asmus, 2001). California created an
extremely favourable climate for third-party power producers by implementing this law with additional
State tax credits and the highest buy-back rates of the U.S. The newly created niche market attracted
the attention of entrepreneurial companies and pioneers, which became involved in wind energy
development (Gipe, 1995). The entrepreneurial companies consisted of turbine manufacturers, wind
10. farmers, and wind project developers. Furthermore the entrepreneurs unified in lobby groups, such as
the Independent Energy Producers (IEP) association and successfully influenced the regulatory system.
However, there was a lack of activities at the supply side of the CAWEIS. Federal stimulation was
concentrated on the commercialization of wind energy in which demand side incentives were given
priority over supply side incentives, such as R&D. President Reagan decreased the FWEP R&D budget
in 1983 (see Figure 3). In California, Proposition 13 limited the budgets for governmental programs
and expenses. The cuts in R&D budgets severely damaged the knowledge base of wind energy, which
resulted in wind turbines of poor quality. Policy makers mistakenly estimated that the technical
knowledge available for making wind turbines was sufficient. Towards the end of the period Danish
manufacturers entered the Californian turbine market and were able to meet demand, thereby
sustaining the fast diffusion and saving the CAWEIS. Below we will describe how these events
contributed to the functionality of the CAWEIS.
Functional pattern period 2.
F1: The newly created niche market attracted the attention of entrepreneurial companies and pioneers,
which became involved in wind energy development. The entrepreneurial companies consisted of
turbine manufacturers, wind farmers, and wind project developers.
F2: The lack of supply side incentives and supportive legislation to improve turbine performance and
quality resulted in an underdeveloped technological knowledge base. NREL and NASA were involved
in turbine testing, but there was a serious lack of testing facilities, quality/performance standards and
simulation software. The heavy competition in the CAWEIS resulted in radical new turbine designs
without the incremental process that is needed to improve performance (Karnøe, 1995). However
manufacturers did not manage to create a production line for a specific turbine design, which limited
possible cost reductions.
Knowledge development activities in this period were limited to learning processes (learning by doing
and learning by using) that occurred during production and maintenance of wind turbines. “The
manufacture companies did their own maintenance and learned a great deal from their installed
turbines” (S. Larwood, 2004).
F3: The fierce competition and secretive attitude in the wind industry prohibited learning by
interacting, thereby limiting the possibilities for knowledge diffusion.
F4: Guidance was also not strongly facilitated in this period. Although the financial and institutional
support created acceptance in the first phase of this period, the lack of performance standards or
priorities in governmental stimulation of wind energy development allowed gaming (abusing) of the
tax credits and the production of bad performing wind turbines. This had as a result that resistance
against wind turbine installation was increasing towards the end of the period.
F5: The passing of PURPA in 1978 facilitated market formation by allowing a third party power
producer and providing energy tax credits, thereby creating a niche market for wind energy.
F6: The competency and capital of the companies that entered the wind energy business gave wind
energy development more resources for innovation. The entrepreneurial companies were also active in
creating a capital market for wind energy. The availability of investment capital attracted even more
companies to the wind energy business.
The ISO4 contracts also provided more resources for innovation making wind energy economically
more attractive resulting in an expanding market. However, overall resources for wind energy R&D
decreased substantially in this period due to budget cuts at both the federal and the State level.
F7: Entrepreneurial lobby groups like the Independent Energy Producers Association (IEP) started to
articulate the voice of the wind industry thereby contributing to the creation of legitimacy. The IEP
association used its political power to influence the Power Purchase Agreement (PPA) negotiations
with utilities. The actions of CEC and CPUC clearly show that the institutional setup including the
regulatory system changed in favour of renewable production. One major example is the ISO4 long
term contract but CEC’s penalty against PG&E for failure to make reasonable efforts to promote
renewables and CPUC’s embracement of renewables are also examples of the changing institutional
setup.
11. 1.Entrepreneurial activity
Governmental/Political Subsystem:
DOE, CEC, CPUC 2.Knowledge development
3.Knowledge diffusion
Supply Demand:
Side: Intermediary IOU
Manufactu- Infrastructur 4.Guidance
rers and eDevelopers, Demand:
suppliers EDF IPP 5.Market formation
6.Resources
Knowledge Infrastructure:
NASA, NREL, Sandia
7.Legitimacy
Developed
Underdeveloped
Undeveloped
Figure 6: Structure, relations and functionality of the CAWEIS in the period 1978-1986.
To summarize, the institutional setup and financial incentives in this period were favourable enough to
create a niche market for wind energy in California. However, important parts of the CAWEIS were
underdeveloped (supply side, knowledge infrastructure) and not all functions were adequately
addressed. This indicates that the commercialization of wind energy began too early and was not
supported by the CAWEIS. The wind energy industry did not manage to achieve enough learning to
produce a cost-competitive wind turbine for commercial use. The governmental cuts in R&D budgets
caused a broadening of the gap between the market and the available technological expertise.
Period 3 (1986-1996): After the wind boom
This period starts with the years after the wind boom, where a weakening demand, an underdeveloped
technological knowledge base and a bad image of the sector (tax scandals) caused companies and
investors to terminate their involvement in wind energy development. When the demand side
incentives expired, the return on investments reduced severely which reduced the capital flow into the
wind energy business. The bubble of high expectations began to collapse and the immaturity of the
wind industry became visible. This resulted in a smaller system and a weaker system structure with
undeveloped subsystems that facilitated few functions.
In the second phase of this period, political and industrial momentum for wind power expansion was
building up again, which resulted in the system structure and functionality depicted in Figure 7. The
wind turbine manufacturer, US Windpower (USW), shifted its focus from the production of small-scale
wind turbines to the production of medium-scale wind turbines for utility use, which opened up
negotiations with the utilities. USW and the utilities aligned their competing interests which resulted in
a feasibility study, followed by the establishment of a consortium between USW, the utility funded
Electric Power Research Institute (EPRI) and the utilities. The consortium’s goal was to produce a
cost-competitive commercial wind turbine. These cooperative research activities resulted in
innovations (variable speed technology) and cost reductions. In contrast with the former periods
research resulted in more applicable knowledge and was conducted in conjunction with both the
demand (utilities) and supply (manufacturers) side of the wind energy innovation system.
DOE responded to these activities by launching a new federal wind energy program. Funds were
made available to support the cooperation between NREL, and two large manufacturers to develop and
produce the advanced wind turbine. An important characteristic of this period is that wind energy
development was strongly driven by an industrial initiative instead of government incentive schemes
alone.
The enactment of the Energy Policy Act in 1992 reintroduced a tax credit system, that aimed at the
production of electricity instead of turbine capacity, thereby stimulating turbine manufacturers to focus
on the performance of wind turbines (Guey-Lee, 2001, IEA, 2001). The Energy Policy Act also
changed the institutional set-up by allowing all private entities a small-scale energy production
installation (Norberg-Bohm, 2000). However, few private power producers invested in wind energy,
12. because gas turbines and cogeneration were far more competitive than wind energy as a result of low
gas prices during the 1990’s. The strong rise of the cogeneration industry resulted in a break up of the
unified independent power alliance, which weakened the wind lobby.
But the intermediary organization Center for Energy Efficiency and Renewable Technology (CEERT),
was effectively lobbying for the renewable energy business. This resulted in the renewable set-aside
law which demanded that a specific portion of future electrical generating capacity would be reserved
for renewable energy sources (Est, 1996).
Other important events in this phase were the standardization and certification activities and
the formation of several wind energy platforms such as the Utility Wind Interest Group (UWIG), the
National Wind Coordinating Committee (NWCC) and the Utility Wind Turbine Performance
Verification Program (GAO, 1996, Ancona and Goldman, 1996). However, in the third phase of this
period the ending of the ISO4 contracts, the starting restructuring debate and the low gas prices made
an end to the fragile cooperation between utilities and the wind industry. Below, we will describe how
these events contributed to the functionality of the CAWEIS.
Functional pattern period 3.
F1: Entrepreneurial activities were mainly initiated by USW’s desire to (cooperatively) build a
medium scale cost-competitive wind turbine.
F2,F3: The consortium between USW, ERPI and the utilities facilitated knowledge development
through learning by interacting as well as knowledge diffusion. Furthermore, the production tax credits
resulting from the Energy Policy Act also stimulated wind turbine performance improvements.
F4: First, the formation of the consortium gave the wind energy business a new impulse, which raised
expectations and built up momentum. The new federal wind energy program that was launched by the
DOE in response to these activities provided additional positive guidance for the CAWEIS.
Second, standardization and certification activities forced the wind industry to make performance
improvements, thereby reducing the risk of wind energy investments. Another important guidance
event was the enactment of the Energy Policy Act (EPA) which constituted a priority shift from
investment to production tax credits.
However, the CAWEIS also experienced negative guidance during this period. CEC’s attempt to
provide the wind industry with a substitute for the ending ISO4 contracts failed when the Final
Standards Offers number 4 (FSO4) contracts were declared illegal by FERC. The wind industry then
had to negotiate Power Purchase Agreements with the utilities, but the utilities preferred more cost
competitive alternatives such as cogeneration. The strong competition from the cogeneration industry
in the 1990’s thus provided negative guidance for the CAWEIS. The willingness of the utilities to
participate in wind energy diminished even further with the start of the restructuring debate about the
liberalization of the energy sector.
F5: The production tax credits created a market for wind energy. The created demand for wind turbines
was smaller than during the wind boom, but no longer biased by extremely favourable incentives. The
Energy Policy Act also changed the institutional setup by allowing all private entities a small-scale
production installation.
F6: Through EPRI the utilities provided USW with additional resources in terms of funds and
competencies. However, the ending of the ISO4 contracts, combined with low gas prices made the
price for wind energy fall from 12 to 3 dollar cent per kilowatt hour.
F7: Several lobby groups emerged during this period such as the Utility Wind Interest Group and the
National Wind Coordinating Committee. The Utility Wind Turbine Performance Program was
especially designed to resolve barriers experienced by utilities.
13. 1.Entrepreneurial activity
Governmental/Political Subsystem:
DOE, CEC, CPUC 2.Knowledge development
3.Knowledge diffusion
Supply
Side: Intermediary Demand:
Manufactu- Infrastructur IOU, 4.Guidance
rers and eDevelopers, IPP,
suppliers EDF, PPP
5.Market formation
CEERT
6.Resources
Knowledge Infrastructure:
NASA, NREL, Sandia
7.Legitimacy
Developed
Underdeveloped
Undeveloped
Figure 7: Structure, relations and functionality of the CAWEIS in the period 1986-1996.
Summarizing, we see that although the wind industry did not manage to create a process of mass
production, it did achieve major cost reductions and produced a commercial medium scale wind
turbine. However, competition from the gas industry, the ending of the ISO4 contracts and uncertainty
resulting from the restructuring debate left the wind industry in a difficult position. We thus see that
actors from all subsystems are active in the CAWEIS but that not all functions are adequately fulfilled.
Specifically the lack of guidance resulting from both financial and regulatory uncertainty makes it
difficult for actors to determine their best strategy.
Period 4 (1996-2000): Towards a restructured market
This period is characterized by the restructuring of the electricity market into a free market and the
energy crisis that took hold of California in 2000/2001.
In 1996, California enacted Assembly Bill 1890, a final step towards the liberalization of the electricity
market which influenced all subsystems in this period. The deregulation caused underdeveloped
supply, demand and intermediary subsystems, few interactions between the subsystems and the
facilitation of fewer functions (see Figure 8).
The liberalization of the electricity market increased competition, stimulated short-term management
and created uncertain market conditions which resulted in a poor financial climate and a radical
reduction of demand (Beck et. al., 2002). The bankruptcy of prime movers Kenetech Windpower and
FloWind caused a loss of competence for the wind energy industry (GAO, 1996).
The newly created competitive free market did not only block investments in new wind energy
capacity or R&D, but also jeopardized the established generation capacity. And although the
governmental subsystem was less dominant in the restructured CAWEIS, it adopted the Public Goods
Charge (PGC) system, established an Independent System Operator (ISO) and created direct access for
green electricity producers (IPP) in order to reduce these negative effects on the wind energy business,
see Moore (2000). The California Government also provided resources for new renewable generating
capacity through the CEC Renewable Energy Program. However, the IPPs did not manage to negotiate
Power Purchase Agreements (PPA) with the utilities, and the rewarded capacity could not be installed
(CEC, 2002), resulting in 1300MW of rewarded wind projects waiting for a PPA to receive the funds.
14. 1.Entrepreneurial activity
Governmental/Political Subsystem:
DOE, CEC, CPUC 2.Knowledge development
3.Knowledge diffusion
Supply
Side: Intermediary Demand:
Manufactu- Infrastructur IOU, IPP, 4.Guidance
rers and eDevelopers, PPP,
suppliers Consumers
5.Market formation
6.Resources
Knowledge Infrastructure:
NASA, NREL, Sandia, Pier
7.Legitimacy
Developed
Underdeveloped
Undeveloped
Figure 8: Structure, relations and functionality of the CAWEIS in the period 1996-2000.
Although there were still federal wind energy programs such as the Next Generation Wind Turbine
Project and the Wind Powering America program, national energy policy gave hardly any priority to
renewables. Furthermore, uncertainties about many issues such as the extension of tax credits did not
stimulate investors
The period ended with the Californian energy crisis of 2000/2001. To avoid bankruptcy of the
Californian IOUs, the governor decided to cancel the Power Exchange and suspend direct access,
which resulted in the end of a growing green electricity market. One positive side-effect of the energy
crisis, however, was a renewed interest in emerging renewables (CEC, 2002,2003). Below we will
describe how these events contributed to the functionality of the CAWEIS.
Functional pattern period 4.
F1: In 1996 Kenetech filed for bankruptcy protection and in 1997 another domestic manufacturer,
Flowind, filed for bankruptcy protection too (GAO, 1996). Zond Energy Systems remained the only
domestic manufacturer that could produce large capacity machines.
F2, F3: A 1996 DOE study showed that private industry was shifting its R&D priorities away from the
longer term benefits of basic and applied research to an emphasis on process enhancement on the short
term (GAO, 1996), this had a negative impact on the knowledge development function of the CAWEIS.
The establishment and funding of the Public Interest Energy Research (PIER) group within the
Renewable Energy Program resulted in cooperative R&D activities with innovative turbine companies
in order to reduce the cost of wind turbines. Furthermore, the federal government stimulated wind
energy through federal wind energy programs. In 1997 DOE launched the Next Generation Wind
Turbine Project and in 1999 Wind Powering America was launched. This Program created knowledge
about low-speed wind energy.
F4: There were hardly any priorities given to renewables in the National Energy Policy presented in
2001, resulting in a passive investment climate where investors were waiting on the PTCs to come
back. Moreover, the focus of the federal wind energy policy was shifting away from California to other
states with excellent wind regimes, like Texas. This could also be seen in the targets of the wind
powering America program which focused on exploiting areas with good wind resources outside
California.
The period ended with the Californian energy crisis of 2000/2001. The energy crisis affected renewable
energy not only indirect through the financial crisis of the utilities but also in a direct way when the
governor decided to suspend direct access. A positive side effect of the energy crisis is that interest in
emerging renewables increased dramatically due to concerns about black outs and increasing electricity
rates (CEC, 2002). “In the general population renewables got new acceptance and interest from the
energy crisis. But at the utility/merchant generator level, the crisis mentality promoted putting up
natural gas plants as rapidly as possible at any price.” (D. Smith, 2004).
15. F5: AB1890 contributed negatively to market formation for the CAWEIS since the CAWEIS lost its
protective market and could not supply electricity at spot market prices without financial incentives.
The Californian Government tried to support the struggling wind energy business. AB 1890 also
created direct access which allowed IPP’s to bypass the Power Exchange and sell their electricity
directly to green electric service providers. This facilitated market creation and a small green electricity
market emerged. “Even though direct access offered IPP’s a new market, it did not create real financial
benefits for the IPP’s. The problem was that most of the premiums paid for green electricity were
appropriated to green electric service providers instead of the wind energy.” (N. Rader, 2004).
CEC’s Renewable Energy program was instrumental in supporting the supply and demand of
renewables within the market based system of AB1890. The auctions articulated a demand for wind
turbines and created a potential market. However the IPPs did not manage to negotiate power purchase
contracts and the rewarded renewable capacity could not be installed. This resulted in 1300MW of
rewarded wind projects waiting for a PPA to receive CEC’s financial resources for innovation. The
PPA negotiations presented a barrier that severely limited the market creation effect of the auctions.
F6: CEC also supplied resources for innovation to innovative wind turbine companies with a focus on
cost reduction through the Public interest Energy Research (PIER) group. With the enactment of
AB1890 California also adopted the Public Goods Charge System. The PCG was effective in keeping
existing renewable energy online when the financial climate for wind energy became real bad but was
not powerful enough to create more demand. Until this policy was adopted the installed capacity was
declining but when the PCG funds filled up the price gaps between the market gap and the actual costs
for wind energy, the market stabilized again (N. Rader, 2004).
F7: Utilities feared that fluctuations in energy supply, caused by an intermittent energy source, would
jeopardize the reliability of the grid. The establishment of the Californian Independent System
Operator reduced this barrier by ensuring the grid’s reliability.
Summarizing, we see that the institutional change needed to restructure the electricity market created
blocking mechanisms that prohibited the fulfilment of the functions market creation and resources for
innovation. Short term management, competition, uncertainties about the market conditions, the
absence of a capital market and institutional barriers are examples of such blocking mechanisms that
limited the facilitation of the functions in this period. The Californian energy crisis further limited the
fulfilment of the functions market formation and resources mobilization but created positive guidance
for renewable energy technologies.
Period 5 (2001-2003): After the energy crisis
The energy crisis caused the government to change its regime from a free market model to a regulating
authority model, resulting in a CAWEIS structure similar to that of period 4 (see Figure 9).
The IOUs were on the verge of bankruptcy and unable to buy electricity from IPPs or to invest in new
generating capacity which created shortages in electricity supply and unstable electricity prices. To
overcome this situation the Californian Government ordered the Department of Water Resources
(DWR) to be the only buyer of electricity and to negotiate new PPAs for additional generation
capacity. To restore stability of the electricity prices as soon as possible the DWR focused on gas-fired
peak performance facilities resulting in a lack demand for wind generated electricity (Clark, 2001,
Asmus, 2002). The establishment of the California Power Authority (CPA) did not change this
situation (Bolinger and Wiser, 2002). Although it signed letters of intent for 1800 MW of new wind
energy capacity, it could not proceed because the state was not creditworthy enough.
In 2002 the California Government created the Renewable Portfolio Standard (RPS) which requires
retail sellers of electricity to increase their sales of electricity, produced by renewable energy sources
by at least 1 percent per year, achieving 20 percent in 2017 at the latest (CEC, 2003). The RPS
promotes competition among renewable energy developers and technologies to meet the standard at the
lowest cost (Herzog et. al., 2001). “However, the effectiveness of the RPS will depend on the
negotiations for standard contract terms, grid integration issues and transmission issues. Only a few
contract terms have been standardized, so far, which is partially the result of a divided wind power
lobby (N. Rader, 2004).”
16. 1.Entrepreneurial activity
Governmental/Political Subsystem:
DOE, CEC, CPUC 2.Knowledge development
3.Knowledge diffusion
Supply
Side: Intermediary Demand:
Manufactu- Infrastructur IOU, IPP, 4.Guidance
rers and eDevelopers, DWR
suppliers
5.Market formation
6.Resources
Knowledge Infrastructure:
NASA, NREL, Sandia, Pier, CWEC
7.Legitimacy
Developed
Underdeveloped
Undeveloped
Figure 9: Structure, relations and functionality of the CAWEIS in the period 2001-2003.
In spite of the political support for wind energy and the efforts of the CEC to stimulate a wind energy
market, wind turbine installation is still very low in California. Different factors hinder the adoption of
wind energy. Community resistance, avian issues and environmental impact studies have created a
strong opposition, which is delaying permit acquiring for wind energy projects. Furthermore the inflow
of potential new wind turbine manufacturers on the Californian wind energy market is limited by a GE
patent on variable speed technology (the dominant technology). Finally the Californian wind energy
business still suffers from uncertainty due to inconclusive national energy policies (CEC, 2003).
Functional pattern period 5.
F2, F3: The California Wind Energy Collaborative (CWEC) is a cooperative research initiative
between the University of Davis, the wind industry and CEC to deal with grid integration issues
(Nakafuji, Smith, 2003) and thereby contributing to knowledge development and diffusion.
Furthermore, the NREL and turbine or component manufacturers are cooperating in turbine testing and
certification.
F4: Federal renewable energy policies remained unclear on many issues, which resulted in year-to-
year budgeting on wind energy policy. This lack of guidance is reflected in the uncertain provision of
the PTCs and the absence of the PTCs in 2004. There is a strong correlation between the availability of
PTCs and wind energy investments. This created boom and bust periods in wind energy development
and is keeping the wind energy business dependent on inconsequent energy policies. “A lot if
companies are waiting to invest in wind energy until the PTC comes back. It would almost be better to
have no credits at all, than the boom and bust periods we are experiencing now” (J. Mcnerny, 2004).
Furthermore there is a strong environmental lobby against windpower.
F5,F6: The renewable portfolio standard can play an instrumental role in re-establishing a market for
wind energy in California.
At this moment the Californian wind energy innovation system seems on the verge of a new diffusion
period. The implementation of the Renewable Portfolio Standard (RPS) can induce a new period of
rising cumulative capacity. In other case studies a positive relation between RPS and wind power
development is found (Menz and Vachon, 2006). California still possesses excellent wind sites and has
the potential for 6000MW of wind capacity. The price of wind generated electricity has come close to
point where it can compete with fossil generated electricity and the prospective of rising prices of fossil
fuels in the near future will make wind energy even more competitive. Furthermore, the knowledge
infrastructure and the supply side of the system incorporate enough knowledge and competencies to
support a strong diffusion period.
However, these drivers will have to challenge some strong blocking mechanisms which are still
present in the Californian wind energy innovation system. First of all, the integration of an intermittent
energy source and the construction of transmission lines to remote areas for wind energy exploitation
represent important barriers. Overcoming these barriers requires adequate fulfilment of the functions,
17. knowledge development and diffusion and creation of legitimacy. Future negotiations between wind
energy project developers and utilities will determine to what degree the integration and transmission
costs will be internalized in the price of wind energy and thereby also determine how competitive wind
energy will be. Furthermore there are still the standard contracts terms that need to be negotiated
between utilities and project developers and outcome of these negotiations will to a large degree
determine the market conditions (market formation), strong guidance is necessary to ensure alignment
of all CAWEIS subsystems. It is therefore important that California government will streamline these
negotiation processes to avoid unnecessary delays. Fulfilling those conditions is a prerequisite for the
establishment of the CAWEIS as an attractive environment for entrepreneurial activity.
4 General conclusions
Emerging innovation systems are characterized by complexity and path dependency. The analysis of
the CAWEIS has demonstrated that structural analysis and traditional indicators alone do not provide
sufficient insight in the dynamics of such systems. The functions of innovation systems framework in
this paper enables normative foresight studies that guide the emerging innovation system towards a
more sustainable future. This framework uncovers the feedback relation between system structure and
performance and leads to conclusions on the structural, the functional and the policy level.
Period 1 Period 2 Period 3 Period 4 Period 5
F1: Entrepreneurial activity
F2: Knowledge development
F3: Knowledge diffusion
F4: Guidance
F5: Market formation
F6: Resources
F7: Creation of legitimacy
Table 1: Fulfilment of the functions of the CAWEIS where darker shades indicate a more
adequate fulfilment.
Table 1 gives an overview of the functionality of the CAWEIS in the different periods. Here we see
that different functions were dominating each of the periods. Furthermore we see that periods with
large diffusion are characterized by more complete functional patterns than periods of inactivity in the
CAWEIS.
Period 1 Period 2 Period 3 Period 4 Period 5
Governmental/Political subsystem
Supply side
Intermediary infrastructure
Demand side
Knowledge Infrastructure
Table 2: Structure of the CAWEIS where darker shades indicate a more developed subsystem.
On the level of system functionality, we see that facilitation of the functions and evolution of the
system structure follow a similar pattern but that a well developed structure alone does not necessarily
indicate large-scale diffusion (see for example period 3). Our case study provides reasons to believe
that this correlation between functionality and systems structure is mutual. When the structural
components become more developed and the interaction between the structural components increases,
the system functionality also seems to improve. Thus we conclude that apart from addressing all the
functions of the CAWEIS it is also important that system components are well development and that
there is alignment of the components in order to achieve successful diffusion of wind power.
We notice that the way in which the functions entrepreneurial activity and market creation are fulfilled
strongly influences system behaviour. This is consistent with findings in other case studies, e.g.,
(Hekkert et al, 2006). These functions appear to be key activities that stimulate the fulfilment of the
other functions.
Furthermore, knowledge development also was crucial throughout the evolution of the system,
ranging from mostly fundamental and technical knowledge in early development phases mostly
18. fundamental and experimental knowledge is created to applicable, problem solving knowledge for cost
reduction and performance improvement when the technological system enters the market. The fact
that the knowledge infrastructure hardly created any applicable knowledge during the wind boom
created a barrier for wind energy development.
On a structural level, our most important observation is that structural development alone is a
necessary but not a sufficient condition for performance. The relations between structural components
however, do provide insight in (future) system behaviour. The interface between the supply and
demand side of the system also is an important indicator for system functionality. This is illustrated by
the observation that it was often the interaction between system components rather than a single
component that contributed to function fulfilment. Whenever there was an imbalance between the
supply and demand side or when the interaction between these subsystems became blocked, system
functionality declined and wind energy development collapsed.
Finally, with regard to policy we find that short-term policy and short-term management practices are
blocking mechanisms for new technological systems such as the CAWEIS, because new technologies
are often not competitive on the short run and need a long-term vision to develop.
Furthermore, system failures that occur in former periods still influence current performance. In our
case premature convergence toward a particular design, namely large-scale wind turbines, decreased
system variety and led to incompetent technology. Third, radical institutional changes are harmful to
the emerging technological system, because their system structure is only weakly developed and can
easily disintegrate. In our case study the liberalization of the electricity market and the energy crisis of
2000/2001 almost destroyed the wind energy innovation system, affecting both system structure and
functionality.
The analytical framework outlined in this paper allows us to study the relations between the
components, the structure and the functionality of the innovation system resulting in increased insight
in (future) system behaviour and performance. The application of our framework to the California wind
energy innovation system shows a relation between system structure and functionality. This systems
approach allows us to gain insight in performance and system dynamics that cannot be explained by
more traditional performance indicators such as diffusion rates alone. With respect to foresight the
functions of innovation systems approach provides insight on two levels. First, functional analysis of
the system in one period gives us insight in the behaviour of the system in the period under
investigation as well as in future periods. Second, this structured approach makes it possible to
systematically compare empirical data about different emerging technologies which will help us
recognize the patterns of success and failure, providing increased foresight and allowing timely
interventions
Implications of this research towards energy policy indicate that policymakers should formulate energy
policies on system level and not on specific actors or groups of actors alone. Furthermore,
policymakers should formulate long-term and consistent policies in the case of emerging energy
technologies.
References
Ancona, D.F. Goldman, P.R. 1996. Wind program technological developments in the United States. Renewable
Energy, vol. 10 no. 2/3.
Andersson, B.A. and S. Jacobsson, Monitoring and assessing technology choice: the case of solar cells. Energy
Policy, 2000. 28(14): p. 1037-1049.
Archibugi, D. and B.Å. Lundvall, eds. The Globalizing Learning Economy. 2001, Oxford University Press.
Arrow, K. (1962). The economic implications of learning by doing. Review of economic studies 29:155-173
Arthur, D. Wind power for the electric utility industry. Lexington Books. D.C. Heath and Company (MA).
Arthur, WB 1994. Increasing return and path dependency in the economy. University of Michigan Press, Ann
Arbor.
Asmus, P. (2001). California crisis: The best argument yet for wind power. Elsevier science.
Asmus, P. (2002). Gone with the Wind. How California Is Losing Its Clean Power Edge to … Texas??! Pathfinder
Communications. The Energy Foundation
Autio, A., Hameri, A.P. (1995) The structure and dynamics of technological systems: a conceptual model.
Technology in Society. 17(4) pp. 365-384.
Beck et al. (2002). Renewable energy for California. Benefits, Status and Potential. Renewable Energy Policy
Project. Research Report 15.
19. Blind, K., K. Cuhls and H. Grupp. Current foresight activities in Central Europe. Technological Forecasting and
Social Change 60, 15-35 (1999)
Bolinger, M., Wiser, R. (2002). Clean Energy Funds Network. Investing in markets for clean energy. Utility-Scale
Renewable Energy Projects: A Survey of Clean Energy Fund Support. Lawrence Berkeley National
Laboratory.
Carlsson, B. and R. Stankiewicz, On the nature, function and composition of technological systems. Journal of
Evolutionary Economics, 1991. 1(2): p. 93-118.
Carlsson, B. and Jacobsson S. (1993). Technological systems and economic performance: The diffusion of factory
automation in Sweden. In D. Foray and C. Freeman (eds.), Technology and the wealth of nations: The
dynamics of constructed advantage, London and New York, Pinter Publishers, pp 77-92.
Carlsson, B., Jacobsson, S., Holmén, M. and Rickne, A. (2002). Innovation systems: analytical and methodological
issues. Research Policy 31. 233-245.
CEC: Californian Energy Comission. Data of the years 1980-1985: Annual reports of the Wind Performance
Report System (WPRS). Data of the years 1985 – 2001.
CEC: California Energy Commission. (2002). Electricity market outlook 2002-2012. Governor Gray Davis.
CEC: California Energy Commission. Nov (2003). Renewable resources development report.
Clark, W.W. (2001). The California Challenge: energy and the environmental consequences for public utilities.
Utility Policy 10:57–61
Coates, V., M. Farooque, R. Klavans, K. Lapid, H.A. Linstone, C. Pistorius and A.L. Porter. On the Future of
Technological Forecasting. Technological Forecasting and Social Change 67:1-17 (2001)
Edquist, C. and B.A. Lundvall, Comparing the Danish and Swedish systems of innovation, in National Innovation
Systems, R. Nelson, Editor. 1993, Oxford University Press: New York.
Edquist, C. Innovation Systems and Innovation Policy: the state of the art. Invited Paper for DRUID's Nelson-
Winter Conference. 2001. Aalborg, Denmark.
van Est, R. (1996) Wind of Change. A comparative study of the politics of wind energy innovation in California
and Denmark. Haasbeek Press, Alphen aan den Rijn.
EWEA,1997. Wind Energy—The Facts. London, European Wind Energy Association.
Freeman, C., Technology policy and economic performance: Lessons from Japan. 1987, London: Pinter Publishers
Ltd.
Frenken, K., M. Hekkert, and P. Godfroij, R&D portfolios in environmentally friendly automotive propulsion:
Variety, competition and policy implications. Technological Forecasting and Social Change, 2004. 71(5): p.
485-507.
GAO: United States General Accounting Office, GAO. Data provided by DOE. 1978-2000
GAO: United States General Accounting Office. Changes in Electricity-Related R&D Funding. 1996.
GAO: United States General Accounting Office, GAO. Report to Congressional Requesters, 1999. DOE’s Funding
and Markets for Wind Energy and Solar Cell Technologies.
Geels, F., Technological Transitions as evolutionary reconfiguration processes: a multi level perspective and a case
study. Research Policy 31: 1257-1274 (2002)
Georghiou, L. and M. Keenan. Evaluation of foresight activities: Assessing rationale, process and impact.
Technological Forecasting and Social Change. In Press.
Gipe, P. Wind Energy: How To Use It Harrisburg, PA: Stackpole Books, 1983
Gipe, P. Wind Energy Comes of Age New York: John Wiley & Sons, 1995
Guey-Lee, L., 2001, Forces Behind Wind Power. In: Renewable Energy 2000: Issues and Trends, Energy
Information Administration, US Department of Energy Washington.
Hekkert, M.P., R.A.A. Suurs, S.O. Negra,, S. Kuhlmann, R.E.H.M. Smits (2006). Functions of innovation systems:
A new approach for analysing technological change. Technological Forecasting and Social Change, In Press.
Herzog, A.V., T.E. Lipman, J.L. Edwards, and D.M. Kammen (2001) Renewable Energy: A
Viable Choice, Environment, 43(10), pp. 8-20
IEA: International Energy Agency. 2001. Renwable Trends and Issues: 2000. For the Department of Energy.
Washington.
IEA: International Energy Agency. (2001) Long-term research and development needs for wind energy for the
time frame 2000 to 2020.
Jacobsson, S. and A. Johnson, The diffusion of renewable energy technology: an analytical framework and key
issues for research. Energy Policy, 2000. 28(9): p. 625-640
Jacobsson, S. and A. Bergek, Transforming the energy sector: the evolution of technological systems in renewable
energy technology. Industrial and Corporate Change, 2004. 13(5): p. 815-849.
Jahraus, B., Lassen, M., Maier, W.M., Uller, K., (1991) Forecast of wind energy capacity in operation by 2005 in
the Federal republic of Germany In: Wind Energy: Technology and Implementation. Elsevier, Amsterdam
20. Johnson, A. Functions in Innovation System Approaches. in Paper for DRUID's Nelson-Winter Conference. 2001.
Aalborg, Denmark.
Johnson, A. and S. Jacobsson (2004). The Emergence of a Growth Industry: A Comparative Analysis of the
German, Dutch and Swedish Wind Turbine Industries. Transformation and Development: Schumpeterian
Perspectives. S. Metcalfe, Cantner, U. Heidelberg, Physica/Springer.
Karnøe, P. (1995). Institutional interpretations and explanations of differences in American and Danish
approaches to innovation. In Scott, W.R. and S. Christensen (Eds.) The institutional construction of
organizations, Thousand Oaks: Sage Publications.
Kleinschmidt, C. Measuring the performance of an innovation system by using the functional approach. Case
study: The Californian wind energy innovation system. Master’s thesis. Utrecht University (2004)
Linstone, H.A. When is a need a need? The problem of normative forecasting in a changing environment.
Technological Forecasting 1 pp. 55-71 (1969)
Linstone, H.A. On the Future of technological forecasting. International Journal of Foresight and Innovation
Policy 1(3/4): 270-276 (2004)
Liu, X. and S. White. (2001). 'Comparing Innovation Systems: A Framework and Application to China's
Transitional Context'. Research Policy 30 (2001) 1091–1114
Lundvall, B.A. (1988). Innovations as an integrative process – from user-producer interaction to the national
system of innovation In: G. Dosi et al.(eds.), Technical change and economic theory, London: Pinter
Publishers
Lundvall, B.A. National Systems of Innovation: Towards a theory of innovation and interactive learning. 1992,
London: Pinter.
Martin, B.R., and Johnston, R. Technology Foresight for Wiring Up the National Innovation System. Experiences
in Britain, Australia, and New Zealand. Technological Forecasting and Social Change 60 pp.37-54 (1999)
Menz, F.C., and Vachon, S. (2006) The effectiveness of different policy regimes for promoting wind power:
Experience from the states. Energy Policy 34:1786-1796
Miles, I. UK Foresight: three cycles on a highway. International Journal of Foresight and Innovation Policy 2(1):
1-34 (2005)
Nakafuji, D.Y.: Californian Energy Commission, Personal communication 2003
Nelson, R. R. and K. Nelson (2002). Technology, institutions and innovation systems. Research Policy 31: 265-
272.
Nelson, R.R., and Winter, S.G. (1977). In search of a useful theory on innovation. Research Policy 6:36-76
Norberg-Bohm, V. (2000). Creating Incentives for environmentally enhancing technological change: Lessons from
30 years of US energy technology policy. Technological Forecasting and Social Change 65:125-148
Orozco, J. (2004) Impacts of Innovation on Performance: The introduction of cleaner technologies in the
cooperative palm oil sector costa rica. DRUID Summer conference.
Rader, N: Californian Wind Energy Association. Personal communication 2003.
Rickne, A. (2000). New Technology-Based Firms and Industrial Dynamics: Evidence from the Technological
Systems of Biomaterials in Sweden, Ohio and Massachusetts, Department of Industrial dynamics, Chalmers
University of Technology.
Rickne, A. (2001). Assessing the functionality. DRUID nelson-winter conference. Aalborg, Denmark.
Righter, R. W. (1996). Pioneering in wind energy: the California experience. Renewable Energy 9(1-4 ):781-784
Rosenberg, N. Factors affecting the diffusion of technology. In: Perspectives on Technology, N. Rosenberg, Editor.
1976, Cambridge University Press: Cambridge.
Rosenberg N. and Kline, S.J. 1986. An overview of innovation In: R.Landau, N. Rosenberg, The positive sum
strategy: harnessing technology for economic growth, National Academic press, Washington DC.
Sabatier, P.A. An Advocacy Coalition Framework of Policy Change and the Role of Policy-Oriented Learning
Therein. Policy Sciences, 21(2-3): p. 129-168, 1988.
Sagar, A.D. and J.P. Holdren, Assessing the global energy innovation system: some key issues. Energy Policy,
2002. 30(6): p. 465-469.
Simon, H.A., (1957). Models of man, New York, Wiley
Smits, R. and Kuhlmann, S. (2004) ‘The rise of systemic instruments in innovation policy’, International journal
of Foresight and Innovation Policy 1(1/2) 4-32
Van de Ven, Polley, D.E., Garud, R. and Venkataraman, S. The innovation journey. Oxford University Press,
1999.
Weaver, P., Jansen, L., Grootveld, G., Spiegel, E. van, Vergragt, P., Sustainable Technology Development. 2000,
Sheffield, UK: Greenleaf Publishing.
Wilson, I. Technology Foresight in an age of uncertainty. International Journal of Foresight and Innovation Policy
1(3/4):207-217 (2004)