Community Forestry International (2011) Umiam Sub-Watershed REDD+ Project, Me...
L verchot c loss luc tropical peatlands
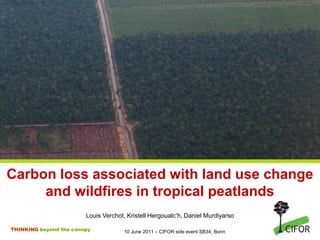
1. Carbon loss associated with land use change
and wildfires in tropical peatlands
Louis Verchot, Kristell Hergoualc’h, Daniel Murdiyarso
THINKING beyond the canopy 10 June 2011 – CIFOR side event SB34, Bonn
2. Indonesia is #5 in the top 10 list of polluters
CO2e
Country MtCO2e World Total Per Person
China 7,216 16.4% 5.5
United States of America 6,931 15.7% 23.5
European Union (27) 5,329 12.1% 10.9
Brazil 2,856 6.5% 15.3
Indonesia 2,046 4.6% 9.3
Russian Federation 2,028 4.6% 14.2
India 1,870 4.2% 1.7
Japan 1,387 3.1% 10.9
Germany 1,005 2.3% 12.2
Canada 808 1.8% 25.0
THINKING beyond the canopy
3. Indonesia’s emissions
2005
Average between 2001 and 2005:
~ 1.8 billion tons Energy
Industry
Agriculture
Waste
2002
LUCF
Energy Peat Fire
Average emission year: 2.0 billion tonnes of CO2
Industry
Agriculture
Waste
LUCF
Peat Fire
High emission year: 2.6 billion tonnes of CO2
THINKING beyond the canopy
Data source: Min. Envi. Jakarta
4. BAPENAS estimates that the problem will grow
Under BAU, peat will become the main source of emissions. In 2005-06, peat land
accounts for almost 50% of national emissions, while its contribution to Indonesia’s
total GDP is only about USD1.06 billion (0.26%)
2.95
3
Energy
Emissions (Gt CO2e)
2.5
2 1.76 Industry
1.35 Agriculture
1.5
Forestry
1 Waste
0.5 Peat
0
2000 2005 2020
THINKING beyond the canopy
5. LAND COVER OF LICENSED PEAT LANDS
Oil Palm HTI HPH 10%
0%
2% 9% 13% 3% 5% 1% 2% 7%
1%
24% 27% 30% 4%
1% 34% 34%
20% 45%
10% 1%
0%
0%
0% 24% 2% 9%
7%
10%
1% 0% 34%
10% 20%
Total = 842.498 ha (20% in >3m) Total = 2.014.794 ha (31% in >3m) Total = 2.811.280 ha (24% in >3m)
0%
Cropland Oil palm Grassland
Other land Settlement Wetland
Primary forest Secondary forest Plantation
THINKING beyond the canopy
6. LAND COVER OF NON-LICENSED PEAT LANDS
Total = 15.722.819 ha (14,9% in >3m)
1%
7%
26% 7%
22%
29% 6%
2%
0%
Cropland Oil palm Grassland
Other land Settlement Wetland
Primary forest Secondary forest Plantation
THINKING beyond the canopy
9. Tropical Peat forests
(freshwater wetlands)
There are about 441,000 km2 of tropical
peatlands ~11% of the total peatland area;
volume is ~18 - 25% (Page et al. 2010).
Southeast Asia is home to 25 million
hectares of peatlands, or 56% of all
tropical peatlands.
Total C storage in these ecosystems may
be among the largest forest C pools on
Earth. Yet data are lacking quantifying
these globally significant carbon stores.
Tropical peat forests are excellent
candidates for inclusion in REDD+
strategies, but critical information on
carbon pools and land use is needed in
order to be effective.
THINKING beyond the canopy
10. Methodological approaches
Stock difference approach Input-output approach
Before After Before After
Cin F Cout F Cin OP Cout OP
CF COP ΔCF ΔCOP
= Cin F – Cout F = Cin OP – Cout OP
C loss = CF - COP C loss rate = ΔCF - ΔCOP
C loss rate = C loss / time C loss = C loss rate × life time
THINKING beyond the canopy
11. Tropical peat lands store large amounts of carbon
Total storage 81.7 – 91.9 Gt C (Page et al. 2011)
Indonesia has the largest area of tropical peats
• 210 000 – 270 000 Km2
• Estimated Carbon stock : 55 ± 10 Gt
(Jaenicke et al. 2008)
• Average 5.5. m peat depth (Page et al. 2011)
THINKING beyond the canopy
12. Carbon loss estimates
Literature review
Southeast Asian peatlands
C stocks, peat C fluxes
56 studies
2 publications
Murdiyarso D, Hergoualc'h K, Verchot LV (2010) Opportunities for
reducing greenhouse gas emissions tropical peatlands. PNAS 107,
19655-19660.
Hergoualc’h K., Verchot L.V. (2011) Stocks and fluxes of carbon
associated with land-use change in Southeast Asian tropical peatlands: a
review. Global Biochemical Cycles. 25:GB2001, doi:10.1029/2009GB003718.
THINKING beyond the canopy
13. Carbon loss from
wildfires
Stock change approach
Land-use type C stock loss (Mg C ha-1)
before fire
Burnt vegetation Burnt peat Total
Intact forest 152 ± 36 285 ± 67 436 ± 77
Logged forest 35 ± 36 285 ± 67 320 ± 77
Oil palm plantation 32 ± 9 285 ± 67 316 ± 67
Acacia plantation 28 ± 2 285 ± 67 313 ± 68
C loss: 65 – 90% from peat
THINKING beyond the canopy
14. Peat forest conversion to oil palm
Combination of the 2 methodological approaches
Stock difference approach: Aboveground biomass C loss
Input – output approach: Peat C loss
Peat C stocks:Difficulties & Limits
Bulk density
Presence logs
High water table level
THINKING beyond the canopy
15. Peat domes are very large and
difficult to measure accurately
THINKING beyond the canopy
Source: Jaenecke et al., 2008
16. Peat C stocks: Difficulties & Limits
Peat depth (up to 20 m), limited number profiles
(PS Konsultant 1998)
Subsidence is a result of compaction, shrinkage and oxidation
THINKING beyond the canopy
Source: Peter van der Meer & Caspar Verwer
17. C fluxes into and out of the peat
Heterotrophic soil
Litterfall respiration
CH4
Land clearing
fire
Root mortality Soluble & physical removal
Heterotrophic soil respiration = peat oxidation = peat decomposition
Heterotrophic soil respiration = Total soil respiration - root respiration
THINKING beyond the canopy
18. Peat C balances in the forest and
in the oil palm plantation
After
Before
Soil heterotrophic respiration 9.3
Land clearing fire 4
Litterfall 1.5
Root mortality 3.6
∆Cpeat F = 0.75 Mg C ha-1 y-1
Soluble & Physical Removal 1.0
= 19 Mg C ha-1 25 y
∆Cpeat OP = Cin peat – Cout peat
= - 9.2 Mg C ha-1 y-1
=THINKING Mg C ha-1 25 y
- 230 beyond the canopy
19. Peat forest conversion to oil palm
plantation
Before After
∆Cpeat F = 19 Mg C ha-1 25 y ∆Cpeat OP = - 230 Mg C ha-1 25 y
- 249 Mg C ha-1 25 y
CAbvgrnd biomass F = 180 Mg C ha-1 CAbvgrnd biomass OP = 24 Mg C ha-1
-156 Mg C ha-1 25 y
C loss = 405 Mg C ha-1 over 25 years
⇒
C loss: 61 % from peat
THINKING beyond the canopy
20. Conclusions
Very large carbon loss
C loss: 60-90% from the peat
⇒ REDD mechanism should prioritize peat swamp forests
Gaps knowledge on C cycle in tropical peatlands
⇒ Greenhouse gas accounting methods: heterotrophic soil
respiration (N inputs), allometric models specific to peat swamp
forests
N2O: Global warming potential 300
⇒ Increase in N2O emissions due to land-use change in tropical
peatlands?
THINKING beyond the canopy
21. Thank you
www.cifor.cgiar.org
CIFOR advances human well-being, environmental conservation, and equity by conducting
research to inform policies and practices that affect forests in developing countries.
THINKING beyond the canopy