2. 2 R.L. Lozano et al. / Environment International xxx (2011) xxx–xxx
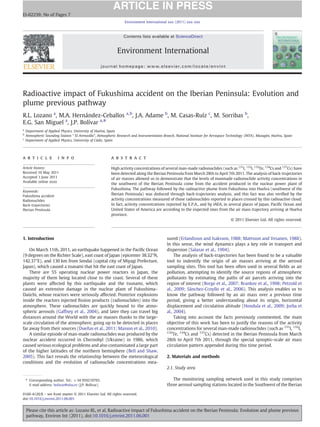
Fig. 1. Location of Iberian Peninsula in the world, and monitoring stations defined as El Arenosillo, Puerto Real, and El Carmen.
Peninsula (Fig. 1): 1) “El Carmen” (CRM), in Huelva city, 2) “Puerto 2.2. Samplings
Real” (PRE), close to Cadiz city, and 3) “El Arenosillo” (ARE), close to
the National Park of Doñana. In each sampling station, the aerosol samples (PM10, grain size
“El Carmen” sampling station is located at the Campus of the b10 μm) were collected onto quartz fiber filters (QF20 Schleicher &
University of Huelva (37.28° N, −6.91° W), in the city of Huelva Schuell, 25.4 cm × 20.3 cm) with high volume samplers working at a
(population ~150,000 inhabitants). The characteristics of the surround- flow rate of 40 cfm (68 m 3 h − 1). The sampling period studied in this
ing area allow us to classify this site as an urban sampling station work ranges from March 15th 2011 to April 17th 2011, with a
affected by a very close chemical industrial complex (3 km and more). sampling time of 24 h during the episode and 48 h for the remaining
“Puerto Real” sampling station is located at the Campus of the University samplings. Prior to the aerosol sampling, the filters are weighed
of Cádiz in Puerto Real village (36.53° N, −6°19° W), and sited very close several times until the mass is constant. The filter weighing was
to the Metropolitan Area of the Bay of Cádiz city (population ~650,000 carried out with a precision of 0.1 mg inside a chamber with
inhabitants), and for that this sampling station is also considered as controlled humidity. After sampling, the filter is newly weighted at
industrial site. “El Arenosillo” station (37.10° N, −6.73° W) is sited in a the same atmospheric conditions to avoid humidity effects.
fairly flat area far from important population nucleus, 1 km from the
coastline, and for that it is considered as a reference station (natural 2.3. Radionuclide determinations
background or baseline). “El Arenosillo” is located 35 km Southeast of
the city of Huelva, and 5 km from the National Park of Doñana (the main In order to calculate the activity concentrations, aerosol filters are
natural protected area in the Western Mediterranean region ), and being cut into two halves, and both weighed accurately. One half was
this one considered as the reference station in the Spanish Air Quality wrapped, pressed in a plastic bag and measured by gamma
Network (Adame et al., 2010). In all sampling stations the air samples spectrometry. The other half was totally dissolved with a mixture of
were collected at about 12 m above ground. strong acids (65% HNO3, 37% HCl, 40% HF). The final solution was used
In addition, activity concentrations measured by E.P.A. and by IAEA for alpha emitters determination as 210Po, U-isotopes, and Th-
have been reported, in sampling sites located in Japan, the Pacific isotopes. The results on alpha emitters are not discussed in this
Ocean and the United States of America, according to the expected paper. A detailed description of pretreatment for air filters can be
ones from the air mass trajectory arriving at Huelva province. found elsewhere (Lozano et al., 2011a).
Table 1
Activity concentrations (mBq/m3) in Huelva City station (CRM).
131 132 132 134 137 134
Date I I Te Cs Cs Cs/137Cs
15/17 –03–11 b0.030 b 0.027 b 0.017 b0.026 b0.032 –
21/23 –03–11 b0.030 b 0.027 b 0.017 b0.026 b0.032 –
28/29 –03–11 3.69 ± 0.19 0.162 ± 0.013 0.175 ± 0.018 0.88 ± 0.05 0.95 ± 0.05 0.93 ± 0.07
29/30 –03–11 0.78 ± 0.04 b 0.027 b 0.017 0.078 ± 0.016 0.093 ± 0.014 0.84 ± 0.21
30/31 –03– 11 0.82 ± 0.07 b 0.027 b 0.017 0.096 ± 0.021 0.114 ± 0.013 0.84 ± 0.21
31–03–11/1–04–11 1.31 ± 0.11 b 0.027 b 0.017 0.153 ± 0.022 0.175 ± 0.024 0.87 ± 0.17
01/04 –04–11 1.19 ± 0.10 b 0.027 b 0.017 0.112 ± 0.016 0.131 ± 0.017 0.85 ± 0.17
05/07 –04– 11 b0.030 b 0.027 b 0.017 0.044 ± 0.007 0.051 ± 0.008 0.86 ± 0.19
08/11 –04–11 b0.030 b 0.027 b 0.017 b0.026 b0.032 –
15/17 –04–11 b0.030 b 0.027 b 0.017 b0.026 b0.032 –
Please cite this article as: Lozano RL, et al, Radioactive impact of Fukushima accident on the Iberian Peninsula: Evolution and plume previous
pathway, Environ Int (2011), doi:10.1016/j.envint.2011.06.001
3. R.L. Lozano et al. / Environment International xxx (2011) xxx–xxx 3
Table 2
Radionuclide activity concentrations (mBq m− 3) in several places around the world after the Fukushima accident (a: data taken from IAEA (2011); b: data taken from US E.P.A.
(2011)).
131 132 132 134 137
Place (latitude, longitude) Sampling I I Te Cs Cs Reference
dates
Tokyo (Japan) (35.70°N, 139.72E) March 15–March 19 5300 5200 – 1200 1200 a
Takasaki (Japan) (36.50°N, 138.97°E) March 15–March 19 3000 2200 5400 1400 3000 a
Saipan Northern Mariana Islands (USA) (15.18°N, 145.76°E) March 21–March 24 0.33 to 29 ND 0.3 to 3.7 0.21 to 0.25 0.15 to 1.5 b
Anaheim California (USA) (33.83°N, −117.88°W) March 18–March 22 2.9 to 6.3 0.67 to 0.81 0.70 to 0.81 0.28 to 0.63 0.055 to 0.30 b
Montgomery Alabama (USA) (32.22°N, −86.27°W) March 24–March 31 2.0 to 5.5 ND ND–3.5 ND ND–0.067 b
Orlando Florida (USA) (28.55°N, −81.37°W) March 24 7.4 0.444 0.888 0.555 0.703 b
El Arenosillo Huelva (Spain) (37.10°N, −6.73°W) March 29−April 7 0.07 to 0.80 ND ND ND–0.084 ND–0.127 This work
Puerto Real Cádiz (Spain) (36.53 N, −6°19°W) March 29–April 7 0.07 to 0.63 ND ND 0.045 to 0.052 0.079 to 0.120 This work
Gamma measurements of the atmospheric filters were performed used to comprise and understand the information inside each set of
with an XtRa coaxial Ge detector (Canberra), with 38% relative back-trajectories calculated for both sites.
efficiency, FWHM of 0.95 keV at the 122 keV ( 57Co), and 1.9 keV at the
1333 keV ( 60Co). The detector is coupled with a set of standard
electronic components, including a multichannel analyzer, and it is 3. Results and discussion
surrounded with 15 cm thick Fe. Details on the efficiency calibration
for air filters are given elsewhere (Martínez-Ruiz et al, 2007). 131I, 132I, 3.1. Activity concentrations
132
Te, 134Cs, 137Cs activities were determined through their following
photon emissions: 364.48 keV (Pγ 81.2%), 667.69 keV (Pγ 98.7%), Table 1 shows the activity concentrations at El Carmen sampling
228.16 keV (Pγ 88.0%), 604.7 keV (Pγ 97.6%), and 661.66 keV (Pγ site (Huelva City). As it can be observed from this table, the highest
85.2%), respectively (Kocher, 1981). Background levels for 131I, 132I, activity concentrations of fission products were obtained on 28th
132
Te, 134Cs and 137Cs activity concentrations measured from 2004 to March. After this date, the activity concentrations decreased and
2011 in Huelva were always below the MDA values (Table 1). remained approximately constant during the following days until
reaching values below detection limits. As it can also be observed from
this table, the activity concentrations are generally below the
2.4. Air masses back-trajectory analysis Minimum Detectable Activity from 4 April, which have been
calculated according to Currie (1968, 1995). These results are in
In order to calculate the set of back-trajectories during the agreement with the change in the wind direction occurring during
radioactive episode period, the Hybrid Single Particle Lagrangian days 4–5 April. Additionally, the obtained 134Cs/ 137Cs activity ratios in
Integrated Trajectory (HYSPLIT) model, Version 4, has been used. This Huelva province (Table 1) are similar to those ones obtained in the
model was developed by the NOAA's Air Resources Laboratory (ARL) area of Japan several days after the Fukushima accident (Table 2).
(Draxler and Hess, 1998; Draxler et al., 2009). The GDAS meteoro- The temporal evolution of both 131I and 137Cs concentrations in
logical files generated from the Global Data Analysis System model, CRM station (Huelva city) are shown in Fig. 2, in order to have a better
and maintained by the ARL have been used as data input. GDAS files understanding of this radioactive episode. From this figure, it can be
have a temporal resolution of three hours, with a data gridded of observed that 131I and 137Cs activity concentration levels in Huelva
1° × 1° in latitude and longitude, including upper level information in city remained below the detection limits during the previous days of
23 pressure levels. the Fukushima accident. Once the radioactive plume arrived in
Kinematic 3D-back-trajectories have been calculated using the Huelva, the maximum activity concentrations were obtained during
vertical wind component information given by GDAS meteorological days 28 and 29 of March. After 5 April, once the wind direction
files. The capability of these files to determine the air mass arrival over changed and another air mass arrived here, the activity concentra-
this area has been validated through meteorological soundings tions decreased to background levels.
(Hernández-Ceballos et al., 2011). Trajectory duration of eight days
has been considered since this time interval is enough for the
influence of synoptic air flows to be adequately represented. In order
to understand the behavior of the air masses circulating in lower
levels, hourly back-trajectories at three different heights have been
calculated at 500 m, 1000 m and 1500 m over Huelva city (37.28° N,
−6.91° W) from 26th March to 6th April.
In addition, 8-days back-trajectories at Washington DC (38.89° N,
−77.02° W) were calculated at the same heights from 18th to 29th
March to check the connection between the air flows from the Pacific
Ocean and air masses over the east coast of North America, where
activity concentrations were previously measured by E.P.A. This city
has been taken as reference station of the east coast of North America,
although the E.P.A monitoring data only show values above
background in the southeast coast (Montgomery, Jacksonville,
Orlando). However, due to the atmospheric dispersion phenomenon,
there may be found values above background over Washington.
Once calculated the set of back-trajectories for Washington DC and
Huelva city, the daily average path (centroid) was calculated for each
day of the period over each city. Each centroid was calculated using
24 hour back-trajectories per day, so, each one represents the 8-day
backward dynamic pattern over both sites. This technique has been Fig. 2. Temporal evolution of 131
I and 137
Cs in Huelva City (CRM).
Please cite this article as: Lozano RL, et al, Radioactive impact of Fukushima accident on the Iberian Peninsula: Evolution and plume previous
pathway, Environ Int (2011), doi:10.1016/j.envint.2011.06.001
4. 4 R.L. Lozano et al. / Environment International xxx (2011) xxx–xxx
Huelva city and to justify the transport of radionuclides from
Fukushima into the south western of the Iberian Peninsula, which
has been indicated in the previous section, the dynamic of air masses
has been studied over this area during this period. HSYPLIT model has
been used to calculate back-trajectories at three different vertical
heights, 500, 1000 and 1500 m over this sampling point.
Trying to minimize the uncertainty calculation associated to each
trajectory (Stohl, 1998), due to the accumulating errors caused by the
computation of trajectories with a large temporal coverage, the air
mass analysis has been carried out in two steps. In a first step, hourly
back-trajectories with a temporal coverage of eight days have been
calculated over Huelva city (as representative site in the Southwest of
Iberian Peninsula) from 26th March to 6th April. And secondly, taking
into account that the corresponding radioactive episode comes from
North East of the USA (see Table 2 and Fig. 4), the city of Washington
DC was selected as a reference point of the east coast of North America
to compute the hourly backward trajectories from 18th to 29th March
with a temporal coverage of 8 days at 500, 1000 and 1500 m. Thus,
joining both studies it was possible to analyze the dynamic of air mass
over Huelva city with a temporal coverage of 16 days.
Fig. 3. Temporal evolution of the maximum 131I and 137Cs activity concentration registered
Once calculated the sets of back-trajectories over Washington DC
in the different monitoring sites around the world after Fukushima nuclear accident.
and Huelva at 500, 1000 and 1500 m, the analysis of air mass pathway
at each height revealed a similar backward circulation during the
In order to study the routes followed by the air masses from previous 8 days over each site respectively. This fact indicates a large
Fukusima (Japan) to reach Spain, the analysis of the spatial and coupling degree among these atmospheric layers from 18th to 29th
temporal evolution of the radioactive cloud was carried out. March over Washington DC and from 26th March to 6th April over
Table 2 shows the radionuclide activity concentrations of interest Huelva. Taking into account this vertical behavior, the set of back-
in different locations crossed by the radioactive plume originated in trajectories obtained at 1000 m have been taken as reference to
Fukushima. As it can be expected, the highest values for radionuclide represent the circulation over both sites.
concentrations are obtained in areas close to Fukushima (March Once the vertical height was set, the corresponding daily centroids
12th–19th). Days after the accident, the cloud traveled through the at 1000 m (average path of 24 hour trajectories) were calculated.
Pacific Ocean, being detected in Saipan (Commonwealth of the Fig. 4 shows the centroids of the previous 8 days at 1000 m from 18th
Northern Mariana Islands, USA). The data reported from this station to 29th March over Washington DC (Fig. 4a), and from 26th March to
correspond to March 21st to 24th. In the following days, the 6th April over Huelva (Fig. 4b).
radioactive cloud reached the west coast of the United States (USA) As it is shown in both figures, each daily centroid for Washington
(Anaheim, California, USA). Later, the cloud continued up to reach the and Huelva has been consecutively referred with a letter from “a” to
east coast of the USA, being detected on March 24th in Montgomery “l” to facilitate the connection between both. The circulation of 28th
(Alabama, USA) and Orlando (Florida, USA). Thus, the cloud March over Huelva is taken as example to analyze this figure. The
continued into the east crossing the Atlantic Ocean and reaching centroid of this day was referred by “c”. This air mass developed a
the Iberian Peninsula approximately on March 28th when the highest movement during the previous 8 days over the Atlantic Ocean and an
values of radionuclide levels were obtained, as it can be seen in inland origin at the east coast of North America on 20th March. To
Table 1 (“El Carmen” station in Huelva), and in “The Arenosillo” and follow the journey of this air mass, the daily centroid of 20th March at
“Puerto Real” (Table 2). It is worth noting that radionuclide Washington DC, “c”, has to be selected. In this case, this centroid
determination in aerosol samples in Huelva province have been showed a displacement along North America with its origin over the
carried out for more than 4 years (Lozano et al, 2011b) and only Bering Sea, on 12th March. Joining both, it is observed that from 12th
natural occurring radionuclides ( 7Be, 210Pb, 210Bi, 210Po and 40K) to 28th March, the circulation of air masses were predominant from
have been detected. the northeast of the Pacific Ocean to the Iberian Peninsula.
As it can be expected, the highest activity concentrations of the Analyzing the results obtained in Huelva city (Fig. 4b), the 8-day
radionuclides determined in this study correspond to Japanese centroids showed a homogeneous westerly circulation from 26th
locations, them being three orders of magnitude higher than the March to 5th April. On 26th March the origin of air masses was located
ones obtained in North America and Europe. As time passes, the cloud in the surroundings of the Iberian Peninsula, whereas from 27th
expands and the activity concentrations decreased to values below March to 4th April the air masses over Huelva city had a large westerly
the detection limits (0.03 mBq m − 3). Fig. 3 shows the maximum displacement, with its origin located in the northeast inland areas of
concentration of 131I and 137Cs recorded in the locations crossed by North America. On the other hand, during the last days of the analyzed
the radioactive cloud after the Fukushima accident. The dates of period, the air mass circulations decreased their displacements, their
measurements are also indicated in this figure in order to infer the origins being located inside the Atlantic Ocean (5th April) and the east
time travel between the different sites considered. of the Iberian Peninsula (6th April).
Therefore, and taking into account this air mass behavior over
3.2. Back-trajectories analysis Huelva, it is possible to affirm that from 27th March to 4th April there
was a connection between southwest of the Iberian Peninsula and the
To understand the temporal evolution of the activity concentra- east coast of North America, due to the origin of these air masses being
tions from 26th March to 6th April measured in the study area over located inland of North America.
Fig. 4. Horizontal and vertical daily centroid (average path of 24 hourly trajectories) during the previous 8 days at 1000 m at a) Washington from 18 to 29 of March and b) Huelva
from 26 March to 6 April. The numbers of the centroids are the percentage of hourly trajectories used, and the identification number. Each daily centroid is consecutively referred
with a letter from “a” to “l” in both cases.
Please cite this article as: Lozano RL, et al, Radioactive impact of Fukushima accident on the Iberian Peninsula: Evolution and plume previous
pathway, Environ Int (2011), doi:10.1016/j.envint.2011.06.001
5. R.L. Lozano et al. / Environment International xxx (2011) xxx–xxx 5
Please cite this article as: Lozano RL, et al, Radioactive impact of Fukushima accident on the Iberian Peninsula: Evolution and plume previous
pathway, Environ Int (2011), doi:10.1016/j.envint.2011.06.001
6. 6 R.L. Lozano et al. / Environment International xxx (2011) xxx–xxx
Fig. 4a shows the 8-day centroid obtained for Washington DC This set of trajectories represents the 19.5% of the hourly forward
back-trajectories from 18th to 29th March at 1000 m. As it is observed, trajectories computed between 11 and 13 March from Fukushima. The
during this period there were two different wind patterns over the displacement of air masses over the Pacific Ocean, the United States
east coast of North America. From 18th to 24th March a westerly air and the Atlantic Ocean, and its arrival in the surrounding of the Iberian
mass circulation was detected over this area. During this period, the Peninsula has been observed. These air mass circulations during this
daily centroids of 19th and 20th March showed a westerly air mass period make possible radionuclides from Fukushima accident reach
circulation with its origin in the Bering Sea, over the NE Pacific Ocean. the Iberian Peninsula, and as a consequence, to confirm the origin of
In this sense, considering the time covered of these air masses the activity concentrations in Huelva city.
(8 days), the origin of these circulations coincided with the Japanese
earthquake and, so, with damages in the nuclear plant of Fukushima. 4. Conclusions
For this reason, we can suggest that this air mass behavior could be
the responsibility of the radionuclide concentrations measured in the In this paper the way the radioactive plume coming from the
east coast of North America during the following days, as it is shown in Fukushima accident has reached the South of Europe (Iberian
Table 2. On the other hand, from 24th to 29th March northerly flows Peninsula) has been studied and explained. In a first step the increase
were predominated over this area during the previous 8 days. in air activity concentrations of radionuclides from nuclear fission,
By connecting the results obtained for the back-trajectories over such as 131I, 132I, 132Te, 134Cs and 137Cs in Huelva province has been
both Huelva and Washington DC during the previous 16 days, a wind shown. In a second step, and through back-trajectory analysis, it has
corridor from the Bering Sea to the Iberian Peninsula was observed in been demonstrated that the radioactive plume producing the increase
27–29 March, coinciding with the maximum of concentrations in those radionuclides is clearly coming from the geographical region
measured in the southwestern Iberian Peninsula. After these days, the of Japan (NE Pacific Ocean).
progressive change in the dynamics of air masses over the east coast of The analysis of back-trajectories has shown that the air mass over
North America tended to break this wind channeling, despite the the South of the Iberian Peninsula during the radioactive episode
continuous arrival of westerly flow over the southwest of the Iberian came from the east of the USA (8 days before). Furthermore, this air
Peninsula. This change happened in the same dates that a progressive mass was over the NE Pacific Ocean 8 days before. The activity
decreasing in the radionuclides concentrations was observed. concentrations of different radionuclides determined from aerosol
As it is shown, the air mass analysis by centroids has allowed the samples collected in Huelva province show that the air mass of this
confirmation of the wind corridor establishment between the Iberian radioactive episode passed throughout the Pacific Ocean–
northeast of the Pacific Ocean and the Iberian Peninsula during the North America–the Atlantic Ocean until finally reaching the South-
period of maximum concentration measured in Huelva. However, in western Iberian Peninsula. As a final conclusion, it seems that the
this case, the use of centroids limits a clear identification of the air atmospheric radioactive plume from the Fukushima nuclear accident
mass location in the surroundings of Japan. In this sense, the centroid has extended first by the North Pacific Ocean, crossed the American
of 19th March is the closest to the nuclear plant, but it is originated in continent, and reached Europe through the Iberian Peninsula.
the Bering Sea. This fact is associated to the meaning of centroids, due
to each one summarizing the daily variability of hourly air masses,
and, so, not representing the full range of possible transport pathway. Acknowledgments
For this reason, to confirm the relationship between the Fukush-
ima accident and the maximum concentrations measured in Huelva This research has been partially supported by the Spanish
from 27th to 29th March, the hourly 3-D forward trajectories from Department of Science and Technology through the project “Deter-
Fukushima have been calculated from 11th to 13th March with a mination of scavenging rates and sedimentation velocities using
temporal coverage of 16 days. reactive-particle radionuclides in coastal waters; application to
Fig. 5 shows the set of air masses that connect the Fukushima area pollutants dispersion” (Ref.: CTM2000-14321-C02-01, and
and the surroundings of the Iberian Peninsula during 11–13 March. CTM2000-14321-C02-02), and the Government of Andalusia project
“Characterization and modelling of the phosphogypsum stacks from
Huelva for their environmental management and control” (Ref.: RNM-
6300).
IBERIAN
ATLANTIC
PENINSULA UNITED
OCEAN
STATES References
Adame JA, De la Morena BA, Bolívar JP. Surface ozone measurements in the southwest
of the Iberian Peninsula (Huelva, Spain). Environ Sci Pollut Res 2010;17:355–68.
Bell JNB, Shaw G. Ecological lessons from the Chernobyl accident. Environ Int 2005;31:
771–7.
AFRICA Borge R, Lumbreras J, Vardoulakis S, Kassomeno P, Rodríguez E. Analysis of long-range
transport influences on urban PM10 using two-stage atmospheric trajectory
clusters. Atmos Environ 2007;41:4434–50. doi:10.1016/j.atmosenv.2007.01.053.
Brankov E, Trivikrama S, Steven P. A trajectory-clustering-correlation methodology of
examining the long-range transport or air pollutants. Atmos Environ 1998;32:
N
1525–34. DOI: 1325-2310/98.
A
CE
Currie LLA. Limits for qualitative detection and quantitative determination: application
O
to radiochemistry. Anal Chem 1968;40:586–93.
C
FI
Currie LLA. Nomenclature in evaluation of analytical methods including detection and
CI
PA
quantification capabilities. Pure Appl Chem 1995;67:1699–723.
Draxler RR, Hess GD. An overview of the HYSPLIT_4 modelling system for trajectories,
FUKUSHIMA dispersion, and deposition. Aust Meteorol Mag 1998;47:295–308.
Draxler RR, Stunder B, Rolph G, Taylor A. HYSPLIT_4 User's Guide, via NOAA.ARL. Silver
Spring, MD: NOAA Air Resources Laboratory; 2009. Dec., 1997, revised Jan., 2009.
Website http://www.arl.noaa.gov/documents/reports/HYSPLIT_user_guide.pdf.
Dueñas C, Orza JAG, Cabello M, Fernández MC, Cañete S, Pérez M, et al. Air mass origin and its
influence on radionuclide activities (7Be and 210Pb) in aerosol particles at a coastal site in
Fig. 5. 16-day hourly forward trajectories from Fukushima from 11 to 13 of March, the western Mediterranean. Atmos Res 2011. doi:10.1016/j.atmosres.2011.02.011.
representing the air mass connection between this area and the surroundings of Iberian Erlandsson B, Isaksson M. Relation between the air activity and the deposition of
Peninsula. Chernobyl debris. Environ Int 1988;14:165–75.
Please cite this article as: Lozano RL, et al, Radioactive impact of Fukushima accident on the Iberian Peninsula: Evolution and plume previous
pathway, Environ Int (2011), doi:10.1016/j.envint.2011.06.001
7. R.L. Lozano et al. / Environment International xxx (2011) xxx–xxx 7
Gaffney JS, Marley N, Cunningham MM. Natural radionuclides in fine aerosols in the Martínez-Ruiz F, Borrego E, San Miguel EG, Bolívar JP. An efficiency calibration for 210Pb
Pittsburgh area. Atmos Environ 2004;38:3191–200. and 7Be measurements by gamma-ray spectrometry in atmospheric filters. Nucl
Hernández-Ceballos MA, Adame JA, Bolívar JP, De la Morena BA. Dynamic of air masses Instrum Methods Phys Res A 2007;580:663–6.
in southwestern the Iberian Peninsula from 1997 to 2007. Dyn Atmos Ocean 2011. Masson O, Piga D, Gurriaran R, D'Amico D. Impact of an exceptional Saharan dust
(Under revision). outbreak in France: PM10 and artificial radionuclides concentrations in air and in
Hondula DM, Sitka L, Davis RE, Knight DB, Gawtry SD, Deaton ML, et al. A back- dust deposit. Atmos Environ 2010;44(20):2478–86.
trajectory and air mass climatology for the Northern Shenandoah Valley, USA. Int J Mattsson S, Vesanen R. Patterns of Chernobyl fallout in relation to local weather
Climatol 2009. Published online www.interscience.wiley.com. conditions. Environ Int 1988;14:177–80.
International Atomic Energy Agency (IAEA). http://documents.ccifj.or.jp/lm/docu- Petzold A, Rasp K, Weinzierl B, Esselborn M, Hamburger T, Dornbrack A, et al. Saharan
ments_radiation/4_-_iaea_march_20th_briefing_short.pdf 2011. dust absorption and refractive index from aircraft-based observation during
Jorba O, Pérez C, Rocandenbosch F, Baldasano JM. Cluster analysis of 4-day back- SAMUM 2006. Tellus 2009;618:118–30. doi:10.1111/j.1600-0889.2008.00383.x.
trajectories arriving in the Barcelona Area (Spain) from 1997 to 2002. J Appl Salazar C, Alvarez C, Silva HA, Dorantes C. Radioactivity in air around nuclear facilities in
Meteorol 2004;43:887–901. Mexico. Environ Int 1994;20:747–56.
Kocher CK. Radioactive decay data tables. National Technical Information Service, U. S. Sánchez-Ccoyllo OR, Silva Dias PL, Fátima Andrade M, Freitas SR. Determination of O3-,
Deparment of Commerce0-87079-124-9; 1981. DOE/TIC-11026. CO- and PM10- transport in the metropolitan area of Sao Paulo, Brazil though
Lozano RL, Bolívar JP, San Miguel EG, García-Tenorio R, Gázquez MJ. An accurate synoptic-scale analysis of back-trajectories. Meteorol Atmos Phys 2006;92:83–93.
method to measure alpha-emitting natural radionuclides in atmospheric filters: doi:10.1007/s00703-005-0139-6.
application in two norm industries. Nucl Instrum Methods Phys Res A 2011a. Stohl A. Computation, accuracy and applications of trajectories — a review and
(Under revision). bibliography. Atmos Environ 1998;32:947–66. DOI: S1352-2310(97)00457-3.
Lozano RL, San Miguel EG, Bolívar JP, Baskaran M. Depositional fluxes and concentrations US E.P.A. (United States Environmental Protection Agency). Website http://www.epa.
of 7Be and 210Pb in bulk precipitation and aerosols at the interface of Atlantic and gov/japan2011/rert/radnet-sampling-data.html 2011.
Mediterranean coast in Spain. J Geophys Res 2011b. (Under revision).
Please cite this article as: Lozano RL, et al, Radioactive impact of Fukushima accident on the Iberian Peninsula: Evolution and plume previous
pathway, Environ Int (2011), doi:10.1016/j.envint.2011.06.001