Katalog-Produk-PSL-PQUBE-Power-Quality-Monitor-by-Tridinamika

PSL Power Standards Lab merupakan pusat global informasi tentang pengukuran teknik tenaga listrik dan kekebalan terhadap gangguan listrik. Setiap hari, insinyur di PSL menangani pertanyaan tentang pengukuran daya dari lebih dari 10 negara, menyatakan kekebalan peralatan jutaan dollar untuk tegangan sags, dan memberikan puluhan baru PQube Power Monitors yang mencatat setiap aspek konsumsi daya dan gangguan di seluruh dunia. PSL bertanggung jawab untuk menjaga 3 IEC standar dan 1 SEMI standar. Memiliki program Power Quality Teaching Toy yang digunakan dilebih dari 150 program teknik di universitas seluruh dunia. Asal Negara : USA Jenis Industri : Power Sensors , Power Quality Certification Kategori Produk : PQube Power Monitor , Power Quality Sensors ,Voltage Sags Generators Hingga kini tridinamika dipercaya sebagai pen- jual / authorized distributor PSL power standards lab di Indonesia. Dapatkan spesifikasi, review untuk referensi pembelian PSL power standards lab . Untuk melihat berbagi produk power quality, voltage sag, voltage dip, standards, power quality testing, sag generator, dip generator, PQube, PQ1, IPC, Industrial Power Corruptor, energy monitor dari PSL Power standards lab KLIK DISINI untuk informasi lebih lanjut dapat menghubungi ; Tridinamika | Test and Measurement www.tridinamika.com email : sales@tridinamika.com

Recommended
More Related Content
Viewers also liked
Viewers also liked (10)
More from PT. Tridinamika Jaya Instrument
More from PT. Tridinamika Jaya Instrument (20)
Recently uploaded
Recently uploaded (20)
Katalog-Produk-PSL-PQUBE-Power-Quality-Monitor-by-Tridinamika
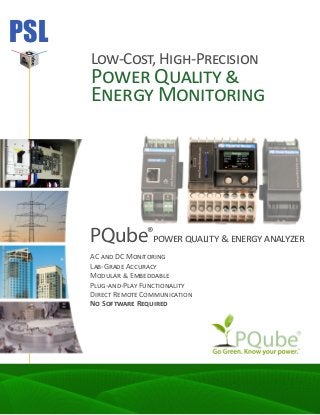
- 1. PSL Low-Cost, High-Precision Power Quality & Energy Monitoring PQube® power quality & energy analyzer AC and DC Monitoring Lab-Grade Accuracy Modular & Embeddable Plug-and-Play Functionality Direct Remote Communication No Software Required
- 2. General • Three-phase, single-phase and split-phase* monitoring 100~690V, 50/60/400Hz. • Self-configuration—auto-detects single-phase, 3-phase, phase-to-phase, delta, wye, corner ground, nominal voltage, nominal frequency, and more. • Two analog inputs, one digital input, up to 4 relay outputs, two temperature-humidity channels. • Direct connect to 100~690V—no PTs required. • Powers from 24 VAC, 24~48VDC, or 100~240 VAC with optional PS1 plug-in module. • Built-in, self-rechargeable Li-Ion UPS with 10 minutes of backup power. • Full color organic LED display, 28+ built-in languages. • DIN-rail or optional panel mount bracket. Power Quality Monitoring • High-speed 256-samples-per-cycle recording. • Power quality disturbances recorded with waveforms and RMS graphs. • Over-frequency and under-frequency events, 1 micro-second high-frequency impulse detection, time-triggered snapshots. • Voltage THD, current TDD and current THD*; voltage and current unbalance; VARs (fundamental* and Budeanu); VAR- hr accumulator*; flicker* (Pinst, PST, PLT). • Voltage and current harmonics and interharmonics—up to the 63rd, with statistics. • Daily, weekly, monthly trends. Cumulative probability, histograms, and more. *New feature in firmware version 2.0 Energy (with current module) • Watts, VA, VARs, True Power Factor, watt-hours, VA-hours. • Carbon footprint meter (in kg), CO2 generated and avoided • Peak averages—single-cycle, 1-minute and 15-minute, and at user-selected intervals. • CT ratios support up to 50,000 amps; PT ratios support up to 6,900,000 volts. • Daily, weekly, monthly trends; load duration curves and more. • Energy accumulators—daily, weekly, monthly. Communication (with ethernet module) • Direct remote access to built-in web server— NO SOFTWARE REQUIRED. • Instant email notification after a power quality disturbance. • Free email account. • Modbus-TCP—read meters with any client, anytime. Compliance • Safety: UL, TUV, ISA-82.02.01 (IEC 61010-1 MOD), CAN/ CSA-C22.2 NO.61010-1, Japan S-mark, GS. • Immunity: IEC 61000-4-5 (6kV peak 100kHz surge), IEC 61000-4-4 (4kV peak EFT bursts), IEC 61000-4-2 Level 1 and MIL-STD-883 (electrostatic discharges), IEC 61000-4-3 (radio frequency fields), IEC 61000-4-8 (magnetic fields). • Emissions: EN 55022 and CISPR 22, radiated and conducted RF emissions. • Accuracy: Full NIST-trace certificate for each PQube. PQube front terminals PQube back terminals Actual size PSLPQubeFeatures
- 3. PSL PQubeApplications Modular& Embeddable ACandDC Temperature &Humidity RemoteAccess(FTP, SMTP,Modbus,Email) PQDIFs Peak&Accumulated Energy 400Hz Monitoring OptionalNetwork Connection 690VAC Multilingual Self-Configuring OpenSource Files NoSoftware Semiconductor Medical Transportation Government Manufacturing Wind & Solar Energy Research Data Centers Telecom Utilities DetectsAllPower QualityDisturbances
- 4. PSLPQubeModules • Up to five channels of current monitoring, includes neutral and earth. • Simple-to-set CT ratios in your PQube (up to 50 kiloAmps). • Crest factor of 350%. • Current waveforms, inrush current. • Power/energy (kW, kWh, kVA, kVAh, kVAR, kVARh, tPF). • Measure unbalance, harmonics, and interharmonics for current. • Peak meters—peak amps, peak kVA, and peak watts. Single-cycle, 1-minute, and 15-minute peaks. Useful for sizing circuit breakers, UPSs, and transformers. • Carbon footprint meter—input your local electric power source infor- mation, and your PQube automatically measures your CO2 footprint directly in kilograms. CT4 Current Sense module • Just pass wires through openings in module (0.34in [8.6mm] maxi- mum diameter) • Part Number CT4-20A-00 for 20A nominal rating • Part Number CT4-50A-00 for 50A nominal rating XCT4 Current Transformer Interface module • Connects directly to current transformer secondary wires—1A or 5A • Part Number XCT4-01A-00 for CTs with 1A output • Part Number XCT4-05A-00 for CTs with 5A output XCT5 Current Transformer Interface module • Connects directly to voltage secondary wires of your CTs—1V, 5V, or 10V. • Part Number XCT5-0.333V-00 for CTs with .333V output • Part Number XCT5-01V-00 for CTs with 1V output • Part Number XCT5-05V-00 for CTs with 5V output • Part Number XCT5-10V-00 for CTs with 10V output • Current transformers with .333V output available from www.powerstandards.com ETH1 Ethernet module • Automatically sends you an email whenever a disturbance occurs, complete with picture and Excel®-compatible attachments. • Built in web server. • See status of your PQube and look at event and trend recordings. • Update your firmware and reset your PQube remotely. • Free email account with each PQube. • Use SNTP for synchronizing to UTC time standard. • DHCP/Fixed IP, POP, SMTP, FTP, Modbus-over-TCP. • Part Number ETH1-10T-00 CTE1 Combined Current and Ethernet module • ETH1 ethernet module and XCT5 current module in a single package. • Smaller footprint—ideal for panel mounting where space is limited. • Part Number CTE1-10T-0.333V-00 for 0.333V nominal rating • Part Number CTE1-10T-1V-00 for 1V nominal rating • Part Number CTE1-10T-5V-00 for 5V nominal rating • Part Number CTE1-10T-10V-00 for 10V nominal rating Current Sensing Modules Network Connectivity Modules CT4 XCT4 XCT5
- 5. PSL PQubeModules PS1 Power Supply module • Power your PQube from 100V~240V, 50/60 Hz. (Your PQube takes power from 24VAC, 24VDC~48VDC without any optional modules.) • Snap multiple PS1 modules together for redundant power from different feeders. • Part Number PS1-100~240-00 PS2 Power Supply module • Power your PQube from 100V~240V, 50/60 Hz. • 24VDC output for powering external accessories. • Part Number PS2-100~240-00 TH1 Temperature/Humidity probe • Monitors ambient temperature and humidity. • Every PQube accepts two electrically isolated probes. • Use one probe for local ambient temperature/humidity, and put the other on an optional 10-meter extension cable for monitoring remote conditions. • Temperature accuracy: Typical: ± 0.5ºC • Humidity accuracy: Typical: ± 4.5%RH (20~80% R.H.) • Part Number TH1-80C-00 ATT1—DC Voltage Monitoring • For high voltage DC monitoring. • Measure 1 differential voltage or 2 voltages relative to earth available. • Part Number ATT1-0600V-00 for 600V nominal rating • Part Number ATT1-1200V-00 for 1200V nominal rating ATT2—DC Power and Energy • For DC power and energy monitoring. • Measures DC voltage (up to 600V). • Measures DC current (with Hall effect sensors). • Part Number ATT2-0600V-00 • DC current sensors available. Power Supply Modules Temperature and Humidity Probe DC Monitoring Modules
- 6. PSLPQubeSampleFiles PQube File Formats Your PQube provides data in several useful formats. • Events, trends, and statistics as universal GIF formats and .CSV data files • Text, XML and HTML summaries • PQDIF files (IEEE standard for power quality data files) Each graph and chart is labeled in two languages (28 languages total). All PQube graphs are generated by your PQube directly, without software, and can be viewed in a browser or opened in any picture viewer. They are included in event notification emails as simple GIF file attachments, and can be forwarded to a third party, such as a facility engineer or utility company. You can see more graphs like these at map.PQube.com—free PQube data streamed live from around the globe. The PQube web interface access screen. From here, you can check your PQube status, access the meters, view events, and give commands to your PQube. Each PQube can be labeled with a unique name and location, making it easy to moinitor multiple PQubes. An overview of a PQube meters screen. All data refreshes on click. Clicking the Events and Trends/Statistics links allows you to see the most important parts of this data in visual form (see following pages). NO SOFTWARE REQUIRED NO SOFTWARE REQUIRED
- 7. PSL PQubeSampleFiles PQube-generated waveform and RMS graphs of a voltage sag recorded at a machine shop. The graphs give you the time, depth, and duration of the event, and a snapshot of your power at the beginning and end of the event. You don’t need any special software to create or read the graphs. With PQube-generated graphs like this you can: • Prove to your utility that a sag happened • Rule out power problems during troubleshooting—by showing that no events occurred • Identify the source of your power problems • Understand how your equipment affects the power in your facility. NO SOFTWARE REQUIRED NO SOFTWARE REQUIRED
- 8. PSLPQubeSampleFiles A PQube-generated daily trend summary with min/avg/max values and statistics. A daily unbalance graph. Unbalance can be a persistent and difficult-to-detect cause of equipment failure and energy loss. NO SOFTWARE REQUIRED NO SOFTWARE REQUIRED
- 9. PSL PQubeSampleFiles Weekly harmonics distortion graph for voltage and current. Voltage harmonics can pollute the grid and affect other loads. Current harmonics increase losses in transformers and wiring. High current harmonics will distort the voltage, which can affect your loads. A “harmonic profile” snapshot. Identify exactly which harmonic is causing problems. Harmonic snapshots can be generated from the PQube on demand, or every 10 or 15 minutes (user-selected). NO SOFTWARE REQUIRED NO SOFTWARE REQUIRED
- 10. Customize your PQube data. All PQube data is available in .CSV format. You can open these files in any spreadsheet program such as Microsoft Excel® and use it to create your own custom graphs and reports. PQube-generated temperature and humidity graph. Your PQube has two temperature-humidity ports, alowing you to monitor the temperature and humidity at two locations, up to 10 meters away from the meter (with optional PSL extension cables). This is important in applications that are sensitive to environmental conditions, such as photovoltaic plants and data centers. PSLPQubeSampleFiles NO SOFTWARE REQUIRED
- 11. PSL PQubeSampleFiles PQube-generated carbon graphs from a PQube monitoring a photovoltaic installation. The graph shows the CO2 avoided on a cloudy day (top) and a nearly perfect day (bottom). NO SOFTWARE REQUIRED