SlideShare une entreprise Scribd logo
1  sur  20
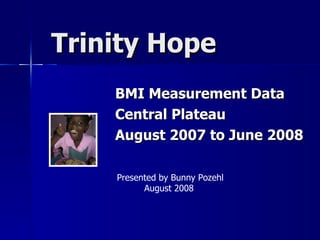
Trinity Hope BMI Measurement Data  Central Plateau August 2007 to June 2008 Presented by Bunny Pozehl August 2008
 
Measurement Data ,[object Object],[object Object]
Data Collection at Evangelical Lutheran School
Data Collection at  Bon Barger
OK135S067
 
BMI in Children ,[object Object],[object Object]
Interpretation of Percentiles ,[object Object],[object Object],[object Object],[object Object],[object Object],[object Object],[object Object],[object Object],OK135S058
Central Plateau Data  565 Children  Numbers of Children per School
Mean BMI by School * Mean differences statistically significant at p < .001 for every school
Overall Mean BMI  Before and After Feeding Program t (df = 564) = -17.8,  p<.001
Numbers of Children
Percentages Below 5 th  Percentile BMI Before and After Feeding Program Males
Percentages Below 5 th  Percentile BMI Before and After Feeding Program Males Before After Difference 4 Years  (n = 30) 46.7 13.3 33.4 5 Years  (n = 20) 40.0 10.0 30.0 6 Years  (n = 34) 58.8 52.9 5.9 7 Years  (n = 27) 48.1 11.1 37.0 8 Years  (n = 47) 31.9 14.9 17.0 9 Years  (n = 20) 25.0 5.0 20.0 10 Years  (n = 16) 31.3 12.5 18.8 11 Years  (n = 20) 25.0 25.0 0.0 12 Years  (n = 13) 15.4 23.1 -7.7 13 Years  (n = 4) 50.0 25.0 25.0 14 Years  (n = 2) 100.0 50.0 50.0 15 Years  (n = 2) 100.0 100.0 0.0 16 Years  (n = 3) 66.7 66.7 0.0 17 Years  (n = 4) 75.0 75.0 0.0 18 Years  (n = 3) 33.3 33.3 0.0
Percentages Below 5 th  Percentile BMI Before and After Feeding Program Females
Percentages Below 5 th  Percentile BMI Before and After Feeding Program Females Before After Difference 4 Years  (n = 38) 39.5 5.3 34.2 5 Years  (n = 37) 37.8 13.5 24.3 6 Years  (n = 36) 50.0 30.6 19.4 7 Years  (n = 33) 48.5 18.2 30.3 8 Years  (n = 36) 27.8 16.7 11.1 9 Years  (n = 30) 30.0 16.7 14.3 10 Years  (n = 35) 22.9 8.6 16.3 11 Years  (n = 20) 40.0 15.0 25.0 12 Years  (n = 5) 40.0 40.0 0.0 13 Years  (n = 8) 62.5 50.0 12.5 14 Years  (n = 3) 100.0 66.7 33.3 15 Years  (n = 2) 50.0 50.0 0.0 16 Years  (n = 2) 50.0 50.0 0.0 17 Years  (n = 2) 100.0 100.0 0.0 18 Years  (n = 0) - - -
Visible Differences  Unfed School   Fed School
Visible Differences  Unfed School  Fed School
James 2: 14-16 ,[object Object]

Contenu connexe

Similaire à BMI Measurements by Trinity/HOPE

Effectiveness of sedentary behaviour interventions on BMI reduction in childr...
Effectiveness of sedentary behaviour interventions on BMI reduction in childr...Effectiveness of sedentary behaviour interventions on BMI reduction in childr...
Effectiveness of sedentary behaviour interventions on BMI reduction in childr...FusePhysicalActivityGroup
 
Aurino adolescent nutrition_9sept2016
Aurino adolescent nutrition_9sept2016Aurino adolescent nutrition_9sept2016
Aurino adolescent nutrition_9sept2016Young Lives Oxford
 
Basic Demographic Indicators_21 Jan 2022.pptx
Basic Demographic Indicators_21 Jan 2022.pptxBasic Demographic Indicators_21 Jan 2022.pptx
Basic Demographic Indicators_21 Jan 2022.pptxHongTrcng
 
Searching for predictors of male fecundity
Searching for predictors of male fecunditySearching for predictors of male fecundity
Searching for predictors of male fecundityChirag Patel
 
Kines 260 Take Home FinalNameDue Friday December 12th at 11 A.docx
Kines 260 Take Home FinalNameDue Friday December 12th at 11 A.docxKines 260 Take Home FinalNameDue Friday December 12th at 11 A.docx
Kines 260 Take Home FinalNameDue Friday December 12th at 11 A.docxDIPESH30
 
13Mar14 - One Year On
13Mar14 - One Year On13Mar14 - One Year On
13Mar14 - One Year OnILC- UK
 
Clive Efford MP – The challenges for the next government
Clive Efford MP – The challenges for the next governmentClive Efford MP – The challenges for the next government
Clive Efford MP – The challenges for the next governmentSport and Recreation Alliance
 
JSM 2017: Newton's Growth Model
JSM 2017: Newton's Growth ModelJSM 2017: Newton's Growth Model
JSM 2017: Newton's Growth ModelJonggyu Baek
 
Benny mat nutradolpreg_9sept2016_session3d
Benny mat nutradolpreg_9sept2016_session3dBenny mat nutradolpreg_9sept2016_session3d
Benny mat nutradolpreg_9sept2016_session3dYoung Lives Oxford
 
Delayed fertility and statistical discrimination against women
Delayed fertility and statistical discrimination against womenDelayed fertility and statistical discrimination against women
Delayed fertility and statistical discrimination against womenGRAPE
 
Improving Family Planning Service Delivery to Adolescents in Ghana: Evidence ...
Improving Family Planning Service Delivery to Adolescents in Ghana: Evidence ...Improving Family Planning Service Delivery to Adolescents in Ghana: Evidence ...
Improving Family Planning Service Delivery to Adolescents in Ghana: Evidence ...MEASURE Evaluation
 
Bite force in Bengalee Children
Bite force in Bengalee ChildrenBite force in Bengalee Children
Bite force in Bengalee ChildrenDr. Roshni Maurya
 
The association between an unhealthy childhood diet and body composition depe...
The association between an unhealthy childhood diet and body composition depe...The association between an unhealthy childhood diet and body composition depe...
The association between an unhealthy childhood diet and body composition depe...CLOSER
 
Workshop on well being over the life course agenda layard
Workshop on well being over the life course agenda layardWorkshop on well being over the life course agenda layard
Workshop on well being over the life course agenda layardStatsCommunications
 
Osteoporosis 2016 | Factors influencing peak bone mass: Prof. Nick Harvey #os...
Osteoporosis 2016 | Factors influencing peak bone mass: Prof. Nick Harvey #os...Osteoporosis 2016 | Factors influencing peak bone mass: Prof. Nick Harvey #os...
Osteoporosis 2016 | Factors influencing peak bone mass: Prof. Nick Harvey #os...National Osteoporosis Society
 

Similaire à BMI Measurements by Trinity/HOPE (20)

Effectiveness of sedentary behaviour interventions on BMI reduction in childr...
Effectiveness of sedentary behaviour interventions on BMI reduction in childr...Effectiveness of sedentary behaviour interventions on BMI reduction in childr...
Effectiveness of sedentary behaviour interventions on BMI reduction in childr...
 
Aurino adolescent nutrition_9sept2016
Aurino adolescent nutrition_9sept2016Aurino adolescent nutrition_9sept2016
Aurino adolescent nutrition_9sept2016
 
growth1.pdf
growth1.pdfgrowth1.pdf
growth1.pdf
 
Basic Demographic Indicators_21 Jan 2022.pptx
Basic Demographic Indicators_21 Jan 2022.pptxBasic Demographic Indicators_21 Jan 2022.pptx
Basic Demographic Indicators_21 Jan 2022.pptx
 
South Africa: A Nation in Denial?
South Africa: A Nation in Denial? South Africa: A Nation in Denial?
South Africa: A Nation in Denial?
 
Searching for predictors of male fecundity
Searching for predictors of male fecunditySearching for predictors of male fecundity
Searching for predictors of male fecundity
 
Kines 260 Take Home FinalNameDue Friday December 12th at 11 A.docx
Kines 260 Take Home FinalNameDue Friday December 12th at 11 A.docxKines 260 Take Home FinalNameDue Friday December 12th at 11 A.docx
Kines 260 Take Home FinalNameDue Friday December 12th at 11 A.docx
 
13Mar14 - One Year On
13Mar14 - One Year On13Mar14 - One Year On
13Mar14 - One Year On
 
Clive Efford MP – The challenges for the next government
Clive Efford MP – The challenges for the next governmentClive Efford MP – The challenges for the next government
Clive Efford MP – The challenges for the next government
 
JSM 2017: Newton's Growth Model
JSM 2017: Newton's Growth ModelJSM 2017: Newton's Growth Model
JSM 2017: Newton's Growth Model
 
Benny mat nutradolpreg_9sept2016_session3d
Benny mat nutradolpreg_9sept2016_session3dBenny mat nutradolpreg_9sept2016_session3d
Benny mat nutradolpreg_9sept2016_session3d
 
Multiple Linear Regression Homework Help
Multiple Linear Regression Homework HelpMultiple Linear Regression Homework Help
Multiple Linear Regression Homework Help
 
Delayed fertility and statistical discrimination against women
Delayed fertility and statistical discrimination against womenDelayed fertility and statistical discrimination against women
Delayed fertility and statistical discrimination against women
 
Improving Family Planning Service Delivery to Adolescents in Ghana: Evidence ...
Improving Family Planning Service Delivery to Adolescents in Ghana: Evidence ...Improving Family Planning Service Delivery to Adolescents in Ghana: Evidence ...
Improving Family Planning Service Delivery to Adolescents in Ghana: Evidence ...
 
Bite force in Bengalee Children
Bite force in Bengalee ChildrenBite force in Bengalee Children
Bite force in Bengalee Children
 
Poster Slide
Poster SlidePoster Slide
Poster Slide
 
Paternal age
Paternal agePaternal age
Paternal age
 
The association between an unhealthy childhood diet and body composition depe...
The association between an unhealthy childhood diet and body composition depe...The association between an unhealthy childhood diet and body composition depe...
The association between an unhealthy childhood diet and body composition depe...
 
Workshop on well being over the life course agenda layard
Workshop on well being over the life course agenda layardWorkshop on well being over the life course agenda layard
Workshop on well being over the life course agenda layard
 
Osteoporosis 2016 | Factors influencing peak bone mass: Prof. Nick Harvey #os...
Osteoporosis 2016 | Factors influencing peak bone mass: Prof. Nick Harvey #os...Osteoporosis 2016 | Factors influencing peak bone mass: Prof. Nick Harvey #os...
Osteoporosis 2016 | Factors influencing peak bone mass: Prof. Nick Harvey #os...
 

BMI Measurements by Trinity/HOPE

  • 1. Trinity Hope BMI Measurement Data Central Plateau August 2007 to June 2008 Presented by Bunny Pozehl August 2008
  • 2.  
  • 3.
  • 4. Data Collection at Evangelical Lutheran School
  • 5. Data Collection at Bon Barger
  • 7.  
  • 8.
  • 9.
  • 10. Central Plateau Data 565 Children Numbers of Children per School
  • 11. Mean BMI by School * Mean differences statistically significant at p < .001 for every school
  • 12. Overall Mean BMI Before and After Feeding Program t (df = 564) = -17.8, p<.001
  • 14. Percentages Below 5 th Percentile BMI Before and After Feeding Program Males
  • 15. Percentages Below 5 th Percentile BMI Before and After Feeding Program Males Before After Difference 4 Years (n = 30) 46.7 13.3 33.4 5 Years (n = 20) 40.0 10.0 30.0 6 Years (n = 34) 58.8 52.9 5.9 7 Years (n = 27) 48.1 11.1 37.0 8 Years (n = 47) 31.9 14.9 17.0 9 Years (n = 20) 25.0 5.0 20.0 10 Years (n = 16) 31.3 12.5 18.8 11 Years (n = 20) 25.0 25.0 0.0 12 Years (n = 13) 15.4 23.1 -7.7 13 Years (n = 4) 50.0 25.0 25.0 14 Years (n = 2) 100.0 50.0 50.0 15 Years (n = 2) 100.0 100.0 0.0 16 Years (n = 3) 66.7 66.7 0.0 17 Years (n = 4) 75.0 75.0 0.0 18 Years (n = 3) 33.3 33.3 0.0
  • 16. Percentages Below 5 th Percentile BMI Before and After Feeding Program Females
  • 17. Percentages Below 5 th Percentile BMI Before and After Feeding Program Females Before After Difference 4 Years (n = 38) 39.5 5.3 34.2 5 Years (n = 37) 37.8 13.5 24.3 6 Years (n = 36) 50.0 30.6 19.4 7 Years (n = 33) 48.5 18.2 30.3 8 Years (n = 36) 27.8 16.7 11.1 9 Years (n = 30) 30.0 16.7 14.3 10 Years (n = 35) 22.9 8.6 16.3 11 Years (n = 20) 40.0 15.0 25.0 12 Years (n = 5) 40.0 40.0 0.0 13 Years (n = 8) 62.5 50.0 12.5 14 Years (n = 3) 100.0 66.7 33.3 15 Years (n = 2) 50.0 50.0 0.0 16 Years (n = 2) 50.0 50.0 0.0 17 Years (n = 2) 100.0 100.0 0.0 18 Years (n = 0) - - -
  • 18. Visible Differences Unfed School Fed School
  • 19. Visible Differences Unfed School Fed School
  • 20.