SlideShare une entreprise Scribd logo
1  sur  4
The state of Connecticut has given the citizens of Connecticut a very useful tool. A tool—it need be nothing more, nothing less, but a tool. How to use that tool and for what purpose is open to discussion and application. The Connecticut Mastery Test is an instrument we can use to judge the achievement of our students—their relative ranking to past years (across time) and relative ranking to other towns and cities (across districts) along with other uses including program evaluation. It is a scientifically derived instrument constructed by psychometricians (cognitive and affective domain measurement specialists). While it can be argued that it does not measure what is being taught in every town and city of Connecticut, it is aimed at measuring what the state department of education considers as the state standards for each grade level. These standards are well known to all Connecticut towns and communities and are what the state ranks as basic content areas to be taught and mastered (hopefully) for all of Connecticut’s students. The test used to be administered toward the beginning of the school year (2000-2004 and earlier), but is now administered in the early part of March (2006-2009 and 2010). It is statistically calibrated which means systematic errors have been minimized, items have been chosen that represent a theoretical construct (reading, math, writing aptitude, etc.) based on what the state thinks every student in Connecticut should have learned, and many other statistical and conceptual assumptions have been applied. It is considered by some to be a model for other states to emulate.<br />In essence, the test consists of several tests (reading, writing, math to name a few at the elementary level) which themselves consist of subtests (in 4th grade math, for example, there are 25 strands which assess separate math skills, reading and writing have multiple choice and short answer comprehension items, a Degrees of Reading Power section, a writing essay, and others).  The number of correct responses on the multiple choice sections and the ratings on the open ended and essay items are totaled as a raw score.  This raw score is then converted to a scale score to produce a true interval score which allows comparisons up and down the scale equally  (i.e. a score change from 290 to 295 has the same magnitude as a score change from 360 to 365).  The “scaling” here is arguably producing a norm-referenced type of measurement that “spreads” the examinees scores (from 100-400) and allows for relative placement (placement/ranking within the group). The scale scores are then used to place examinees in categories: for example, a 242 or above scale score might place a student in the “At or Above Goal” category for Reading. This is the mastery part of the test. Students are now said to have either mastered or not a content area. Now we are in the categorical or criterion-referenced type of measurement that tends to group examinees together in pass/fail or several subcategories.  For the mastery test at the elementary level, there are 5 groupings: Advanced, At or Above Goal, Proficient, Basic, and Below Basic. All test scores reflect some errors of measurement and are often reported as falling in a range that is estimated by error variances.  So a student’s true score is reported within a confidence internal that has a certain probability attached such as 95%.  Theoretically, it can be stated that if the student took this test 100 times, the true score would be in this range 95 out of 100 times. Those are the bars that are often charted on a student’s individual report. Because of errors of measurement, a student scoring at or near a cut score (the score that is the threshold of a category), could be a false positive or false negative for the reported category.  Hence, strong evidence is necessary for the individual’s observed score being representative of the true score with a cut-score interpretation.  When using a group mean score (a mean scale score), such as when comparing group means over time or across districts, less evidence is necessary and saying the observed scores generally represent the groups’ true mean scores may satisfy any and all requirements. <br />This brief attempt to help understand the Connecticut Mastery Test uses a bit of psychometric theory that barely scratches the surface. The amount of work, time, and effort to produce this test is great, including specialists in all content areas, statistical techniques, pilot studies, experts in mental measurement (psychometricians), state standards, years of experimental studies, item banking, and much, much more.  It is a tool, a gift really, given to us to let us see things we otherwise could not. <br />An example follows.<br />This chart shows trend lines for Branford (pink trend line), Connecticut state average (dark blue) and 7 randomly selected districts in the same District Reference Group (DRG) as Branford.  Percentages “At Goal or Above” are shown for the years 2006, 2007, 2008, and 2009.  The districts were randomly selected by assigning numbers to the 23 other districts in Branford’s DRG.  A random number generator was then used to select the sample thereby eliminating selection bias to allow a generalization of the results to the population DRG.  The results show Branford in 2006 at the upper limit of the sample far above Connecticut’s state average; then dropping over the next 3 years to approximately tie with the state average near the bottom limit for 2009.<br />ITS      Data used is available by following this link   http://www.branford.k12.ct.us/  and then choosing the second link from the bottom of the right-hand column’s list of links  (http://www.ctreports.com/)<br />
Useful tools with chart1

Contenu connexe

Tendances

Research tool.rating scale
Research tool.rating scaleResearch tool.rating scale
Research tool.rating scaleMukut Deori
 
Scales of Measurement
Scales of MeasurementScales of Measurement
Scales of Measurementloranel
 
Presentation on Rating scale
Presentation on Rating scalePresentation on Rating scale
Presentation on Rating scaleZubair Bhatti
 
Measurement and scaling
Measurement and scalingMeasurement and scaling
Measurement and scalingBalaji P
 
Practical Research 2 Chapter 3: Common Statistical Tools
 Practical Research 2 Chapter 3: Common Statistical Tools Practical Research 2 Chapter 3: Common Statistical Tools
Practical Research 2 Chapter 3: Common Statistical ToolsDaianMoreno1
 
Quantitative data 2
Quantitative data 2Quantitative data 2
Quantitative data 2Illi Elas
 
Concept of Measurements in Business Research
Concept of Measurements in Business ResearchConcept of Measurements in Business Research
Concept of Measurements in Business ResearchCS PRADHAN
 
Scaling in research methodology
Scaling in research methodologyScaling in research methodology
Scaling in research methodologyTukaram Gundoor
 
Scaling and Measurement techniques
Scaling and Measurement techniquesScaling and Measurement techniques
Scaling and Measurement techniquesJignesh Kariya
 
Business Research Methods. measurement questionnaire and sampling
Business Research Methods. measurement questionnaire and samplingBusiness Research Methods. measurement questionnaire and sampling
Business Research Methods. measurement questionnaire and samplingAhsan Khan Eco (Superior College)
 
Qualitative Research and Attitude Measurement
Qualitative Research and Attitude MeasurementQualitative Research and Attitude Measurement
Qualitative Research and Attitude MeasurementMAANZ International
 
Research methodology
Research methodologyResearch methodology
Research methodologyPretty Bansal
 

Tendances (20)

Research tool.rating scale
Research tool.rating scaleResearch tool.rating scale
Research tool.rating scale
 
Scales of Measurement
Scales of MeasurementScales of Measurement
Scales of Measurement
 
Presentation on Rating scale
Presentation on Rating scalePresentation on Rating scale
Presentation on Rating scale
 
Measurement and scaling
Measurement and scalingMeasurement and scaling
Measurement and scaling
 
Practical Research 2 Chapter 3: Common Statistical Tools
 Practical Research 2 Chapter 3: Common Statistical Tools Practical Research 2 Chapter 3: Common Statistical Tools
Practical Research 2 Chapter 3: Common Statistical Tools
 
Quantitative data 2
Quantitative data 2Quantitative data 2
Quantitative data 2
 
Attitude Scales
Attitude ScalesAttitude Scales
Attitude Scales
 
Concept of Measurements in Business Research
Concept of Measurements in Business ResearchConcept of Measurements in Business Research
Concept of Measurements in Business Research
 
Attitude scales
Attitude scalesAttitude scales
Attitude scales
 
Level Of Measurement
Level Of MeasurementLevel Of Measurement
Level Of Measurement
 
Scaling in research methodology
Scaling in research methodologyScaling in research methodology
Scaling in research methodology
 
Scaling and Measurement techniques
Scaling and Measurement techniquesScaling and Measurement techniques
Scaling and Measurement techniques
 
Business Research Methods. measurement questionnaire and sampling
Business Research Methods. measurement questionnaire and samplingBusiness Research Methods. measurement questionnaire and sampling
Business Research Methods. measurement questionnaire and sampling
 
Measurement
MeasurementMeasurement
Measurement
 
Research method
Research methodResearch method
Research method
 
Scaling
ScalingScaling
Scaling
 
Statistics and probability lesson 4
Statistics and probability lesson 4Statistics and probability lesson 4
Statistics and probability lesson 4
 
Scaling technique
Scaling techniqueScaling technique
Scaling technique
 
Qualitative Research and Attitude Measurement
Qualitative Research and Attitude MeasurementQualitative Research and Attitude Measurement
Qualitative Research and Attitude Measurement
 
Research methodology
Research methodologyResearch methodology
Research methodology
 

En vedette

3rd Grade C M T D R G D Rank 2006 2009
3rd  Grade  C M T  D R G  D  Rank 2006 20093rd  Grade  C M T  D R G  D  Rank 2006 2009
3rd Grade C M T D R G D Rank 2006 2009Thomas Salvin
 
Branford Connecticut CMTs CAPT 2006-2012 results District Reference Group Ran...
Branford Connecticut CMTs CAPT 2006-2012 results District Reference Group Ran...Branford Connecticut CMTs CAPT 2006-2012 results District Reference Group Ran...
Branford Connecticut CMTs CAPT 2006-2012 results District Reference Group Ran...Thomas Salvin
 
B02042010 Pfd Srg Btate25 Dinal
B02042010 Pfd Srg Btate25 DinalB02042010 Pfd Srg Btate25 Dinal
B02042010 Pfd Srg Btate25 DinalThomas Salvin
 
Branford’s Economically Disadvantaged Achievement Gap by Grade Levels 2006 2011
Branford’s Economically Disadvantaged Achievement Gap by Grade Levels 2006 2011Branford’s Economically Disadvantaged Achievement Gap by Grade Levels 2006 2011
Branford’s Economically Disadvantaged Achievement Gap by Grade Levels 2006 2011Thomas Salvin
 
Branford’s CTMasteryTest CAPT scores 2006-2011 w/Ranks
Branford’s CTMasteryTest CAPT scores 2006-2011 w/RanksBranford’s CTMasteryTest CAPT scores 2006-2011 w/Ranks
Branford’s CTMasteryTest CAPT scores 2006-2011 w/RanksThomas Salvin
 
Branford’s 10th grade capt drg d ranks 2007 2010
Branford’s 10th grade capt drg d ranks 2007 2010Branford’s 10th grade capt drg d ranks 2007 2010
Branford’s 10th grade capt drg d ranks 2007 2010Thomas Salvin
 
Branford 3rd 8th Grades Comparisons To Drg D
Branford 3rd 8th Grades Comparisons To Drg DBranford 3rd 8th Grades Comparisons To Drg D
Branford 3rd 8th Grades Comparisons To Drg DThomas Salvin
 
CAPT 2007-2010 Branford Public Schools
CAPT 2007-2010 Branford Public SchoolsCAPT 2007-2010 Branford Public Schools
CAPT 2007-2010 Branford Public SchoolsThomas Salvin
 
Branford’s 2011 CAPT, 8th-Grade, and 4th-Grade Comparisons
Branford’s 2011 CAPT, 8th-Grade, and 4th-Grade ComparisonsBranford’s 2011 CAPT, 8th-Grade, and 4th-Grade Comparisons
Branford’s 2011 CAPT, 8th-Grade, and 4th-Grade ComparisonsThomas Salvin
 
Branford's Achievement Gap: A Concern?
Branford's Achievement Gap: A Concern?Branford's Achievement Gap: A Concern?
Branford's Achievement Gap: A Concern?Thomas Salvin
 
Branford Elementary Schools 20062009
Branford  Elementary Schools 20062009Branford  Elementary Schools 20062009
Branford Elementary Schools 20062009Thomas Salvin
 

En vedette (11)

3rd Grade C M T D R G D Rank 2006 2009
3rd  Grade  C M T  D R G  D  Rank 2006 20093rd  Grade  C M T  D R G  D  Rank 2006 2009
3rd Grade C M T D R G D Rank 2006 2009
 
Branford Connecticut CMTs CAPT 2006-2012 results District Reference Group Ran...
Branford Connecticut CMTs CAPT 2006-2012 results District Reference Group Ran...Branford Connecticut CMTs CAPT 2006-2012 results District Reference Group Ran...
Branford Connecticut CMTs CAPT 2006-2012 results District Reference Group Ran...
 
B02042010 Pfd Srg Btate25 Dinal
B02042010 Pfd Srg Btate25 DinalB02042010 Pfd Srg Btate25 Dinal
B02042010 Pfd Srg Btate25 Dinal
 
Branford’s Economically Disadvantaged Achievement Gap by Grade Levels 2006 2011
Branford’s Economically Disadvantaged Achievement Gap by Grade Levels 2006 2011Branford’s Economically Disadvantaged Achievement Gap by Grade Levels 2006 2011
Branford’s Economically Disadvantaged Achievement Gap by Grade Levels 2006 2011
 
Branford’s CTMasteryTest CAPT scores 2006-2011 w/Ranks
Branford’s CTMasteryTest CAPT scores 2006-2011 w/RanksBranford’s CTMasteryTest CAPT scores 2006-2011 w/Ranks
Branford’s CTMasteryTest CAPT scores 2006-2011 w/Ranks
 
Branford’s 10th grade capt drg d ranks 2007 2010
Branford’s 10th grade capt drg d ranks 2007 2010Branford’s 10th grade capt drg d ranks 2007 2010
Branford’s 10th grade capt drg d ranks 2007 2010
 
Branford 3rd 8th Grades Comparisons To Drg D
Branford 3rd 8th Grades Comparisons To Drg DBranford 3rd 8th Grades Comparisons To Drg D
Branford 3rd 8th Grades Comparisons To Drg D
 
CAPT 2007-2010 Branford Public Schools
CAPT 2007-2010 Branford Public SchoolsCAPT 2007-2010 Branford Public Schools
CAPT 2007-2010 Branford Public Schools
 
Branford’s 2011 CAPT, 8th-Grade, and 4th-Grade Comparisons
Branford’s 2011 CAPT, 8th-Grade, and 4th-Grade ComparisonsBranford’s 2011 CAPT, 8th-Grade, and 4th-Grade Comparisons
Branford’s 2011 CAPT, 8th-Grade, and 4th-Grade Comparisons
 
Branford's Achievement Gap: A Concern?
Branford's Achievement Gap: A Concern?Branford's Achievement Gap: A Concern?
Branford's Achievement Gap: A Concern?
 
Branford Elementary Schools 20062009
Branford  Elementary Schools 20062009Branford  Elementary Schools 20062009
Branford Elementary Schools 20062009
 

Similaire à Useful tools with chart1

Assignment 2 RA Annotated BibliographyIn your final paper for .docx
Assignment 2 RA Annotated BibliographyIn your final paper for .docxAssignment 2 RA Annotated BibliographyIn your final paper for .docx
Assignment 2 RA Annotated BibliographyIn your final paper for .docxjosephinepaterson7611
 
Scaling in research
Scaling  in researchScaling  in research
Scaling in researchankitsengar
 
Executive Program Practical Connection Assignment - 100 poin
Executive Program Practical Connection Assignment - 100 poinExecutive Program Practical Connection Assignment - 100 poin
Executive Program Practical Connection Assignment - 100 poinBetseyCalderon89
 
Chotu scaling techniques
Chotu scaling techniquesChotu scaling techniques
Chotu scaling techniquesPruseth Abhisek
 
Measurement and scaling techniques
Measurement and scaling techniquesMeasurement and scaling techniques
Measurement and scaling techniquesKritika Jain
 
Measurement and scaling techniques
Measurement  and  scaling  techniquesMeasurement  and  scaling  techniques
Measurement and scaling techniquesUjjwal 'Shanu'
 
Measurement and scaling techniques
Measurement and scaling techniquesMeasurement and scaling techniques
Measurement and scaling techniquesSarfaraz Ahmad
 
Web 2.0 assessment presentation
Web 2.0 assessment presentation Web 2.0 assessment presentation
Web 2.0 assessment presentation heatherkmiles
 
Web 2.0 assessment presentation
Web 2.0 assessment presentation Web 2.0 assessment presentation
Web 2.0 assessment presentation Eric Miles
 
Statistical ProcessesCan descriptive statistical processes b.docx
Statistical ProcessesCan descriptive statistical processes b.docxStatistical ProcessesCan descriptive statistical processes b.docx
Statistical ProcessesCan descriptive statistical processes b.docxdarwinming1
 
Lu2 introduction to statistics
Lu2 introduction to statisticsLu2 introduction to statistics
Lu2 introduction to statisticsLamineKaba6
 
Computing Descriptive Statistics © 2014 Argos.docx
 Computing Descriptive Statistics     © 2014 Argos.docx Computing Descriptive Statistics     © 2014 Argos.docx
Computing Descriptive Statistics © 2014 Argos.docxaryan532920
 
Computing Descriptive Statistics © 2014 Argos.docx
Computing Descriptive Statistics     © 2014 Argos.docxComputing Descriptive Statistics     © 2014 Argos.docx
Computing Descriptive Statistics © 2014 Argos.docxAASTHA76
 
T4 measurement and scaling
T4 measurement and scalingT4 measurement and scaling
T4 measurement and scalingkompellark
 
Rits Brown Bag - Surveys and Polls Techniques
Rits Brown Bag - Surveys and Polls TechniquesRits Brown Bag - Surveys and Polls Techniques
Rits Brown Bag - Surveys and Polls TechniquesRight IT Services
 
PAD 503 Module 1 Slides.pptx
PAD 503 Module 1 Slides.pptxPAD 503 Module 1 Slides.pptx
PAD 503 Module 1 Slides.pptxNathanielWright9
 
Data AnalysisResearch Report AssessmentBSB
Data AnalysisResearch Report AssessmentBSBData AnalysisResearch Report AssessmentBSB
Data AnalysisResearch Report AssessmentBSBOllieShoresna
 

Similaire à Useful tools with chart1 (20)

Assignment 2 RA Annotated BibliographyIn your final paper for .docx
Assignment 2 RA Annotated BibliographyIn your final paper for .docxAssignment 2 RA Annotated BibliographyIn your final paper for .docx
Assignment 2 RA Annotated BibliographyIn your final paper for .docx
 
Scaling in research
Scaling  in researchScaling  in research
Scaling in research
 
Executive Program Practical Connection Assignment - 100 poin
Executive Program Practical Connection Assignment - 100 poinExecutive Program Practical Connection Assignment - 100 poin
Executive Program Practical Connection Assignment - 100 poin
 
Chotu scaling techniques
Chotu scaling techniquesChotu scaling techniques
Chotu scaling techniques
 
Measurement and scaling techniques
Measurement and scaling techniquesMeasurement and scaling techniques
Measurement and scaling techniques
 
Measurement and scaling techniques
Measurement  and  scaling  techniquesMeasurement  and  scaling  techniques
Measurement and scaling techniques
 
Measurement and scaling techniques
Measurement and scaling techniquesMeasurement and scaling techniques
Measurement and scaling techniques
 
ch 13.pptx
ch 13.pptxch 13.pptx
ch 13.pptx
 
Web 2.0 assessment presentation
Web 2.0 assessment presentation Web 2.0 assessment presentation
Web 2.0 assessment presentation
 
Web 2.0 assessment presentation
Web 2.0 assessment presentation Web 2.0 assessment presentation
Web 2.0 assessment presentation
 
Statistical ProcessesCan descriptive statistical processes b.docx
Statistical ProcessesCan descriptive statistical processes b.docxStatistical ProcessesCan descriptive statistical processes b.docx
Statistical ProcessesCan descriptive statistical processes b.docx
 
Norms[1]
Norms[1]Norms[1]
Norms[1]
 
Lu2 introduction to statistics
Lu2 introduction to statisticsLu2 introduction to statistics
Lu2 introduction to statistics
 
Computing Descriptive Statistics © 2014 Argos.docx
 Computing Descriptive Statistics     © 2014 Argos.docx Computing Descriptive Statistics     © 2014 Argos.docx
Computing Descriptive Statistics © 2014 Argos.docx
 
Computing Descriptive Statistics © 2014 Argos.docx
Computing Descriptive Statistics     © 2014 Argos.docxComputing Descriptive Statistics     © 2014 Argos.docx
Computing Descriptive Statistics © 2014 Argos.docx
 
T4 measurement and scaling
T4 measurement and scalingT4 measurement and scaling
T4 measurement and scaling
 
Rits Brown Bag - Surveys and Polls Techniques
Rits Brown Bag - Surveys and Polls TechniquesRits Brown Bag - Surveys and Polls Techniques
Rits Brown Bag - Surveys and Polls Techniques
 
PAD 503 Module 1 Slides.pptx
PAD 503 Module 1 Slides.pptxPAD 503 Module 1 Slides.pptx
PAD 503 Module 1 Slides.pptx
 
Quantitative research
Quantitative researchQuantitative research
Quantitative research
 
Data AnalysisResearch Report AssessmentBSB
Data AnalysisResearch Report AssessmentBSBData AnalysisResearch Report AssessmentBSB
Data AnalysisResearch Report AssessmentBSB
 

Dernier

CARE OF CHILD IN INCUBATOR..........pptx
CARE OF CHILD IN INCUBATOR..........pptxCARE OF CHILD IN INCUBATOR..........pptx
CARE OF CHILD IN INCUBATOR..........pptxGaneshChakor2
 
mini mental status format.docx
mini    mental       status     format.docxmini    mental       status     format.docx
mini mental status format.docxPoojaSen20
 
Organic Name Reactions for the students and aspirants of Chemistry12th.pptx
Organic Name Reactions  for the students and aspirants of Chemistry12th.pptxOrganic Name Reactions  for the students and aspirants of Chemistry12th.pptx
Organic Name Reactions for the students and aspirants of Chemistry12th.pptxVS Mahajan Coaching Centre
 
A Critique of the Proposed National Education Policy Reform
A Critique of the Proposed National Education Policy ReformA Critique of the Proposed National Education Policy Reform
A Critique of the Proposed National Education Policy ReformChameera Dedduwage
 
_Math 4-Q4 Week 5.pptx Steps in Collecting Data
_Math 4-Q4 Week 5.pptx Steps in Collecting Data_Math 4-Q4 Week 5.pptx Steps in Collecting Data
_Math 4-Q4 Week 5.pptx Steps in Collecting DataJhengPantaleon
 
The basics of sentences session 2pptx copy.pptx
The basics of sentences session 2pptx copy.pptxThe basics of sentences session 2pptx copy.pptx
The basics of sentences session 2pptx copy.pptxheathfieldcps1
 
Software Engineering Methodologies (overview)
Software Engineering Methodologies (overview)Software Engineering Methodologies (overview)
Software Engineering Methodologies (overview)eniolaolutunde
 
POINT- BIOCHEMISTRY SEM 2 ENZYMES UNIT 5.pptx
POINT- BIOCHEMISTRY SEM 2 ENZYMES UNIT 5.pptxPOINT- BIOCHEMISTRY SEM 2 ENZYMES UNIT 5.pptx
POINT- BIOCHEMISTRY SEM 2 ENZYMES UNIT 5.pptxSayali Powar
 
Call Girls in Dwarka Mor Delhi Contact Us 9654467111
Call Girls in Dwarka Mor Delhi Contact Us 9654467111Call Girls in Dwarka Mor Delhi Contact Us 9654467111
Call Girls in Dwarka Mor Delhi Contact Us 9654467111Sapana Sha
 
Hybridoma Technology ( Production , Purification , and Application )
Hybridoma Technology  ( Production , Purification , and Application  ) Hybridoma Technology  ( Production , Purification , and Application  )
Hybridoma Technology ( Production , Purification , and Application ) Sakshi Ghasle
 
microwave assisted reaction. General introduction
microwave assisted reaction. General introductionmicrowave assisted reaction. General introduction
microwave assisted reaction. General introductionMaksud Ahmed
 
MENTAL STATUS EXAMINATION format.docx
MENTAL     STATUS EXAMINATION format.docxMENTAL     STATUS EXAMINATION format.docx
MENTAL STATUS EXAMINATION format.docxPoojaSen20
 
Contemporary philippine arts from the regions_PPT_Module_12 [Autosaved] (1).pptx
Contemporary philippine arts from the regions_PPT_Module_12 [Autosaved] (1).pptxContemporary philippine arts from the regions_PPT_Module_12 [Autosaved] (1).pptx
Contemporary philippine arts from the regions_PPT_Module_12 [Autosaved] (1).pptxRoyAbrique
 
Measures of Central Tendency: Mean, Median and Mode
Measures of Central Tendency: Mean, Median and ModeMeasures of Central Tendency: Mean, Median and Mode
Measures of Central Tendency: Mean, Median and ModeThiyagu K
 
Mastering the Unannounced Regulatory Inspection
Mastering the Unannounced Regulatory InspectionMastering the Unannounced Regulatory Inspection
Mastering the Unannounced Regulatory InspectionSafetyChain Software
 
Introduction to ArtificiaI Intelligence in Higher Education
Introduction to ArtificiaI Intelligence in Higher EducationIntroduction to ArtificiaI Intelligence in Higher Education
Introduction to ArtificiaI Intelligence in Higher Educationpboyjonauth
 
SOCIAL AND HISTORICAL CONTEXT - LFTVD.pptx
SOCIAL AND HISTORICAL CONTEXT - LFTVD.pptxSOCIAL AND HISTORICAL CONTEXT - LFTVD.pptx
SOCIAL AND HISTORICAL CONTEXT - LFTVD.pptxiammrhaywood
 
APM Welcome, APM North West Network Conference, Synergies Across Sectors
APM Welcome, APM North West Network Conference, Synergies Across SectorsAPM Welcome, APM North West Network Conference, Synergies Across Sectors
APM Welcome, APM North West Network Conference, Synergies Across SectorsAssociation for Project Management
 

Dernier (20)

CARE OF CHILD IN INCUBATOR..........pptx
CARE OF CHILD IN INCUBATOR..........pptxCARE OF CHILD IN INCUBATOR..........pptx
CARE OF CHILD IN INCUBATOR..........pptx
 
mini mental status format.docx
mini    mental       status     format.docxmini    mental       status     format.docx
mini mental status format.docx
 
Organic Name Reactions for the students and aspirants of Chemistry12th.pptx
Organic Name Reactions  for the students and aspirants of Chemistry12th.pptxOrganic Name Reactions  for the students and aspirants of Chemistry12th.pptx
Organic Name Reactions for the students and aspirants of Chemistry12th.pptx
 
A Critique of the Proposed National Education Policy Reform
A Critique of the Proposed National Education Policy ReformA Critique of the Proposed National Education Policy Reform
A Critique of the Proposed National Education Policy Reform
 
_Math 4-Q4 Week 5.pptx Steps in Collecting Data
_Math 4-Q4 Week 5.pptx Steps in Collecting Data_Math 4-Q4 Week 5.pptx Steps in Collecting Data
_Math 4-Q4 Week 5.pptx Steps in Collecting Data
 
The basics of sentences session 2pptx copy.pptx
The basics of sentences session 2pptx copy.pptxThe basics of sentences session 2pptx copy.pptx
The basics of sentences session 2pptx copy.pptx
 
Software Engineering Methodologies (overview)
Software Engineering Methodologies (overview)Software Engineering Methodologies (overview)
Software Engineering Methodologies (overview)
 
POINT- BIOCHEMISTRY SEM 2 ENZYMES UNIT 5.pptx
POINT- BIOCHEMISTRY SEM 2 ENZYMES UNIT 5.pptxPOINT- BIOCHEMISTRY SEM 2 ENZYMES UNIT 5.pptx
POINT- BIOCHEMISTRY SEM 2 ENZYMES UNIT 5.pptx
 
Staff of Color (SOC) Retention Efforts DDSD
Staff of Color (SOC) Retention Efforts DDSDStaff of Color (SOC) Retention Efforts DDSD
Staff of Color (SOC) Retention Efforts DDSD
 
Call Girls in Dwarka Mor Delhi Contact Us 9654467111
Call Girls in Dwarka Mor Delhi Contact Us 9654467111Call Girls in Dwarka Mor Delhi Contact Us 9654467111
Call Girls in Dwarka Mor Delhi Contact Us 9654467111
 
Hybridoma Technology ( Production , Purification , and Application )
Hybridoma Technology  ( Production , Purification , and Application  ) Hybridoma Technology  ( Production , Purification , and Application  )
Hybridoma Technology ( Production , Purification , and Application )
 
Model Call Girl in Bikash Puri Delhi reach out to us at 🔝9953056974🔝
Model Call Girl in Bikash Puri  Delhi reach out to us at 🔝9953056974🔝Model Call Girl in Bikash Puri  Delhi reach out to us at 🔝9953056974🔝
Model Call Girl in Bikash Puri Delhi reach out to us at 🔝9953056974🔝
 
microwave assisted reaction. General introduction
microwave assisted reaction. General introductionmicrowave assisted reaction. General introduction
microwave assisted reaction. General introduction
 
MENTAL STATUS EXAMINATION format.docx
MENTAL     STATUS EXAMINATION format.docxMENTAL     STATUS EXAMINATION format.docx
MENTAL STATUS EXAMINATION format.docx
 
Contemporary philippine arts from the regions_PPT_Module_12 [Autosaved] (1).pptx
Contemporary philippine arts from the regions_PPT_Module_12 [Autosaved] (1).pptxContemporary philippine arts from the regions_PPT_Module_12 [Autosaved] (1).pptx
Contemporary philippine arts from the regions_PPT_Module_12 [Autosaved] (1).pptx
 
Measures of Central Tendency: Mean, Median and Mode
Measures of Central Tendency: Mean, Median and ModeMeasures of Central Tendency: Mean, Median and Mode
Measures of Central Tendency: Mean, Median and Mode
 
Mastering the Unannounced Regulatory Inspection
Mastering the Unannounced Regulatory InspectionMastering the Unannounced Regulatory Inspection
Mastering the Unannounced Regulatory Inspection
 
Introduction to ArtificiaI Intelligence in Higher Education
Introduction to ArtificiaI Intelligence in Higher EducationIntroduction to ArtificiaI Intelligence in Higher Education
Introduction to ArtificiaI Intelligence in Higher Education
 
SOCIAL AND HISTORICAL CONTEXT - LFTVD.pptx
SOCIAL AND HISTORICAL CONTEXT - LFTVD.pptxSOCIAL AND HISTORICAL CONTEXT - LFTVD.pptx
SOCIAL AND HISTORICAL CONTEXT - LFTVD.pptx
 
APM Welcome, APM North West Network Conference, Synergies Across Sectors
APM Welcome, APM North West Network Conference, Synergies Across SectorsAPM Welcome, APM North West Network Conference, Synergies Across Sectors
APM Welcome, APM North West Network Conference, Synergies Across Sectors
 

Useful tools with chart1

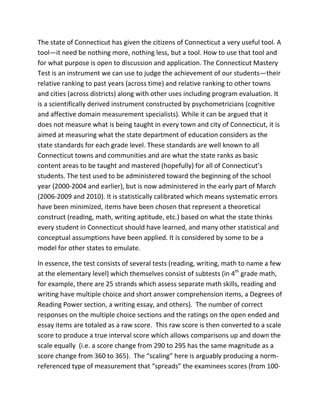
  • 1. The state of Connecticut has given the citizens of Connecticut a very useful tool. A tool—it need be nothing more, nothing less, but a tool. How to use that tool and for what purpose is open to discussion and application. The Connecticut Mastery Test is an instrument we can use to judge the achievement of our students—their relative ranking to past years (across time) and relative ranking to other towns and cities (across districts) along with other uses including program evaluation. It is a scientifically derived instrument constructed by psychometricians (cognitive and affective domain measurement specialists). While it can be argued that it does not measure what is being taught in every town and city of Connecticut, it is aimed at measuring what the state department of education considers as the state standards for each grade level. These standards are well known to all Connecticut towns and communities and are what the state ranks as basic content areas to be taught and mastered (hopefully) for all of Connecticut’s students. The test used to be administered toward the beginning of the school year (2000-2004 and earlier), but is now administered in the early part of March (2006-2009 and 2010). It is statistically calibrated which means systematic errors have been minimized, items have been chosen that represent a theoretical construct (reading, math, writing aptitude, etc.) based on what the state thinks every student in Connecticut should have learned, and many other statistical and conceptual assumptions have been applied. It is considered by some to be a model for other states to emulate.<br />In essence, the test consists of several tests (reading, writing, math to name a few at the elementary level) which themselves consist of subtests (in 4th grade math, for example, there are 25 strands which assess separate math skills, reading and writing have multiple choice and short answer comprehension items, a Degrees of Reading Power section, a writing essay, and others). The number of correct responses on the multiple choice sections and the ratings on the open ended and essay items are totaled as a raw score. This raw score is then converted to a scale score to produce a true interval score which allows comparisons up and down the scale equally (i.e. a score change from 290 to 295 has the same magnitude as a score change from 360 to 365). The “scaling” here is arguably producing a norm-referenced type of measurement that “spreads” the examinees scores (from 100-400) and allows for relative placement (placement/ranking within the group). The scale scores are then used to place examinees in categories: for example, a 242 or above scale score might place a student in the “At or Above Goal” category for Reading. This is the mastery part of the test. Students are now said to have either mastered or not a content area. Now we are in the categorical or criterion-referenced type of measurement that tends to group examinees together in pass/fail or several subcategories. For the mastery test at the elementary level, there are 5 groupings: Advanced, At or Above Goal, Proficient, Basic, and Below Basic. All test scores reflect some errors of measurement and are often reported as falling in a range that is estimated by error variances. So a student’s true score is reported within a confidence internal that has a certain probability attached such as 95%. Theoretically, it can be stated that if the student took this test 100 times, the true score would be in this range 95 out of 100 times. Those are the bars that are often charted on a student’s individual report. Because of errors of measurement, a student scoring at or near a cut score (the score that is the threshold of a category), could be a false positive or false negative for the reported category. Hence, strong evidence is necessary for the individual’s observed score being representative of the true score with a cut-score interpretation. When using a group mean score (a mean scale score), such as when comparing group means over time or across districts, less evidence is necessary and saying the observed scores generally represent the groups’ true mean scores may satisfy any and all requirements. <br />This brief attempt to help understand the Connecticut Mastery Test uses a bit of psychometric theory that barely scratches the surface. The amount of work, time, and effort to produce this test is great, including specialists in all content areas, statistical techniques, pilot studies, experts in mental measurement (psychometricians), state standards, years of experimental studies, item banking, and much, much more. It is a tool, a gift really, given to us to let us see things we otherwise could not. <br />An example follows.<br />This chart shows trend lines for Branford (pink trend line), Connecticut state average (dark blue) and 7 randomly selected districts in the same District Reference Group (DRG) as Branford. Percentages “At Goal or Above” are shown for the years 2006, 2007, 2008, and 2009. The districts were randomly selected by assigning numbers to the 23 other districts in Branford’s DRG. A random number generator was then used to select the sample thereby eliminating selection bias to allow a generalization of the results to the population DRG. The results show Branford in 2006 at the upper limit of the sample far above Connecticut’s state average; then dropping over the next 3 years to approximately tie with the state average near the bottom limit for 2009.<br />ITS Data used is available by following this link http://www.branford.k12.ct.us/ and then choosing the second link from the bottom of the right-hand column’s list of links (http://www.ctreports.com/)<br />