Витрати домогосподарств Європи на оплату житлово-комунальних послуг
•
0 j'aime•16,083 vues

Витрати домогосподарств Європи на оплату житлово-комунальних послуг

Recommandé
Recommandé
Contenu connexe
Tendances
Tendances (15)
En vedette
En vedette (17)
Similaire à Витрати домогосподарств Європи на оплату житлово-комунальних послуг
Similaire à Витрати домогосподарств Європи на оплату житлово-комунальних послуг (20)
Plus de tsnua
Plus de tsnua (20)
Dernier
Dernier (20)
Витрати домогосподарств Європи на оплату житлово-комунальних послуг
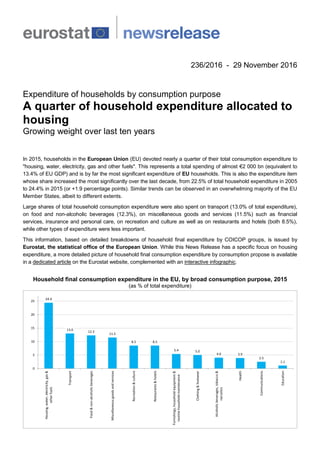
- 1. 236/2016 - 29 November 2016 Expenditure of households by consumption purpose A quarter of household expenditure allocated to housing Growing weight over last ten years In 2015, households in the European Union (EU) devoted nearly a quarter of their total consumption expenditure to "housing, water, electricity, gas and other fuels". This represents a total spending of almost €2 000 bn (equivalent to 13.4% of EU GDP) and is by far the most significant expenditure of EU households. This is also the expenditure item whose share increased the most significantly over the last decade, from 22.5% of total household expenditure in 2005 to 24.4% in 2015 (or +1.9 percentage points). Similar trends can be observed in an overwhelming majority of the EU Member States, albeit to different extents. Large shares of total household consumption expenditure were also spent on transport (13.0% of total expenditure), on food and non-alcoholic beverages (12.3%), on miscellaneous goods and services (11.5%) such as financial services, insurance and personal care, on recreation and culture as well as on restaurants and hotels (both 8.5%), while other types of expenditure were less important. This information, based on detailed breakdowns of household final expenditure by COICOP groups, is issued by Eurostat, the statistical office of the European Union. While this News Release has a specific focus on housing expenditure, a more detailed picture of household final consumption expenditure by consumption propose is available in a dedicated article on the Eurostat website, complemented with an interactive infographic. Household final consumption expenditure in the EU, by broad consumption purpose, 2015 (as % of total expenditure) 24.4 13.0 12.3 11.5 8.5 8.5 5.4 5.0 4.0 3.9 2.5 1.1 0 5 10 15 20 25 Housing,water,electricity,gas& otherfuels Transport Food&non-alcoholicbeverages Miscellaneousgoodsandservices Recreation&culture Restaurants&hotels Furnishings,householdequipment& routinehouseholdmaintenance Clothing&footwear Alcoholicbeverages,tobacco& narcotics Health Communications Education
- 2. Weight of household expenditure on housing highest in Denmark and Finland, lowest in Malta In a large majority of EU Member States, "housing, water, electricity, gas and other fuels" represents the first item of household expenditure. In 2015, households devoted the largest share of their total expenditure to housing in Denmark (29.4%) and Finland (28.2%), followed by France (26.4%), Sweden (26.0%), the Czech Republic (25.9%) and the United Kingdom (25.6%). At the opposite end of the scale, the lowest proportion of household expenditure spent on housing was registered by far in Malta (10.1%), ahead of Lithuania (15.8%), Cyprus (16.6%), Estonia (18.0%), Bulgaria (in 2014), Portugal and Slovenia (all 18.8%) as well as Hungary (19.1%). Share of housing, water, electricity, gas and other fuels in total household expenditure in the EU Member States, 2015 (%) 0 5 10 15 20 25 30 * 2014 data instead of 2015 Croatia: data not available Share of housing expenditure increased the most in Spain, Ireland and Portugal Between 2005 and 2015, the share of "housing water, electricity, gas and other fuels" in total household expenditure grew in a vast majority of Member States. In particular, the most remarkable increases over this 10- year time period were recorded in Spain (from 17.4% of total household expenditure in 2005 to 23.0% in 2015, or a rise by 5.6 percentage points – pp), Ireland (+5.0 pp) and Portugal (+4.5 pp), followed by the Netherlands (+3.8 pp), Finland (+3.6 pp), Italy and Latvia (both +3.3 pp) as well as Denmark (+3.1 pp). In contrast, the share of "housing water, electricity, gas and other fuels" in total household expenditure slightly dropped between 2005 and 2015 in Slovakia (from 26.2% in 2005 to 24.9% in 2015, or a decrease by 1.3 pp), Sweden (-1.0 pp), Malta (-0.9 pp), Poland (-0.7 pp), Germany (-0.4 pp) and Slovenia (-0.1 pp), while it remained stable in Estonia.
- 3. Household expenditure for housing, water, electricity, gas and other fuels In million euros (at current prices) Share in total expenditure (%) Change 2015/2005 (in pp) 2015 2005 2015 EU 1 965 275 22.5 24.4 +1.9 Euro area 1 354 718 21.8 24.1 +2.3 Belgium 48 800 23.5 24.4 +0.9 Bulgaria* 5 423 18.1 18.8 +0.7 Czech Republic 20 809 24.4 25.9 +1.5 Denmark 36 639 26.3 29.4 +3.1 Germany 368 297 24.4 24.0 -0.4 Estonia 1 936 18.0 18.0 0.0 Ireland 20 647 19.6 24.6 +5.0 Greece 26 779 17.9 20.6 +2.7 Spain 147 519 17.4 23.0 +5.6 France 306 894 24.1 26.4 +2.3 Croatia : : : : Italy 240 134 20.5 23.8 +3.3 Cyprus 2 241 14.2 16.6 +2.4 Latvia 3 274 18.7 22.0 +3.3 Lithuania 3 735 14.8 15.8 +1.0 Luxembourg 4 202 21.6 23.6 +2.0 Hungary 10 569 18.4 19.1 +0.7 Malta 556 11.0 10.1 -0.9 Netherlands 70 390 20.0 23.8 +3.8 Austria 41 025 21.0 22.7 +1.7 Poland 53 798 22.2 21.5 -0.7 Portugal 22 871 14.3 18.8 +4.5 Romania 20 901 20.9 21.5 +0.6 Slovenia 4 036 18.9 18.8 -0.1 Slovakia 10 557 26.2 24.9 -1.3 Finland 30 824 24.6 28.2 +3.6 Sweden 50 652 27.0 26.0 -1.0 United Kingdom 405 449 24.4 25.6 +1.2 Iceland 1 713 20.0 22.0 +2.0 Norway* 30 059 20.4 20.6 +0.2 : Data not available * 2014 data instead of 2015 The source dataset can be found here.
- 4. Geographical information The European Union (EU) includes Belgium, Bulgaria, the Czech Republic, Denmark, Germany, Estonia, Ireland, Greece, Spain, France, Croatia, Italy, Cyprus, Latvia, Lithuania, Luxembourg, Hungary, Malta, the Netherlands, Austria, Poland, Portugal, Romania, Slovenia, Slovakia, Finland, Sweden and the United Kingdom. The euro area consists of Belgium, Germany, Estonia, Ireland, Greece, Spain, France, Italy, Cyprus, Latvia, Lithuania, Luxembourg, Malta, the Netherlands, Austria, Portugal, Slovenia, Slovakia and Finland. Methods and definitions Data presented in this News Release come from annual national accounts, which are compiled in accordance with the European System of Accounts (ESA 2010). Household final consumption expenditure, abbreviated as HFCE, consists of the total outlay on individual goods and services by resident households, including those sold at below-market prices. HCFE includes imputed expenditures or transactions which do not occur in monetary terms and can therefore not be measured directly. Household consumption expenditure is classified by consumption purpose according to the COICOP classification (Classification Of Individual COnsumption by Purpose) which includes up to 60 categories. Data reflect the domestic concept. The division "Housing, water, electricity, gas and other fuels" includes expenditure related to rentals for housing, maintenance and repair of the dwelling, water supply and miscellaneous services relating to the dwelling, as well as electricity, gas and other fuels. For more information Eurostat website section dedicated to national accounts. Eurostat database on national accounts. Eurostat Statistic Explained article on household expenditure by consumption purpose. Eurostat interactive infographic on household consumption expenditure in the EU. Issued by: Eurostat Press Office Vincent BOURGEAIS Tel: +352-4301-33 444 eurostat-pressoffice@ec.europa.eu ec.europa.eu/eurostat/ @EU_Eurostat Production of data: Magdalena SAIGNE Tel: +352-4301-38 137 Christine GERSTBERGER Tel: +352-4301-30 175 estat-gdp-query@ec.europa.eu Media requests: Eurostat media support / Tel: +352-4301-33 408 / eurostat-mediasupport@ec.europa.eu