2. Boston Matrix
• The Boston Consulting Group developed
this as a tool of portfolio analysis
• It can be applied to the portfolio of
products produced by a firm or the
portfolio of businesses owned by a firm
• Portfolio is the collection of businesses or
products that make up a business
3. Essence of the Boston Matrix
• Firms should analyse the portfolio or collection
of products
• Products are categorised as:
– Question marks (also known as problem children)
– Stars
– Cash cows
– Dogs
• The ideal is a balanced portfolio with some
products in each category
5. Comparison with the Product Life Cycle
• The product life cycle
– Is concerned with individual products
– Is concerned with sales over time
• The Boston Matrix
– Is concerned with the firm’s portfolio of products
– Focuses on cash flow from products
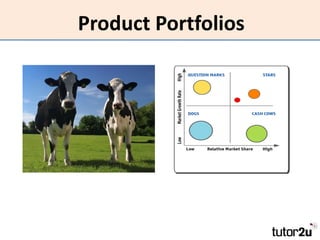
6. The axes of the matrix
• Relative market share
– This is expressed not as a % but
share in relation to other firms in
the market
– A measure of the firm’s/product’s
strength in the market
• Market growth
– % rate of growth of sales in the
market
– Measure of market attractiveness
– From this we derive four cells as a
means of analysing products
7. “Question mark” product
• Low share of a rapidly growing market
• Cash flow is negative
• Have potential but the future is uncertain
• Could become either a star or a dog
8. Strategy for “question marks”
• Invest to increase market share
• Substantial investment to achieve growth
at the expense of powerful competitors
• Invest in promotion and other aspects of
marketing
• Build selectively
9. Stars
• High share of a rapidly growing market
• Position of leadership in a high growth
market
• The product/business is relatively strong
and the market is growing
• Require high marketing spending
• Net cash inflow is neutral or at best
modestly positive
10. Strategy for stars
• Investment to sustain growth
• Build sales and/or market share
• Spend to keep competitors at bay
• Invest to maintain or increase leadership
position
• Repel challenges from competitors
11. Cash cows
• High share of a slowly growing market
• Mature stage in the product life cycle
• Mature, successful product
• Dominant share
• Little potential for growth
• Large positive cash inflow
12. Strategy for cash cows
• Harvest
• Defend market share
• Aim for short term profits
• Little need for investment
• Little potential for further growth
• Reduce investment in order to maximise
short term cash flow and profits
• Use profits from cash cows to invest in new
products
13. Dogs
• Here dog means unattractive
• Low share of a slowly growth market
• Not going anywhere
• No real potential
• Dogs are either
– Products that have failed or
– Products that are in the decline phase of their life
cycle
14. Strategy for dogs
• Phase out or sell off (divest)
• Not worth investing in
• Any profit made has to be re-invested just
to maintain market share
• Uses up more management time and
resources than can be justified
• Divest or, at most, focus on a defendable
niche
15. Strategic decisions that flow from the
Boston Matrix
• Cash from cash cows should be used to
support stars
• Inadequate funding of stars will lead to a fall
in market share and eventually becoming a
problem child
• As markets mature stars will become cash
cows and eventually problem children
• Problem children should be funded to
become stars-if not they should be dropped
• Dogs can be milked for cash but are probably
bettered dropped
16. Value of the Boston Matrix
• A useful tool for analysing product portfolio
decisions
• But it is only a snapshot of the current
position
• Has little or no predictive value
• Does not take account of environmental
factors
• There are flaws which flow from the
assumptions on which the matrix is based
17. Assumptions underlying the Boston
Matrix
• Market share can be gained by investment in
marketing
• Market share gains will always generate cash
surpluses
• Cash surpluses will be generated when the
product is in the maturity stage of the life
cycle
• The best opportunity to build a dominant
market position is during the growth phase
18. Criticisms of the Boston Matrix
• Market growth is an inadequate measure
of a market’s attractiveness
• Market share is an adequate measure of a
products ability to generate cash
• The focus on market share and market
growth ignores issues such as developing
a sustainable competitive advantages
• The product life cycle varies
19. Boston Matrix: summary
Star Problem child
High market growth High market growth
High market share Low market share
Cash neutral Cash absorbing
Hold Build
Cash cow Dog
Low market growth Low market growth
High market share Low market share
Cash generating Cash neutral
Harvest or milk Divest
20. Keep up-to-date with business
stories, resources, quizzes and
worksheets for your business
course. Click the logo!