Sunkoshi landslide report final
•Télécharger en tant que DOCX, PDF•
4 j'aime•2,553 vues

hazard report on landslide accured on sunkoshi its prepared by er, n dr, from Nepal engineering association

Recommandé
Contenu connexe
Tendances
Tendances (20)
En vedette
En vedette (18)
Similaire à Sunkoshi landslide report final
Similaire à Sunkoshi landslide report final (20)
Dernier
Dernier (20)
Sunkoshi landslide report final
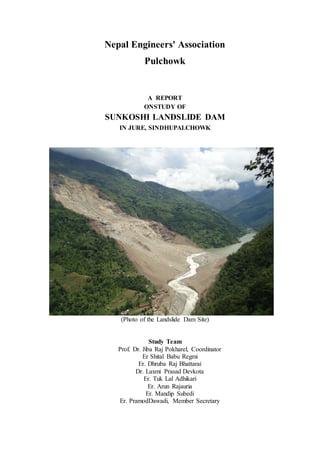
- 1. Nepal Engineers' Association Pulchowk A REPORT ONSTUDY OF SUNKOSHI LANDSLIDE DAM IN JURE, SINDHUPALCHOWK (Photo of the Landslide Dam Site) Study Team Prof. Dr. Jiba Raj Pokharel, Coordinator Er Shital Babu Regmi Er. Dhruba Raj Bhattarai Dr. Laxmi Prasad Devkota Er. Tuk Lal Adhikari Er. Arun Rajauria Er. Mandip Subedi Er. PramodDawadi, Member Secretary
- 2. 2 ACKNOWLEDGEMENT This assignment had to be completed in a very short time. It is natural that such an intricate and complicated work would not be complete without receiving support from different persons and institutions. The Team likes to thank Nepal Engineers Association and its President Dhruba Raj Thapa for giving us the opportunity to work in such a prestigious assignment. Special thanks are to the Ministry of Home Affairs in general and the Joint Secretary YadavKoirala in particular who not only invited us to the meeting held in Singha Durbar to appraise with the prevailing situations but also for provided permission to visit the site. The Chief District Officer of Sindhupalchowk district Mr.GopalParajuli also deserves very many thanks in this regard. We also like to thank Prof. Dr. Durga Prasad Sangroula and Mr. HariShanker Shrestha for providing with some very important information. Furthermore, the Team extends its heartiest thanks to the Ministry of Home Affairs for providing permission to visit the site. The Team thanks in particular the Nepal Army and especially its Pilot Mr. SubarnaBista for airlifting some of the Team members to Kathmandu from the site after the heavy rainfall had made access to downstream impossible. Thanks are to Mr. KrisnaSingh Basnetand Mr. Shankar Pandit for making all the necessary logistic arrangement and accompanying to the site. We also like to thank Kantipur TV and its anchor person VijayaPoudel for taking the interview of the team in the site and transmitting in its Sarokar program. Sincere thanks are also to Nepal Development Research Institute for providing facilities to perform Dam Break Analysis and RECHAM Consult for technical support to carry out hydrological measurements at site.
- 3. 3 EXECUTIVE SUMMARY Landslide occurred in Jure Sindhupalchowk on Saturday the 2nd of August 2014. This landslide blocked the flowing Sunkoshiriver and created a landslide dam. It also resulted in the demise of several people together with the cattle and buildings. This incident shook the whole of the country as the calamity of this size had not occurred before. Nepal Engineers Association formed a meeting to make a study of this incident and make recommendations for taking necessary actions in the future. The team immediately held several meetings and made the study of the dam with the help of secondary information. It also visited the site and took few measurements in the dam site as the rainfall prevented to take detailed data. In fact, the rainfall was so severe that access to downstream was difficult and the team had to be airlifted to Kathmandu by the Nepal Army. The Team with the help of primary and secondary information assessed whether or not the dam will fail as have so many of them in the past. On the basis of the study, the following recommendations have been made. In view of the composition of the dam, there is very less likelihood of its failure The failure can take place only if there is a similar landslide in the upstream creating an exploding landslide dam which however appears very remote. Heavy rainfall of the kind encountered in the past may lead to the overtopping of the dam but again there is very little or no likelihood of the failure of the dam. If there is a sudden collapse of the dam within half an hour, only the nearby Khadichour will be affected greatly but the settlements downstream will not be affected. In the case of collapse lasting for six hours, there will be no adverse impact downstream Affected people should be given relief to the extent possible. Response should be carried out in two phases- emergency and long term as mentioned in the report. The landslide dam should be emptied and the road constructed along its earlier alignment for which support from China (those engineers who have worked in the draining of theTangjishian and other 103 landslide dams successfully formed due to 2008 earthquake should be approached) and India should be taken soon because we do not have that much experience. In future Nepal can manage do on its own after the skill and knowledge is transferred. Because there is likelihood of formation of such dams if there is high magnitude earthquake in the future in Nepal. In case of the inability of draining the impounded water which is likely in view of the rather huge amount of dam material, consideration should be made towards making it a hydro power generation Project with the concurrence of the affected people. Nepal Engineers Association is ready to help in the future in collaboration with other professional organizations if requested by the Government.
- 4. 4 Table of Contents ACKNOWLEDGEMENT ................................................................................................................2 EXECUTIVE SUMMARY ...............................................................................................................3 1 INTRODUCTION ...................................................................................................................5 2 OBJECTIVES .........................................................................................................................5 3 METHODOLOGY ..................................................................................................................6 3.1 Available information of the area ...................................................................................................................................6 3.2 Identified High Risk Zones ..............................................................................................................................................7 4 BREACHING OF LANDSLIDE DAMS ..................................................................................8 5 HISTORY................................................................................................................................8 5.1 Budhi Gandaki in Nepal ..................................................................................................................................................9 5.2 Usoi Dam in Tajikastan ...................................................................................................................................................9 5.3 Lake Waikaremoana in New Zealand ..........................................................................................................................10 5.4 Attabad Lake in Pakistan ..............................................................................................................................................10 5.5 Gros Ventre landslide ....................................................................................................................................................11 5.6 Dadu Riverburst .............................................................................................................................................................11 6 LONGEVITY OF THE DAMS ..............................................................................................11 7 BEST PRACTICE .................................................................................................................12 8 DAM BREACH ANALYSIS OF LANDSLIDE CREATED SUNKOSHI DAM.....................12 9 DETERMINATION OF PARAMETERS ..............................................................................13 10 HYDRO-METEOROLOGY OF THE CATCHMENT AREA...............................................13 10.1 Rainfall Characteristics ...........................................................................................................................................13 10.2 River Hydrology .......................................................................................................................................................14 10.3 Flood at Different Return Periods ..........................................................................................................................14 11 DAM BREACH ANALYSIS OF LANDSLIDE CREATED SUNKOSHI DAM.....................15 11.1 Estimation of the Water Stored in the Reservoir..................................................................................................15 11.2 Model Set-up.............................................................................................................................................................16 11.3 Dam Breach Scenarios.............................................................................................................................................18 11.4 Results of the Simulations .......................................................................................................................................19 11.5 Suggestion for the design of the spillway ...............................................................................................................22 12 FUTURE COURSE OF ACTION..........................................................................................22 12.1 Response Management ............................................................................................................................................22 12.2 Early stage ................................................................................................................................................................22 12.3 Emergency response stage.......................................................................................................................................23 12.4 Long-term process stage ..........................................................................................................................................23 13 SOCIAL ASPECT .................................................................................................................24 13.1 Relief Measures ........................................................................................................................................................24 14 CONCLUSIONS AND RECOMMENDATIONS...................................................................24 REFERENCES ...............................................................................................................................27
- 5. 5 1 INTRODUCTION A large landslide debris dam was deposited by a large landslide at bordering region of Mankha and Ramche VDCs of Sindhupalchowk around 02:30 AM, Saturday morning, 2nd August 2014. The landslide destroyed dozens of houses and deposited large volume of debris material at existing Waterway of Sunkoshi River. The massive Kanlay hill crumbled to the ground killing more than 156 people.The impoundment caused by the landslide dam eventually inundated a number of houses including powerhouse (2.5 MW) of Sanima Hydropower Company and part of Arniko highway. Further, due to collapse of six transmission line pylons, power from upstream hydropower plants (Bhotekoshi, Bhairabkund, Chaku and Lower Chaku) and been interrupted. At the downstream side substantial potential risk is impending for settlements and structures such as Sunkoshi barrage, Damside settlement, Sunkoshi power canal, Lamosanghu bazaar, Sunkoshi power plant, Khadichaur bazaar, Lamosangu-Jiri road and bridge, Andheri bazaar, Kothe settlement, Balephi bazaar, Bhainse, Baluwa, Sukute bazaar, Sunkoshibridge and Pachuwarghat areas. Lower level of risk is also anticipated further downstream of Sunkoshi river in Kavre, Ramechhap, Sindhuli (including Khurkot), Okhaldhunga, Khotang, Udayapur (including Ghurmi), Sunsari (including Chatara), Saptari district, Saptakoshi bridge and barrage and India. Landslide at the area is not a new incident. Six decades ago a part of the same hill had toppled down rendering serious human casualties. The area was declared a slide prone area by many researchers and field workers. People settled in the area due to economic benefits and facilities available due to passing highway in the area. The disaster event is considered of an unprecedented scale and warrants for concerted effort from all quarters for rescue and relief operation in combination with all possible logistics, expertise and knowhow to manage the crisis in a safe manner at the soonest. In this backdrop, Nepal Engineers’ Association (NEA) has decided to contribute towards crisis management as well as subsequent engineering interventions in the problem area inclusive of entire Sunkoshi river banks downstream up to Indo-Nepalese border. In this regard, NEA has formed a seven member team of experts under the leadership of Prof. Jib Raj Pokharel on Saturday, 2nd August 2014, to initiate immediate engineering response to assist the GoN’songoing rescue and relief as well as urgent engineering interventions jointly with other stakeholders involved in the crisis management. This initiative has come as a part of social responsibility of the Nepalese engineering profession. The team of experts appraised themselves on the ongoing efforts of the GoN towards the management of the rescue and relief efforts, understanding of the hourly turn of events as well as on the possible engineering interventions applicable in the current situation. 2 OBJECTIVES For emergency mitigation planning related to potential dam-break flood, the key issues are (1) assessing the dam stability; (2) evaluating the potential dam breach process and mechanism; and (3) predicting the dam-break flood parameters, including the probable peak and (4) suggesting mitigation measures. In view of this the objectives are to: make a study of similar incidents in Nepal and abroad determine the likely parameters of the landslide dam
- 6. collect the information about the geological and soil related properties of the area draw the likely scenarios predict the peak discharge and surge of flood discharge in downstream settlements 6 with respect to the aforementioned scenarios assess the factor of safety of dam recommend future courses of action 3 METHODOLOGY The methodology followed has been both qualitative and quantitative. Dam Break modelling using HEC-RAS is used to find out the discharge in the downstream located settlements. The data collected are both of primary and secondary nature. During the site visit, the depth of the dam was measured using eco-sound instrument. The base level and the water level were calculated using the existing reduced levels of the dam base and the roof level of the Powerhouse of Sanima Hydropower Company. Additionally, interaction was carried out with affectedand other related peoples during the site visit. 3.1 Availableinformation of the area Available information on the area includes the following: Helicopter photographs of the area taken in 1989 under Arniko Highway Rehabilitation Project, Ortho-photo map, geological map, land use map and hazard map, all in 1:10,000 scale developed under HMWA project, Topographic map of the area in 1:50,000 scale, Recent photographs from formal and non-formal media, Site visit by the team members and experts Real time discharge information at Gauge 660 at Barhbise bridge Previous hydrological analysis and engineering investigations undertaken during AHRP, RFRP and AHP projects Various case studies published by ICIMOD and other agencies The team of experts has assessed the level of impacts based on above information applying expert engineering judgement and rapid analyses. The catchment of BhotekoshiRiver mostly lies in Tibet autonomous region of China. The catchment area map and allied information is shown in Figure 3.1.
- 7. 7 Figure 3.1: Catchment Area Map along with Isohytals While applying the expert engineering judgement, the panel of experts has also considered the recorded / observed damages caused by the larger flood events in the Sunkoshi and Bhotekoshi rivers: GLOF 1964: many parts of Arniko highway were washed away at many location and most of the pedestrian bridges were washed away, GLOF 1981: major bridges at Miterisanghu and Phulpingkot were washed away and about a dozen of stretches of Arniko highway were washed away, which were later realigned, and Debris flow event at SunkoshiKhola in 1987: many sections of Arniko highway were washed out, most of which were rehabilitated during RFRP and AHP projects. 3.2 IdentifiedHigh Risk Zones It was interesting to note that the sections affected by 1981 GLOF were also reactivated in flood event of 1987, providing hint that those are among the most likely zones of impact. The present assessment considers this aspect while identifying the most critical stretches between Barhbise and Dolalghat. Notable vulnerable stretches include km 61, km 62, km 65, Sukute,
- 8. km 69 (AH1), km 70 (AH2), km 72 (AH3), km 72.5 (AH4, Balephi), km 73.5 (AH5), km 78.5 (AH6, Khadichaur), km 80 (AH7, Lamosangu), km 82 (AH8, Damside), km 83.9 (AH9, Jure) and km 84.5 (AH10) etc. The identified high risk zones are indicated in the Attachment 3. These consist of zones of high impact including toe cutting and landslide triggers, inundation potential of point bars and flood plains and major facilities like bridges, power plants and settlements in danger. These identified high risk zones are to supplement the wealth of information produced by other professionals and teams in other forms such as VDCs affected, Wards affected etc. 8 4 BREACHING OF LANDSLIDE DAMS Breaching of a dam creates a sudden short-term increase in downstream discharge. If breaching is catastrophic, as so often in the Himalayan region, the impact of the flood wave can far outweigh that of other high flows. In part, this can involve a concentration of flow in the upper reaches of the rivers well in excess of weather-produced extremes of runoff. Figure 4.1: Landslide phenomenon 5 HISTORY Landslide dams have been occurring since time immemorial. The reasons can be various- for example in the Andes of Venezuela of the 35 cases, 63 percent were triggered by earthquake while the other 20 per cent by the torrential rains. In the Mandoza valley in Argentina, out of the 15 such landslide dams, 9 were created by rock avalanche. In this case, it is the rock avalanche that has triggered the landslide. The first recorded landslide dam goes to the year 1771 known as the Monte Forca Rock Slide in Italy during the reign of Prithvi Narayan Shah in Nepal. The most recent is the one caused by the Nanning earthquake in the Niulan River for which 4200 people downstream have
- 9. already been evacuated. Some of the notable landslide dams in Nepal and abroad are as follows. 5.1 BudhiGandaki in Nepal The BudhiGandaki River in Nepal was twice dammed near Lapubesi. In 1967, the river was dammed for three days after the failure of Tarebhir. Another landslide in 1968 dammed the river again with a huge amount of displaced material. Water level of the river dropped from a normal depth of 4m on 1 August to 0.9m after blockage. After the breaching of the landslide dam, the water depth jumped to 14.61m. The peak flow was estimated to be 5210 m3/s, which was significantly greater than the mean annual instantaneous flood of 2380 m3/s. Many bridges and settlements were swept away after the breach. 9 Figure 5.1. Budhi Gandaki Landslide Dam area (no lake at Present) 5.2 Usoi Dam in Tajikastan The lake was formed by a landslide in 1911. A lake with 16 km length called ' 'Lake Sarez', the largest lake in the world resulting from a landslide was created. Five million people live in the valleys downstream of the dam. Even partial breaching of the dam could cause catastrophic flooding. Complete failure of the dam could result in the deadliest natural disaster in human history Figure 5.2. Lake Sarez in Tazikastan
- 10. 5.3 LakeWaikaremoana in New Zealand It is located in TeUrewera National Park in the North Island of New Zealand, 60 kilometres northwest of Wairoa and 80 kilometres west-southwest of Gisborne. It was formed by a 250m high landslide dam believed to be 2,200 years old. It covers an area of 54 km². Between 1935 and 1950 the landslide was tunnelled and sealed to stabilise it so it could be used for hydroelectric power generation. This appears to be the first example of modification of a natural landslide dam for power generation. Lake Waikaremoana is a holiday destination by people who use the lake for fishing, tramping and other recreational activities. Although the Waikare River carries a flow of about 17m³/s from Lake Waikaremoana, the head of water through the 3 power stations, Kaitawa, Piripura, and Tuai is around 450 metres, allowing the stations to potentially generate 124 megawatts. 10 Figure 5.3.Lake Waikaremoana in New Zealand 5.4 Attabad Lake in Pakistan Attabad Lake, Gojal, also known as Gojal Lake, is a lake in the Gojal Valley of northern Pakistan created in 4 January 2010 by a landslide dam.The lake was formed due to a massive landslide at Attabad village in Gilgit-Baltistan. The landslide blocked the flow of the Hunza River for five months. Figure 5.4.Attabad lake Pakistan
- 11. 11 5.5 GrosVentrelandslide The GrosVentre landslide, Wyoming, USA occurred on June 23, 1925, following the melt from a heavy snowpack and several weeks of heavy rain. Approximately 38,000,000 m3 of rock slid down the north face of Sheep Mountain. The landslide created a huge dam 61 m high and 370 m wide (Similar in size with Sunkoshi Dam) across the GrosVentre River, backing up the water and forming Lower Slide Lake. On May 18, 1927, a portion of the landslide dam failed, resulting in a massive flood and wiping small town of Kelly, 10 km downstream. It is an example of a huge, short-lived and disastrous landslide dam. Figure 5.5.GrosVentre Slide 5.6 DaduRiverburst Among the most destructive landslide lake outburst floods in recorded history occurred in the Sichuan province of China on 10 June 1786 when the dam on the DaduRiverburst, causing a flood that extended 1400km downstream and killed 100,000 people. 6 LONGEVITY OF THE DAMS Such landslide dams exist for varying periods. A study of 15 dams has revealed that one in five dams has been found to fail within 75 days of their formation. Some of the exploded dams are as follows: Sn Location Year Impounded Vol ( Mcm) Outburst Vol (Mcm) 1 Indus, Pakistan 1841 6500 6500 2 YigongZangbo Tibet 2000 2015 2015 3 Rio Barrancas, Argentina 1914 1550 1550 4 Hunza, Pakistan 1858 805 805 5 Tanguddong, China 1967 680 640 6 SondorSennca, Peru 1945 721 664 7 Mayunmarca, Peru 1974 352 350
- 12. Failure of landslide valley blocking dams and their time of failing is shown in Figure 6.1. It shows that half of such dams fail in less than 10 days and 14 percent of the dams stay for more than a year. 12 Figure 6.1 7 BEST PRACTICE The landslide dams have been managed differently in different places. But China has some of the very rich experiences in this area. Especially, the successful solution of the problem arising out of the Tangjishan dam is worth studying. It occurred after the earthquake of the year 2008. The M 8 Wenchuan earthquake of May 12, 2008 triggered a series of landslides in China which were 104 in number impounding 100,000 cubic meter of water. Their stability was a subject of concern for the Chinese authority as it occurred following the earthquake. Some of the critical lakes were selected for intervention. It consisted of constructing a spillway for the drainage of water. One of the largest, the Tangjishian lake was subjected to excavation for the construction of the spillway which lasted for seven days for which 135,000 m3/s of material was excavated making a 425m long spillway by June 8. The total volume was 320 MCM but after the outflow it became 247.4 MCM, a reduction of about 23 per cent. Flow in the spillway increased and a controlled partial breach occurred on June 10 involving a breached volume of 160 million cubic meter and a maximum discharge of 6500m3/s. During the controlled breaching, lateral and vertical erosion of the spillway occurred but the complete catastrophic failure of the dam did not take place. The controlled breaching left the lake with a volume of 87 MCM. The success of this operation was replicated in several other rockslide dams and no catastrophic failure occurred. 8 DAM BREACH ANALYSIS OF LANDSLIDE CREATED SUNKOSHI DAM The dam created by the landslide that occurred on August 2, 2014 is shown in Figure 8.1. The length of the dam was estimated to be of 300m. Based on the contour map of the area, the river bed level at the dam site is about 793 masl. The water surface elevation was estimated to be 840 masl. The Eco-sound measurement of the deepest point in the river also gave 46.7 m of depth. These data show that the maximum water depth at the reservoir is of 47m. The freeboard at the left bank is about 5m. It gives the total height of the dam is of about 52m.
- 13. 13 Figure 8.1: Dam Created by Landslide 9 DETERMINATION OF PARAMETERS The following parameters have been found on the basis of the primary as well as secondary information. Dam and spillway geometry Dam spillway invert level 838 masl Dam crest elevation 845masl Dam downstream face gradient1V: 6H Length of Spillway channel600 m Volume of debris deposit 2.0 MCM Volume of mass waste 3.0 MCM Geotechnical properties of dam material Unit weight, ρ 2200 (1900–2500) (kg/m) Internal friction angle φ 32 (◦) Cohesion, C 5 (0–15) (kPa) Porosity 0.32 (0.28–0.45) 10 HYDRO-METEOROLOGY OF THE CATCHMENT AREA 10.1 Rainfall Characteristics There is a rainfall and a flow gauging stations at Barabise to measure the rainfall and discharge of the Bhotekoshi River. Rainfall data of 1976 -2005 shows that it receives almost 3,000 mm of rain annually. More than 80% of the rain falls during the monsoon season. The
- 14. monthly variation of rainfall is shown in Figure 10.1. Further, the 24 hr maximum rainfall recorded at this station is 166 mm on 29th of July 1982. These data show that the catchment area is high precipitation receiving zone and there is a probability of having very intense rainfall of a short duration too. 14 19.3 27.0 49.6 89.1 205.2 470.7 781.6 778.5 430.8 85.6 9.0 19.4 900 800 700 600 Precipitation (mm) 500 400 300 200 100 0 Jan Feb Mar Apr May Jun Jul Aug Sep Oct Nov Dec Month Figure 10.1: Long Term Monthly Variation of Rainfall at Barabishe (1976-2005) 10.2 River Hydrology The flow of the Bhotekoshi River recoreded at Barabise gauging station and published by Department of Hydrology and Meteorology (DHM) from 1965 to 2006 was used for flow analysis. It is assumed that the flow added by the Sunkoshi River, which lies u/s of the dam site, to the Bhotekoshi River was assumed to be 10% of the flow measured at Barabishe. The annual average flow at the dam site, thus, calculated is 88m3/s. The long term monthly hydrograph of the site is shown in Figure 10.2. It shows that the highest flow in the site generally occurs in the month of July or August. The observed daily maximum flow was 1,500m3/s at that site. 10.3 Flood at Different Return Periods Gumbel distribution was fitted to the observed annual instantaneous flows, after removing the outlier, to estimate the flows at different return periods. It is given in Table 1. It shows that the maximum daily flow so far observed i.e. 1500 m3/s, corresponds to 100 year flood.
- 15. 15 Dam Site Unit: m3/s Month Average Flow Maximum Flow Jan 27 41 Feb 24 37 Mar 23 42 Apr 27 87 May 42 253 Jun 95 398 Jul 198 627 Aug 277 1507 Sep 185 452 Oct 88 309 Nov 47 98 Dec 32 54 Annual 88 1507 300 250 200 150 100 50 0 Avera ge Flow Jan Feb Mar Apr May Jun Jul Aug Sep Oct Nov Dec Discharge (m3/s) Month Figure 10.2: Monthly Flow Hydrograph and Monthly Maximum Flow at Dam Site Table 1: Flow at Different Return Period at Dam Site Unit: m3/s Return Period T (years) YT Qbarabise Qdam 2 0.367 499 549 5 1.500 742 816 10 2.250 902 992 20 2.970 1056 1162 50 3.902 1255 1381 100 4.600 1404 1545 500 6.214 1749 1924 11 DAM BREACH ANALYSIS OF LANDSLIDE CREATED BY SUNKOSHI DAM Dam breach analysis was carried out to assess the flow characteristics along the river in case the landslide created dam at Sunkoshi gets breached. The magnitude of the flows and the stages (water surface) at different sections along the river provides the information on the probable damage it can create. 11.1 Estimation of the Water Stored in the Reservoir Elevation-Area-Capacity Curves were drawn using the contour data of the area u/s of the dam as shown in Figure 11.1. It shows that the stored volume in the dame at elevation 840 m came to 11.1 million cubic meter (MCM). The measured flow during the dam formation
- 16. period measured at Barabise was about 157m3/s. With the additional flow of 10% from at Sunkoshi River discharge at the dam site comes to about 175m3/s. The 840 m of elevation reached in the dam was estimated almost after 15/16 hrs of damming. As 11.1 MCM is close to the estimated flow and the water volume accumulated in the reservoir during this period it was taken as the volume of water behind the dam for dam break analysis. Other specifications are given in Table 2. 16 0 0.2 0.4 0.6 12 10 8 6 4 2 Commulative Volume Water Surface Area 0 0.8 790 800 810 820 830 840 Area (sq km) Elevation (masl) Figure 11.1: Elevation-Area-Capacity Curves of the Reservoir Table 2: Dam and Reservoir Specification Inflow to the Reservoir 175 m3/s Bed Level 793 masl Dam Length 300 m Dam Height 52 m High Water Level 840 masl Water Depth 47 m Water Volume 11.3 MCM Surface Area 0.6 km2 Lateral inflow of Balephi 140 m3/s Capacity (MCM) 11.2 Model Set-up HEC-RAS Model was used to simulate the dam breach phenomena. The unsteady flow model was set up to analyze the flow phenomena up to Dolalghat. A dam rectangular in shape that can store water of given volume was assumed for simplicity. The cross sections were extracted from 5m DEM developed from the available contour map of the area. The longitudinal profile of the river and the typical cross sections are shown in Figures 5 and 6 respectively. An inflow of 175m3/s was supplied on the upstream boundary and normal flow was assumed on the d/s boundary. A flow of 140m3/s was added at Balaphi as internal boundary while performing simulation. A roughness coefficient of 0.05 was assumed for all reaches.
- 17. 17 Fig 11.2 Plan View of the River Figure 11.3: Longitudinal Profile of the River
- 18. 18 Figure 11.4: Upstream of Dam Figure 11.5: Dam Section Figure 11.6: Khadichaur Figure 11.7: Dolalghat 11.3 Dam Breach Scenarios The number of dam breach scenarios analyzed and different parameters used for the analysis are given in Table 3. The worst case (Scenario I) is the breaching of the whole dam in short period (here in 30 minutes). The probable case might be breaching of one sixth dam in 6 hours. The results of such breaches are presented here. Other cases are of intermediate in terms of disaster. Table 3: Dam Breach Scenarios Scenario Analysis Breach Time Scenario Case Conditions Fast Slow S1 Worst Case Whole Dam Breached 30 mins 6 hrs S2 Worse Case Top half Breached 30 mins 6 hrs S3 Bad Case One third of the dam breached 30 mins 6 hrs S4 Probable Case One sixth of the dam breached 30 mins 6 hrs
- 19. Breach Parameters S1 S2 S3 S4 Centre Station 150 150 100 50 Final Bottom Width 300 300 200 100 Final Bottom Elevation 794 815 815 815 Left Side Slope 0 0 0 0 Right Side Slope 0 0 0 0 Brach Weir Coefficient 2.6 2.6 2.6 2.6 Full Formation Time 0.5/6 hrs 0.5/6 hrs 0.5/6 hrs 0.5/6 hrs Mechanism Piping Piping Piping Piping Initial Piping Elevation m 810 820 820 820 19 11.4 Results of the Simulations Maximum Flow and surge height and time under different scenarios The maximum flow, the surge height and time to reach maximum stage just downstream of the dam, Khadichaur (one of the most critical areas along the river) and the Dolalghat (downstream boundary and about 28 km downstream of the dam) are presented in Table 4. Table 4a: The flow, the surge height and time to reach maximum stage in S1 Scenario S1 Conditions Whole Dam Breached Just d/s of Dam Khadichaur Dolalghat Breach Time 0.5 hr 6hr 0.5 hr 6hr 0.5 hr 6hr Qnormal 175 175 175 175 315 315 Qmax 25315.17 3637.65 7187.21 2918.36 2299.47 2153.9 Hnormal 784.3 784.3 745.03 745.03 605.39 605.94 Hmax 788.35 785.91 756.72 751.59 609.67 609.45 Surge 4.05 1.61 11.69 6.56 4.28 3.51 Time to 110 120 15 mins 100 mins 25 mins reach Max Stage mins mins 200 mins Table 4b: The flow, the surge height and time to reach maximum stage in S2 S2 Top half Breached Just d/s of Dam Khadichaur Dolalghat Breach Time 0.5 hr 6hr 0.5 hr 6hr 0.5 hr 6hr Qnormal 175 175 175 175 315 315 Qmax 10697.8 2129.1 3295.12 1916.39 1608.62 1458.61 Hnormal 784.3 784.3 745.03 745.03 605.39 605.94 Hmax 788.88 785.22 751.7 749.93 608.54 608.26 Surge 4.58 0.92 6.67 4.9 3.15 2.32 Time to 125 140 15 mins 115 mins 30 mins reach Max Stage mins mins 230 mins
- 20. 20 Table 4c: The flow, the surge height and time to reach maximum stage in S3 S3 One third of the dam breached Just d/s of Dam Khadichaur Dolalghat Breach Time 0.5 hr 6hr 0.5 hr 6hr 0.5 hr 6hr Qnormal 175 175 175 175 315 315 Qmax 8644.28 1981.48 3979.77 1803.86 1652.95 1443.58 Hnormal 784.3 784.3 745.03 745.03 605.39 605.39 Hmax 789.02 785.12 753.22 749.74 608.62 608.23 Surge 4.72 0.82 8.19 4.71 3.23 2.84 Time to 130 140 15 mins 120 mins 30 mins reach Max Stage mins mins 240 mins Table 4 d: the flow, the surge height and time to reach maximum stage in S4 S4 One sixth of the dam breached Just d/s of Dam Khadichaur Dolalghat Breach Time 0.5 hr 6hr 0.5 hr 6hr 0.5 hr 6hr Qnormal 175 175 175 175 315 315 Qmax 8629.43 1737.92 3377.02 1607.36 1672.75 1406.75 Hnormal 784.3 784.3 745.03 745.03 605.39 605.39 Hmax 789.54 784.93 752.26 749.39 608.66 608.16 Surge 5.24 0.63 7.23 4.36 3.27 2.77 Time to 150 170 20 mins 135 mins 30 mins reach Max Stage mins mins 260 mins Even the results of the worst case shows that when the flow reaches Dolalghat,its magnitude gets reduced to less than the daily maximum flood that occurs in August. The maximum surge will be 4.28 m. It shows that there is no need of being panicked downstream of Dolalghat. However, proper attention and precautionary measures have to be taken for the critical locations like Khadichaur. Water Surface Profile for the Worst Case The water surface profile of the worst scenario is given in Figure11.8.
- 21. 21 Figure 11.8: The water surface profile of the worst scenario 850 800 750 700 650 Possibility of Breaching and Overtopping The nature of the material, mild slope of the dam and channel developed at the right side shows that there is less chance of breaching of the dam. However, if the intense rainfall of the magnitude that had occurred in the past takes place, the dam will get filled and overtopping may happen. For example if the recorded highest rainfall (166 mm in 24 hrs)occurs in the catchment, the dam will be filled in 2 hoursin which case there is likelihood of the failure of the dam. But the judgement can be made only after: a. Detailed study of the vulnerability of the area, b. Probability of extreme floods, c. Behaviour of river downstream of the dam, d. Composition of dam and river bed material, e. Upstream and downstream slopes of the dam, f. Probability of further landslide The view of debris dam as seen from downstream is shown in figure 11.9. Close examination of the dam, its location, debris material, material size, dam dimension indicate that the dam is relatively strong and will not give-up until there is extreme runoff in the river, massive landslide or earthquake. Figure 11.9 Downstream view of the dam 600 0.0 5.0 10.0 15.0 20.0 25.0 30.0 Water Surface Elevation (m) Distance from the Dam (km)
- 22. 11.5 Suggestion for the design of the spillway After the lake has been filled water has started spilling from the dam. Nepal army has lowered the invert level of the spillway by blasting and increased the flow in the river. As the level of the lake reduces the discharging capacity of the spillway will also decrease. So, to drain water from the lake the level of spillway has to be lowered regularly. Following sequence is suggested for draining out water from the river. a. Lower the invert level of the spillway so as to flow about 300m3/sout of the lake. As average discharge of the river is less than 200 m3/sat present this will continuously drain out stored water in the lake and will lower the level in the lake. Lowering the level at present spillway should be continued. If other channel is also opened risk of sudden damage to the dam may increase. 22 b. After the level of the lake has been lowered up to safe level the dam should be strengthened so that it does not collapse. c. River training work at the right bank should be done so as to check scouring by meandering river. d. After the river training work temporary road could be built near the existing alignment. Alternate alignment should be selected for permanent solution of the problem. 12 FUTURE COURSE OF ACTION Damming of river valley by a huge landslide and suffering of people, loss of property, danger of dam-burst and submergence of land and hydropower station (2.5 MW Sanima) is a serious situation. A debris dam on a river that has up to 1500m3/s of flood flow makes it further critical. So, different possible scenario has to be considered and acted upon accordingly. a. Normal At present the spillway outflow matches the inflow. So the depth remains constant. To drain out water from the submergence area an opening to discharge about 300 cms should be maintained. This requires continuous deepening of the crest level. Only one outlet should be activated so that it can have controlled flow. Present spillway position is appropriate as it has no or less finer materials and already has defined channel. b. High runoff If there is high runoff due to rainfall and runoff in the basin area, which is possible in August or September there may be higher flow from the spillway. If only one outlet is maintained and the discharge is within 500m3/sit can pass safely through Sunkoshi Dam and downstream areas. c. Extreme condition Extreme case may occur, but most unlikely, when there is extreme flow in the river and/or landslide occurs. For this scenario preparation for flood fighting, rescue and relief activities and information dissemination mechanism should be developed. 12.1 Response Management The response management can be addressed in three phases and they are the Early Stage, the emergency response stage and the long term response stage. 12.2 Early stage The key points are verification of the reported information and announcement of the
- 23. necessary information to public or to the relevant competent authorities. Once the reported information of the landslide dam formation is verified, it is needed to notify the relevant competent authorities. Otherwise, clarification is needed to avoid pubic panic. The major works of this stage are: 23 Verify the information of the landslide dam formation. Verify the location and the site condition of the landslide dam. Announce the verification result to the relevant competent authorities. This stage has already passed and hence the focus should be on the following stages. 12.3 Emergencyresponse The major works of this stage consist of the rapid evaluation of the risk of the landslide dam under limited time constraint coupled with an insufficient data. Moreover, emergency countermeasures and a preliminary evacuation planhas also to be ready for implementation. Furthermore, investigation and in-situ monitoring should be carried out for necessary data collection. The data collected at this stage can be very helpful for risk assessment and for taking the necessary decisions. The important activities of this stage are: Preliminary investigation Monitor changes of the landslide dam. The monitoring method should be developed by taking the site condition in consideration. Preliminary risk assessment Carry out emergency engineering works considering the engineering feasibility and necessity. Work out the preliminary alert system and evacuation mechanism (Define the alert value and the alert zone) 12.4 Long-term Response Depending upon the urgency and the investigation feasibility, each plan of detail investigation and risk evaluation should be re-evaluated for each landslide dam incidence. This should be followed by the updating of the corresponding countermeasures and the evacuation plan. The important activities of this stage are: Carrying out of the detailed investigation (considering accessibility and safety) Evaluating the risk level based on the aforementioned investigation result Updating of the countermeasures and the evacuation plan (update evacuation moment and alert level) Updating and strengthening of the monitoring system based on the investigation result (considering the site condition and necessity) Performing necessary long-term disaster prevention engineering project based on the detailed evaluation results. Re-evaluating the risk level of the landslide dam based on the site condition and the countermeasures.
- 24. 13 SOCIAL ASPECT The occurrence of fatal landslides in Nepal is increasing with time, faster than the effects of monsoonal variations. Possible explanations for the trends observed include: land-use change, population growth, and the development of transport infrastructure. The findings highlight the impact of infrastructure projects in rural Nepal use of heavy machinery in general and construction of rural road in particular. Within the Upper BhoteKoshi Valley clear transitions in settlement patterns and rural livelihoods (and thus the occupation of landslide prone areas) have been seen over time. For the majority of households, their decision to occupy these areas is driven by the economic and social benefits associated with the road. Landslide risk therefore emerges not just from societal marginalisation but also from situations of relative prosperity. The findings suggest that occupants of landslide prone areas have a good understanding of landslide hazard and its associated risk. However, these risks are contextualised in relation to other social concerns. The significance of the findings for landslide policy and practice are addressed along with different actors’ views of landslide risk management in Nepal. Settlement in the landslide areas, downstream of dam, were landslide prone and local people were aware of it. They gave higher priority to economic progress to landslide risks and settled in the area. For the people of submerged area in upstream side of the dam it was an unexpected shock. 13.1 Relief Measures Many people have been affected by the landslide dam. Many of their relatives have been lost. In this hour of grief, the Government should give the impression that the Government and the whole of the country is behind them. In this context, the Government should quickly take the following steps The affected persons are living with relatives, in relief camps or left the area at the 24 present. The Government should thus arrange for a shelter for them. The affected people should be providedwith some job as passing time without doing anything can aggravate the already bruised mindset. Some suggestions are: knitting for the women, making bamboo baskets etc for the men, working in rehabilitation works and road construction etc and others works based on their skill. The nearby school should be immediately opened as its functioning will give the impression of the return of normalcy. The Government should mobilize resource for resettlement and rehabilitation works. The Government should find land nearby so as to settle the displaced people The survivors should be compensated for their dead relatives, houses damaged andthe loss of agricultural land. 14 CONCLUSIONS AND RECOMMENDATIONS The team of experts has noted the ongoing rescue and relief efforts initiated by the Government though the affected persons have been complaining of their inadequacy. In particular the following conclusions are made which should be further improved as more information, field observation data and analyses become available. Immediate breaching possibility is less likely The Surge produced by the dam breach will be considerably damped when it reachesDolalgaht even in the worst case i.e., whole breaching of the dam in 30 minutes.
- 25. 25 Downstream of Dolalghat, dam breach effect will be negligible. However, proper attentions and precautionary measures are to be taken for the critical locations upstream of it like Khadichaur Bazaar. Deepening and widening of channel should be carried out gradually to lower the water impounded in the reservoir The condition of the landslide debris dam is marginally stable for the current level of impoundment. It may get jeopardized if weather condition becomes severe. Sudden breaching of the landslide debris dam cannot be ruled out at this point of time. It is likely that there may be more permeable zones within which may eventually initiate piping process as the impounded level rises. Feeding of more debris materials from the source cannot be over ruled but the probability is judged to be not so serious weather permitting. The condition seems to permit use of heavy equipment like excavators and dozers by helicopter lifting. Channel deepening and widening using excavators imparts lessdisturbance compared to blasting. Opening of Arniko Highway should be started without delay. In addition, power transmission lines and optical fibre communication network is destroyed which needs to be reinstated at the soonest. Based on the analysis following recommendations are made. a. Drain out water from the spillway safely. Increase the capacity of spillway to outflow 500cms. Deepen it as and when necessary by blasting or using heavy equipments. b. Maintain only one spillway on the right side of the river. c. Be prepared for rescue and relief in case of extreme events. d. Maintain information flow along the river course. e. The effect d/s of Chatara will be minimal even for extreme case. Panic need not be created on behalf of Sunkoshi landslide dam. f. A consultative decision should be taken for the lowering of water level in the upstream pond. g. Take necessary help from China or India and share expertise. h. The deepening and widening of the channel should be carried out with utmost care to make a good balance between inflow and outflow. Real time discharge at BhoteKoshiis available at BarhbiseBridge and a good discharge measuring control structure is available at Sunkoshi barrage. Further impounding level should be monitored on hourly basis and published for public benefit. i. The Arniko Highway which is the only connection to China at present is damaged badly and needs opening immediately. For this purpose a flexible boulder anchorage is recommended to be constructed along right bank of the river. It will have double function ie (a) train river and control undermining of the bank and (b) function as temporary road j. Detached power transmission line of INPS and optical fibre connection should be reinstated with temporary measures to reconnect power and telecommunication. k. Further geotechnical investigations such as ERT, MASW, soil/rock sampling and laboratory testing should be initiated as soon as conditions permit. The factor of safety at the landslide debris dam against sliding and piping should then be evaluated by geotechnical experts. l. As soon as impoundment is drained out, detailed investigation should be made on possible urgent, mid-term and long term engineering and management solutions. m. NEA along with engineering related societies should be considered as an important think tank for the entire relief and rehabilitation efforts.
- 26. 26
- 27. 27 REFERENCES Kuo Yu-Shu et al,2010, Emergency disposal plan of landslide dam in Taiwan, Forestry Bureau, Council of Agricuture, Taiwan Evans Stephen G et al, 2010, Natural and Artificial Rock Dams, Springer X. Fan et al,2012, Simulating dam-breach flood scenarios of the Tangjiashan landslide dam induced by the Wenchuan Earthquake, Natural Hazards and Earth System Sciences Attachments: 1. Mosaic helicopter photograph of the landslide area back in 1989 and corresponding geo-morphological tracing, 2. Engineering geological map of the area in 1:10,000 scale prepared under a project Hazards Mitigation in Sunkoshi and Bhotekoshi Water Catchment Areas (abbreviated as HMWA) by ITECO in association with ICIMOD, under a Swiss funded project, (Corresponding orthophoto map, land use map and hazard map in scales of 1:10,000 are also available with ITECO and ICIMOD, 3. An inventory of high risk zones at immediately downstream of the landslide debris dam in GoogleEarth image base with indication of possible inundation areas, zones with damage potential including settlements and facilities (bridges and powerplants)