SlideShare une entreprise Scribd logo
1  sur  333
Télécharger pour lire hors ligne
TÜİK                                                                                                          TÜİK

EKONOMİK                                                                                                      EKONOMİK
GÖSTERGELER                                                                                                   GÖSTERGELER
Economic                                                                                                      Economic
Indicators                                                                                                    Indicators
2012 I II III IV                                                                             ISSN 1305-3353   2012 I II III IV                                                                             ISSN 1305-3353


                          Türkiye Ekonomisi, Mayıs 2012                                                                                 Türkiye Ekonomisi, Mayıs 2012
                            Turkish Economy, May 2012                                                                                     Turkish Economy, May 2012
                70+ sanayi üretim endeksi aylık yüzde değişim (%)                                                             70+ sanayi üretim endeksi aylık yüzde değişim (%)
             70+ industrial production index monthly percentage change (%)                                                 70+ industrial production index monthly percentage change (%)

                                        80                                                                                                            80


                                        70                                                                                                            70


                                        60                                                                                                            60

             Kapasite                                             İhracatın ithalatı                                       Kapasite                                             İhracatın ithalatı
 kullanım oranı (%)                     50                        karşılama oranı (%)                          kullanım oranı (%)                     50                        karşılama oranı (%)
              Capacity                                            Rate of imports covered                                   Capacity                                            Rate of imports covered
   utilization rate (%)                                           by exports (%)                                 utilization rate (%)                                           by exports (%)


                               70-ÜFE aylık artış hızı (%)                                                                                   70-ÜFE aylık artış hızı (%)
                            70-PPI monthly rate of increase (%)                                                                           70-PPI monthly rate of increase (%)

                              Mayıs 2012            Mayıs 2011                                                                              Mayıs 2012            Mayıs 2011
                              May 2012              May 2011                                                                                May 2012              May 2011


                                                                  TÜRKİYE İSTATİSTİK KURUMU
                                                                     Turkish Statistical Institute
TÜİK


EKONOMİK
GÖSTERGELER
Economic
Indicators
2012 I II III IV


               TÜİK, Ekonomik Göstergeler, II. Dönem 2012
                                                                   
                  TurkStat, Economic Indicators, Quarter II 2012
I II III IV


                      İstatistiki veri ve bilgi istekleri için

                                       Bilgi Dağıtım Grubu

                                             Tel:
                                                Faks-Fax:


                                        Yayın istekleri için

                                 Döner Sermaye İşletmesi

                                      Tel:
                                                Faks-Fax:


                 Yayın içeriğine yönelik sorularınız için

               Ulusal ve Uluslararası Göstergeler Takımı

                                             Tel:
                                                Faks-Fax:

                                                İnternet
                                   http://www.tuik.gov.tr

                                                   E-posta
                                          bilgi@tuik.gov.tr

                                                    Yayın No
                                                           3874
                                                             	 	   	      	     	   	     	
                                                            ISSN
                                                         1305-3353


                                Türkiye İstatistik Kurumu

                    Yücetepe Mah. Necatibey Cad. No: 114 06100 Çankaya-ANKARA / TÜRKİYE


     Bu yayının 5846 Sayılı Fikir ve Sanat Eserleri
     Kanununa göre her hakkı Türkiye İstatistik Kurumu
     Başkanlığına aittir. Gerçek veya tüzel kişiler
     tarafından izinsiz çoğaltılamaz ve dağıtılamaz.


            Türkiye İstatistik Kurumu Matbaası, Ankara
                                   Tel: 0312 410 01 64 * Faks-Fax: 0312 418 50 82
                                              Ekim 2012
                                          MTB: 2012-617-100 Adet-Copies


II     TÜİK, Ekonomik Göstergeler, II. Dönem 2012
     ISBN 978-975-19-5365-0 Quarter II 2012
        TurkStat, Economic Indicators,
Foreword	                                                                                                                                  Önsöz


                                      ÖNSÖZ                                                                  FOREWORD


         1952 ylndan itibaren yaymlanmakta olan “Aylk                           “Monthly Bulletin of Statistics” published since 1952

 statistik Bülteni” ve 1989 tarihinden itibaren kullanma                       and “Turkish Economy: Statistics and Analysis” published

sunulan “Türkiye Ekonomisi statistik ve Yorumlar” yaynlar                     since 1989 are merged into one publication. The

birle tirilerek tek bir yayn haline getirilmi tir. “Ekonomik                   publication   titled    as   “Economic    Indicators”    contains

Göstergeler” yayn,           Türkiye ekonomisine ili kin temel                statistical information and analyses constituting main

ekonomik göstergeleri olu turan istatistiki bilgi ve analizleri                 economic indicators of Turkish economy.

içermektedir.


         Üç aylk dönemler itibariyle Türkçe- ngilizce olarak                       The publication published quarterly in Turkish and

yaymlanan         yayn,     içerdi i       ekonomik    göstergelerle,         English aims at to enlighten the main economic trend

konjonktürel         geli meleri       ve     de i meleri       yanstarak      through economic indicators on conjectural movements

ekonominin         temel      gidi at      hakknda    bilgi        vermeyi    and variations.

amaçlamaktadr.


         lk kez 2004 ylnn ikinci döneminde kullanma sunulan                     The publication presented for the first time in the

bu yaynda son be yla ait yllk, son üç yla ait aylk ve                     second quarter of 2004, covers annual data of the last five

dönemlik veriler yer almaktadr.                                                years and, monthly and quarterly data of last three years.


         statistiklerin,    bilgiye    dönü türülmesini         ve     kolay        The publication is supported with a brief explanation

kavranlmasn sa lamak amacyla yayn; analiz, grafik ve                       on analyses, graphs and related indicators in order to

ilgili    göstergelere      ili kin   ksa    bir   de erlendirme         ile   enable the transformation of statistics into information to

desteklenmi tir.                                                                facilitate the comprehension.


         Bu yaynn, Türkiye ekonomisine ait verileri etkin,                        We believe that this publication will be an important

güncel ve bütüncül bir yap içinde yanstmada önemli bir                        reference which reflects the figures of Turkish economy in

kaynak olaca  inancndayz.                                                    an up-to-date, compact and efficient manner.


                                                                                                                            Birol AYDEMİR
                                                                                                                                     Başkan
                                                                                                                             Birol AYDEM R
                                                                                                                                    President
                                                                                                                                        Ba kan
                                                                                                                                        President


                                                                                                  TÜİK, Ekonomik Göstergeler, II. Dönem 2012
                                                                                                                                                      III
                                                                                                     TurkStat, Economic Indicators, Quarter II 2012
Contents	                                                                                İçindekiler


                     Ç NDEK LER                     CONTENTS


                                            Sayfa

                                            Page


                                Önsöz        III    Foreword

                            çindekiler       V      Contents

              Simge ve Ksaltmalar           VI     Symbols and Abbreviations


                   Türkiye Ekonomisi          1     Turkish Economy

                      Ulusal Hesaplar        11     National Accounts

              Sanayi ve     statistikleri    61     Industry and Business Statistics

                           Bina n aat       87     Building Construction

                                 Tarm       107    Agriculture

                            Beklentiler      121    Expectations

                            D Ticaret       143    Foreign Trade

                               Fiyatlar      181    Prices

                                  gücü       217    Labour

                          Gelir-Tüketim      255    Income-Consumption

                            Borçlanma        273    Borrowing

                                 Bütçe       281    Budget

                            Para-Banka       289    Money-Banking

                                Turizm       303    Tourism

                             Ula trma       315    Transportation

                                     Ek             Appendix

                Yaymlama Takvimi            325    Release Calendar

        lgili Bilgilere Ula mak çin...       326    To Reach The Related Information…


                                                       TÜİK, Ekonomik Göstergeler, II. Dönem 2012
                                                                                                           
                                                          TurkStat, Economic Indicators, Quarter II 2012
Simge ve Kısaltmalar                                                                                              Symbols and Abbreviations

        S MGE VE KISALTMALAR                                                                             SYMBOLS AND ABBREVIATIONS


        Bilgi geçicidir.                                                                *                Data is provisional.
        Bilgi elde edilememi tir.                                                      …                 Data not available.
        Bilgi yoktur.                                                                   -                Denotes magnitude nil.
        Uygulanamam tr                                                                .                Not applicable
        Kullanlan birimin yarsndan azdr.                                            0                Magnitude less than half of unit employed

        53 sayl Kanun gere i gizlilik ilkesine göre özel sektörde bir               (*)                Data pertaining to one or two private sector establishments
        veya iki i yerine ili kin bilgiler verilmemi tir.                                                are not given by law no. 53 which is indicated.


        Küçük veya e it                                                                                  Less than or equal to
        Büyük veya e it                                                                                  More than or equal to

        Ba ka yerde snflandrlmam                                     b.y.s.                n.e.c.   Not elsewhere classified

        Ortalama                                                                      (A)                Average
        Bir önceki aya göre de i im oran (%)                                         a/a                Percentage change over the previous month (%)
        Bir önceki döneme göre de i im oran (%)                                      d/d                Percentage change over the previous quarter (%)
        Bir önceki yln ayn ayna/dönemine göre de i im oran (%)                   y/y                Percentage change over the same month/quarter of the
                                                                                                         previous year (%)

        Yeni Türk Liras                                                  YTL                   TRY      New Turkish Liras
        Yabanc Para                                                      YP                    FX       Foreign exchange
        Tasarruf Mevduat Sigorta Fonu                                    TMSF                  SDIF     Saving Deposit Insurance Fund
        Maliyet, Sigorta, Ta ma                                                      c.i.f.             Cost, Insurance, Fright

        Gemide Teslim                                                                f.o.b.              Free on Board

        Uluslararas Standart E itim Snflamas, 1997                             ISCED,97              Standard International Classification of Education Status,
                                                                                                         1997
        Uluslararas Standart Meslek Snflamas, 1988                             ISCO - 88             International Standard Classification of Occupations, 1988
                                                                                                         Version
        Tüm Ekonomik Faaliyetlerin Uluslararas Standart Sanayi                    ISIC Rev.3            Industrial Classification of All Economics Activities, Third
        Snflamas, 3. Revizyon                                                                         Revision
        Geni Ekonomik Grup Snflamas                                                BEC                Broad Economic Classification

        Standart Uluslararas Ticaret Snnflamas, 3. Revizyon                    SITC Rev.3            Standard International Trade Classification Revision


        Türkiye Cumhuriyeti Merkez Bankas                                TCMB                  CBRT     Central Bank of the Republic of Turkey

        Devlet Hava Meydanlar        letmesi Genel Müdürlü ü (DHM )      DHM                   DHMI     General Directorate of State Airport Authority

        Uluslararas Para Fonu                                                        IMF                International Monetary Fund

        Ekonomik Kalknma ve         birli i Örgütü                                  OECD                Organisation for Economic Co-operation and Development


        Uluslararas       teki Durum Snflamas, 1993                             ICSE,93              International Classification Of Status In Employment, 1993


        Amaca göre Bireysel Tüketim Snflamas                                     COICOP               Classification of Individual Consumption by Purpose

        Avrupa Hesaplar Sistemi                                                       ESA                Europion System of account

        Avrupa Toplulu unda Ekonomik Faaliyetlerin        statistiki               NACE Rev.1            Statistical Classification of Economic Activities in the
        Snflamas                                                                                      European Community

        Ulusal Hesaplar Sistemi                                                       SNA                System of National Accounts


        NOT                                                                                              NOTE
        1.     Kayna  belirtilmeyen tablolardaki veriler, Türkiye                                       1.    The data in tables in which the source is not
         statistik Kurumu’na aittir.                                                                     indicated, are provided by TurkStat.
        2. Tablolarda ve emalarda rakamlar yuvarlamadan dolay                                           2. Total figures in tables and schemes may not be exact
        toplam vermeyebilir.                                                                            due to rounding.
        3.   Ayrca belirtilmedikçe ölçü birimleri metrik sisteme                                        3.     Unless  otherwise    designated   all  units   of
        göredir.                                                                                         measurement are given in the framework of the     metric
                                                                                                         system.
        4. 01.01.2009 tarihinden itibaren YTL ifadesi TL olarak                                          4. From 01.01.2009, TRY expression is changed as TL.
        de i mi tir.


VI     TÜİK, Ekonomik Göstergeler, II. Dönem 2012
       TurkStat, Economic Indicators, Quarter II 2012
Turkish Economy	                                                                                                            Türkiye Ekonomisi

Ulusal hesaplar                                                             National accounts

Üretim yönünden GSYH 2012 ylnn ikinci döneminde bir önceki yln         In production based approach GDP increased by 2,9% at 1998 prices
ayn dönemine göre 1998 fiyatlaryla %2,9, cari fiyatlarla ise %10,3        and increased by 10,3% at current prices in the second quarter of 2012
orannda artm tr. Bu oranlara göre GSYH, 1998 fiyatlaryla                compared to the same quarter of the previous year. Consequently GDP
28 837 597 bin TL, cari fiyatlarla ise 349 630 197 bin TL olarak            was realized as 28 837 597 thousand TL at 1998 prices and 349 630 197
gerçekle mi tir. 1998 fiyatlaryla bir önceki yln ayn dönemine göre      thousand TL at current prices. At 1998 prices, compared to the same
imalat sanayi, toptan ve perakende ticaret, ula trma, depolama ve          quarter of previous year, the increases in manufacturing industry,
haberle me ve in aat sektörlerinde srasyla %3,4, %1,2, %3,9 ve            wholesale and retail trade, transport, storage and communication and
%0,4 oranndaki art lar, 1998 fiyatlaryla GSYH büyüme orann pozitif     construction sectors by 3,4%, 1,2%, 3,9% and 0,4%, respectively,
yönde etkilemi tir.                                                         affected the growth rate of GDP at 1998 prices positively.


                                                          GSYH büyüme hz (1998 fiyatlaryla)
          (%)                                             Growth rate of GDP (at 1998 prices)
                                                          [Üretim yönünden - Production based]
        15


        10


         5


         0
                  I            II          III          IV           I        II            III           IV          I           II

                                    2010                                            2011*                                 2012*


2011 ylnda ki i ba na gayri safi yurtiçi hasla de eri cari fiyatlarla   In 2011 GDP per capita at current prices was estimated as 17 553 TL,
17 553 TL ve ABD dolar cinsinden 10 469 dolar olarak tahmin                and US Dollars 10 469.
edilmi tir.

          Seçilmi ekonomik faaliyetler ve GSYH büyüme hz (1998 fiyatlaryla)
          Growth rate of selected economic activity and GDP (at 1998 prices)
          (Üretim yönünden - Production based)
                                                                                                                                       (%)

                                                                                                                          Gayri safi yurtiçi
                                                                                     Toptan ve           Ula trma,            hasla (Alc
                             Tarm, avclk ve                                      parekende          depolama ve             fiyatlaryla)
                                    ormanclk                                           ticaret        haberle me           Gross domestic
                            Agriculture, hunting        malat sanayi               Wholesale and Transport, storage                  product
                                    and forestry Manufacturing industry              retail trade and communication       (Purchaser's price)
          2010         I                    3,8                     22,0                     21,2                 12,7                  12,6
                      II                    2,8                     15,4                     14,0                 10,4                  10,4
                      III                   0,9                      7,2                      7,5                  6,0                   5,3
                      IV                    4,5                     11,3                     13,4                 13,8                   9,3
          2011*        I                    8,2                     15,1                     18,0                 12,7                  12,1
                      II                    6,5                      9,3                     13,7                 12,1                   9,1
                      III                   4,9                      9,5                     10,6                 11,4                   8,4
                      IV                    5,8                      5,3                      3,2                  6,6                   5,0
          2012*        I                    5,4                      2,8                      0,7                  5,1                   3,3
                      II                    3,5                      3,4                      1,2                  3,9                   2,9


Harcamalar yönünden incelendi inde, 2012 ylnn ikinci döneminde           Taking into account the expenditure approach, it is seen that in the
1998 fiyatlaryla GSYH içinde en büyük bölümü %68,9 ile yerle ik ve         second quarter of 2012, the final consumption expenditure, at 1998
yerle ik olmayan hanehalklarnn yurtiçi tüketiminin olu turdu u            prices, of resident and non-resident households constituted the largest
görülmektedir. Ayn dönemde, alt kalemler arasnda en fazla büyüme          part of the GDP as 68,9%. In the same period the largest growth
%19,8 ile mal ve hizmet ihracat sektöründe gerçekle mi tir. Yine ayn      among the other sub sectors was realized in the exports of goods and
dönemde, mal ve hizmet almlarnda %5,1 ve devletin nihai tüketim           services sector with the percent of 19,8. Again in the same period,
harcamalarnda ise %4,4 orannda art gerçekle mi tir.                      purchases of goods and services increased by 5,1% and Government
                                                                            final consumption expenditure increased by 4,4%.


                                                                                                    TÜİK, Ekonomik Göstergeler, II. Dönem 2012
                                                                                                                                                        
                                                                                                       TurkStat, Economic Indicators, Quarter II 2012
Türkiye Ekonomisi	                                                                                                                                   Turkish Economy


                                                      Tüketim harcamalarnn büyüme hz (1998 fiyatlaryla)
                                                      Growth rate of final consumption expenditures (at 1998 prices)
                                                                                                                                                                      Hanehalkı
                                                              [Harcama yönünden - Expenditure based]
                                                                                                                                                                      Households
                              (%)
                                                                                                                                                                      Kamu-Public
                       16
                                                                                                                                                                           Hanehalkı
                                                                                                                                                                 Hanehalk Households
                       12                                                                                                                                        Households
                                                                                                                                                                           Kamu-Public
                        8                                                                                                                                        Kamu-Public
                        4
                        0
                       -4
                       -8
                                    I       II               III           IV       I         II             III    IV            I                II

                                                  2010                                              2011*                                 2012*


                                             Sabit sermaye yatrmlarnn büyüme hz (1998 fiyatlaryla)
                                             Growth rate of fixed capital investments (at 1998 prices)
                             (%)                        [Harcama yönünden - Expenditure based]                                                                        Kamu-Public
                        60
                                                                                                                                                                      Özel-Private
                        50
                        40                                                                                                                                                Kamu-Public
                        30                                                                                                                                                Özel-Private
                                                                                                                                                                    Kamu-Public
                        20
                                                                                                                                                                    Özel-Private
                        10
                         0
                       -10
                       -20
                                    I        II               III              IV       I      II             III       IV            I                 II

                                                      2010                                           2011*                                 2012*


           Ödemeler dengesi                                                                           Balance of payments

           2012 yl Haziran aynda cari i lemler hesab 4 189 milyon ABD Dolar                      In June 2012 current account deficit was realized as 4 189 million US
           açk vermi tir. Buna göre, 2012 yl ilk alt aynda cari i lemler dengesi                 Dollars. Therefore, current account deficit was realized totally 30 606
           toplam 30 606 milyon ABD Dolar açk vermi tir.                                            millions US Dollars in the first six months of 2012.


                                                                                            Cari i lemler hesab
                                                                                               Current account
                      (Milyar $-Billion $)

                              0

                              -2

                              -4

                              -6

                              -8

                             -10
                                        7         8                 9          10   11         12            1      2         3               4              5           6

                                                                        2011                                                          2012


           2012 yl Haziran aynda, bir önceki yln ayn ay ile kar la trld nda,              In June 2012, compared to the same month of the previous year,
           turizm dengesi %10,7 orannda artm , in aat dengesi ise %-70,8                            tourism balance increased by 10,7% but construction balance
           orannda azalm tr.                                                                       decreased by -70,8%.


           Ayn ayda, do rudan yatrmlarda sermaye çk , portföy yatrmlarnda                    In the same month, there is an outflow in direct investments and inflow
           ise sermaye giri i olmu , sonuç olarak toplamda 355 milyon ABD Dolar                      in portfolio investments, as a result, total financial outflows realized as
           tutarnda finansman çk  gerçekle mi tir.                                                355 million US Dollars.


         TÜİK, Ekonomik Göstergeler, II. Dönem 2012
          TurkStat, Economic Indicators, Quarter II 2012
Turkish Economy	                                                                                                              Türkiye Ekonomisi


          Ödemeler dengesi
          Balance of payments
                                                                                                                      (Milyon $- Million $)

                                     Cari
                                i lemler
                                  hesab     D ticaret                         Yatrm geliri                                     Finans
                                  Current      dengesi              Hizmetler         dengesi                                    hesaplar
                                 account          Trade               dengesi      Investment            Cari transferler         Financial
                                  balance       balance       Services balance income balance            Current transfers         account
          2011       7            - 5 418       - 7 971                 3 060           - 594                         101            4 050
                     8            - 4 026       - 6 905                 3 154           - 491                         230            4 446
                     9            - 6 368       - 8 405                 2 640           - 728                         139            5 265
                    10            - 4 515       - 6 388                 2 302           - 471                          57            3 416
                    11            - 5 424       - 6 235                 1 079           - 351                          99            4 694
                    12            - 6 622       - 6 725                    313          - 594                         401            7 105
          2012       1            - 5 720       - 5 798                    591          - 561                          65            3 431
                     2            - 4 263       - 4 714                    667          - 432                         233            2 654
                     3            - 6 276       - 6 039                    635          - 926                          71            3 789
                     4            - 4 701       - 5 250                 1 148           - 726                         143            5 796
                     5            - 5 457       - 6 965                 1 912           - 475                          88            6 719
                     6            - 4 189       - 5 740                 1 840           - 355                          84            4 728

 Sanayi                                                                               Industry

 2012 yl Haziran aynda toplam sanayi üretimi bir önceki yln ayn ayna          In June 2012, total industry production increased by 3,0%
 göre %3,0 orannda artm , bir önceki aya göre ise %-1,6 orannda                   compared to the same month of the previous year, but decreased
 azalm tr.                                                                         by -1,6% compared to the previous month.


          Aylk sanayi üretim endeksi
          Monthly industrial production index
          [Yllk de i im oran - Annually rate of change]
          [2005=100]
                                                                                                                                       (%)


                                                                                                                  Elektrik, gaz, buhar ve
                                Toplam                                                   malat                  iklimlendirme üretimi ve
                                 sanayi            Madencilik ve                       sanayii                                      da tm
                                   Total             ta ocakçl                 Manufacturing               Electricity, gas, steam and air
                                industry      Mining and quarrying                     industry                           conditioning supply
          2011       7               7,0                         1,2                       7,3                                           7,1
                     8               3,8                        -3,9                       5,0                                          -0,5
                     9              12,1                         2,1                      12,9                                           9,8
                    10               7,5                         8,6                       7,2                                           9,2
                    11               8,5                         2,6                       7,8                                          16,5
                    12               3,7                         6,7                       2,8                                          10,3
          2012       1               1,5                        -2,3                       0,4                                           9,6
                     2               4,4                         6,8                       3,1                                          12,7
                     3               2,6                         3,7                       1,8                                           7,9
                     4               1,5                        -1,7                       1,6                                           2,5
                     5               5,9                         4,2                       5,8                                           7,2
                     6               3,0                         9,4                       1,8                                          10,6


 2012 yl Haziran ay imalat sanayi üretiminde bir önceki yla göre %1,8            In June 2012, manufacturing industry production increased by
 orannda art , bir önceki aya göre ise %-3,1 orannda azal tespit                 1,8% compared to the previous year, but decreased by -3,1%
 edilmi tir.                                                                         compared to the previous month.


 2012 yl Haziran aynda bir önceki yln ayn ayna göre imalat sanayi alt         In June 2012, compared to the same month of the previous year in
 sektörleri arasnda en fazla üretim dü ü ü %-14,9 ile deri ve ilgili ürünlerin      the subsectors of manufacturing industry, the highest production
 imalat sektöründe gözlenirken, en büyük art %23,3 ile a aç, a aç ürünleri         decrease of -14,9% was recorded in manufacture of leather and
 ve mantar ürünleri imalat sektöründe görülmü tür.                                  related products while the highest production increase of 23,3%
                                                                                     was recorded in sector of manufacture of wood and products of
                                                                                     wood and cork.

 2012 yl Haziran aynda imalat sanayinde kapasite kullanm oran toplamda          In June 2012, the capacity utilization rate in manufacturing industry
 %74,6 olarak gerçekle mi tir.                                                       in total realized as 74,6%.


                                                                                                    TÜİK, Ekonomik Göstergeler, II. Dönem 2012
                                                                                                                                                             
                                                                                                       TurkStat, Economic Indicators, Quarter II 2012
Türkiye Ekonomisi	                                                                                                                                                                             Turkish Economy


                                                                                                                   Kapasite kullanm oran
                          (%)                                                                                      Rate of capacity utilization

                               80

                               70

                               60

                               50
                                                                 7           8             9               10          11           12           1           2         3              4            5                6

                                                                                                 2011                                                                      2012


           Bina in aat                                                                                                                     Building construction

           2012 ylnn ikinci döneminde, yeni ve ilave yap says bir önceki yln                                                        In the second quarter of 2012, the number of new buildings and
           ayn dönemine göre %5,4 orannda artarak 28 217 olarak                                                                           additions realized as 28 217 by increasing 5,4% compared to the same
           gerçekle mi tir. Ayn dönemde, tamamen veya ksmen biten yap says                                                             quarter of previous year. In the same quarter, the number of building
           ise geçen yln ayn dönemine göre %-15,1 orannda azalarak 21 631                                                               completed or partially completed decreased to 21 631 with an -15,1%
           olarak gerçekle mi tir.                                                                                                          increment compared to the same quarter of previous year.


           2012 ylnn ikinci döneminde, yapmna ba lanan ve yaplmakta olan                                                              In the second quarter of 2012, the cost of per square meter of
           konutlarn m2 maliyeti bir önceki yln ayn dönemine göre %6,9 artarak                                                          residential buildings of which the construction started and under
           694 TL olarak gerçekle mi tir.                                                                                                   construction realized as 694 TL by increasing 6,9% compared to the
                                                                                                                                            same quarter of the previous year.

                                                                                                             Yeni ve ilave bina in aat
                                                                                                             Construction of new buildings and additions
                                                             (Bin-Tousand)

                                               70
                                               60
                                               50
                                                                                                                                                                                                       Konut-Residential
                                               40
                                                                                                                                                                                                       Di er-Other
                                               30
                                               20
                                               10
                                                     0
                                                                     I           II            III           IV             I        II          III         IV        I              II

                                                                                      2010*             Konut-Residential                 2011* Diğer-Other                2012*
                                                                                                     Konut-Residential                     Diğer-Other
                                                                                                           Konut-Residential                 Diğer-Other
             gücü                                                                                                                           Labour

           2012 ylnn ikinci döneminde istihdam edilenlerin says bir önceki yln                                                       In the second quarter of 2012, number of employed persons increased
           ayn dönemine göre %3,4 artarak 25 282 000 ki i olarak                                                                           by 3,4% and reached to 25 282 000 compared to the same quarter of
           gerçekle mi tir. Ayn dönemde i gücüne katlm oran ise %50,5 olarak                                                            previous year. The labour force participation rate realized as 50,5% in
           gerçekle mi tir.                                                                                                                 the same quarter.

                                                                                                   gücüne katlm ve i sizlik oran
                                                                                                 Labour force participation rate and unemployment rate
                                                      (%)                                                                                                                                               (%)
                                                                                                                                                                                                            19
                          Labour force participation rate


                                                            52
                              gücüne katlm oran


                                                                                                                                                                                                            16
                                                                                                                                                                                                                 Unemployment rate
                                                                                                                                                                                                                    sizlik oran


                                                            50
                                                                                                                                                                                                            13

                                                            48
                                                                                                                                                                                                            10

                                                            46                                                                                                                                              7

                                                            44                                                                                                                                              4
                                                                         I            II             III          IV            I           II         III        IV              I               II

                                                                                           2010                                          2011                                              2012
                                                                                                  İşgücüne katılım oranı-Labour force participation rate
                                                                                              İşgücüne katılım oranı-Labour force participation rate
                                                                                                   İşsizlik oranı-Unemployment rate
                                                                                                      gücüne katlm oran-Labour force participation rate
                                                                                              İşsizlik oranı-Unemployment rate force participation rate
                                                                                                İşgücüne katılım oranı-Labour
                                                                                                      sizlik oran-Unemployment rate
                                                                                                İşsizlik oranı-Unemployment rate

         TÜİK, Ekonomik Göstergeler, II. Dönem 2012
          TurkStat, Economic Indicators, Quarter II 2012
Turkish Economy	                                                                                                                                     Türkiye Ekonomisi


 2012 ylnn ikinci döneminde i sizlerin says %-10,9 azal la                             In the second quarter of 2012, the number of unemployed persons
 2 272 000 olarak tespit edilmi , buna göre i sizlik oran da %8,2                           decreased to 2 272 000 with -10,9% descent and unemployment rate was
 olarak belirlenmi tir.                                                                      realized as 8,2%.
   gücü
 Labour


                                                                                                           gücüne
                                                    15 ve daha                                                dahil                               gücüne
                            Kurumsal             yukar ya taki                                           olmayan                                  katlm
                             olmayan                     nüfus                                               nüfus                                   oran
                                 nüfus               Population               gücü        stihdam             Not in                          Labour force    sizlik oran
                       Non-institutional               15 years              Labour      edilenler           labour         siz               participation Unemployment
                            population                 and over                force     Employed              force Unemployed                        rate           rate

                                                                        Bin - Thousand                                                                    (%)
 2010          I                  71   043                   52   223         24 831          21   267      27   392            3   564                47,5          14,4
              II                  71   239                   52   431         25 901          23   055      26   529            2   846                49,4          11,0
             III                  71   440                   52   645         26 166          23   195      26   478            2   971                49,7          11,4
              IV                  71   642                   52   860         25 665          22   854      27   195            2   811                48,6          11,0
 2011          I                  71   920                   53   152         25 766          22   802      27   386            2   964                48,5          11,5
              II                  72   218                   53   439         26 995          24   445      26   444            2   550                50,5           9,4
             III                  72   523                   53   734         27 406          24   884      26   328            2   521                51,0           9,2
              IV                  72   826                   54   027         26 696          24   267      27   331            2   429                49,4           9,1
 2012          I                  73   254                   54   365         26 058          23   338      28   307            2   721                47,9          10,4
              II                  73   482                   54   599         27 554          25   282      27   044            2   272                50,5           8,2


 Fiyatlar                                                                                    Prices

 2012 yl Haziran aynda tüketici fiyat endeksi (2003=100) aylk                            In June 2012, the consumer price index (2003=100) decreased by -
 bazda %-0,90 orannda dü mü tür. Fiyat de i imine yllk olarak                             0,90% on a monthly base. Considering the annual price changes, it is
 bakld nda, tüketici fiyatlarndaki art n %8,87 oldu u                                  seen that the increase in the consumer prices is 8,87%. In the same
 görülmektedir. Ayn ayda üretici fiyat endeksi (2003=100) aylk                             month, the producer price index (2003=100) decreased by -1,49% on a
 olarak %-1,49 orannda dü ü ve yllk olarak ise %6,44 orannda                             monthly base and increased by 6,44% on an annual basis.
 art göstermi tir.


            (%)                                                                     Aylk enflasyon
                                                                                    Monthly inflation
            4

            3

            2
                                                                                                                                                                TÜFE-CPI
                                                                                                                                                                TÜFE-CPI
            1                                                                                                                                                   ÜFE-PPI
                                                                                                                                                                ÜFE-PPI
            0

            -1

            -2
                   7          8              9          10              11     12        1            2          3          4             5        6

                                                 2011                                                                2012


 12 aylk ortalamalara göre, tüketici fiyatlarndaki art Haziran                            In June 2012, based on the 12 months averages, while the consumer
 2012’de %8,89 düzeyinde gerçekle irken, üretici fiyatlarnda                                price index increased by 8,89%, the producer price index increased by
 %10,24 olmu tur.                                                                            10,24%.

 2012 yl Haziran aynda tüketici fiyatlarnda bir önceki aya göre en                       In June 2012, the highest decrease in consumer prices compared to the
 fazla dü ü %-3,42 ile gda ve alkolsüz içecekler alt grubunda                               previous month was recorded in the food and non-alcoholic beverages
 meydana gelmi tir.                                                                          sub-group as -3,42%.

 Üretici fiyat endeksi sektörler ayrmnda incelendi inde, 2012 yl                         Taking into account the producer price index in terms of sectors, it is seen
 Haziran aynda bir önceki aya göre Elektrik, gaz ve su sektörü                              that in June 2012, 1,72% increase was recorded in electricity, gas and
 %1,72 orannda artm tr. Tarm sektörü, malat sanayi sektörü ve                            water sector compared to the previous month. The prices decreased by
 Madencilik ve ta ocakçl  sektöründe ise srasyla %-6,12, %-0,75,                        -6,12%, -0,75%, -0,55% in agriculture sector, in manufacturing industry
 ve %-0,55 orannda fiyat dü ü ü gerçekle mi tir.                                            sector and in mining and stone quarrying sector, respectively.


                                                                                                                       TÜİK, Ekonomik Göstergeler, II. Dönem 2012
                                                                                                                                                                             
                                                                                                                          TurkStat, Economic Indicators, Quarter II 2012
Türkiye Ekonomisi	                                                                                                                        Turkish Economy


                       (%)
                                                                                   Yllk enflasyon
                                                                                    Annual inflation
                  15

                  12
                                                                                                                                                          TÜFE-CPI
                                                                                                                                                           TÜFE-CPI
                                                                                                                                                       TÜFE-CPI
                                                                                                                                                         ÜFE-PPI
                                                                                                                                                           ÜFE-PPI
                   9
                                                                                                                                                       ÜFE-PPI
                   6

                   3

                   0
                             7       8         9          10        11        12          1         2         3           4           5       6

                                                   2011                                                            2012


           D ticaret                                                                               Foreign trade

           2012 yl Haziran aynda ihracat bir önceki yln ayn ayna göre %16,7                  In June 2012, compared to the same month of the previous year,
           artarak 13 247 milyon ABD Dolarna yükselmi , ithalat ise %-5,4                          export increased to 13 247 million US Dollars and import decreased to
           azalarak 20 437 milyon ABD Dolarna dü mü tür. Böylece d ticaret                        20 437 million US Dollars by ascending 16,7% and -5,4%, respectively.
           dengesi 7 190 milyon ABD Dolar açk vermi , ihracatn ithalat kar lama                Consequently, foreign trade deficit realized as 7 190 million US Dollars
           oran ise %64,8’ e yükselmi tir.                                                         and the rate of import covered by export increased to 64,8%.


                                                                                    D ticaret
                    (Milyar $-Billion $)                                           Foreign trade
                       24

                       18

                       12

                       6

                       0

                       -6

                    -12
                                 7         8       9           10        11        12           1         2           3           4       5        6

                                                       2011                                                              2012*
                                                           hracat-Exports               thalat-Imports            Denge-Balance

                                                          İhracat-Exports
                                                           İhracat-Exports          İthalat-Imports
                                                                                      İthalat-Imports             Denge-Balance
                                                                                                                   Denge-Balance


            hracat içinde en büyük paya sahip olan imalat sanayii ürünleri ihracat                 In June 2012, compared to the same month of the previous year,
           2012 yl Haziran aynda geçen yln ayn ayna göre %16,3 artarak                       export of manufacturing industrial products, which has the largest
           12 478 milyon ABD Dolarna yükselmi tir. Ayn ayda %28,9 art la tarm                   share in total export, rised to 12 478 million US Dollars with an 16,3%
           ve ormanclk ürünleri ihracat 391 milyon ABD Dolarna, madencilik ve                   increase. In the same month, the agricultural and forestry products
           ta ocakçl  ürünleri ihracat ise %29,1 orannda art la 322 milyon ABD                exports increased to 391 million US Dollars by ascending 28,9%, and
           Dolarna yükselmi tir.                                                                   mining and quarrying products exports rised to 322 million US Dollars
                                                                                                    with an increase of 29,1%.

           2012 yl Haziran aynda bir önceki yln ayn ayna göre sermaye mallar                In June 2012, compared to the same month of previous year, the
           ithalat %-30,7, tüketim mallar ithalat %-20,2 orannda azalm , ara                   imports of capital goods and the consumption goods decreased by
           mallar ithalat ise %3,3 orannda artm tr.                                            -30,7% and -20,2%, respectively, while the intermediate goods
                                                                                                    increased by 3,3%.

           2012 yl Haziran aynda AB ülkelerine yaplan ihracat ve ithalatn toplam               In June 2012, the shares of the exports and imports to and from the EU
           içindeki paylar srasyla %37,1 ve %35,8’dir. Ayn ayda, geçen yln ayn               countries were 37,1% and 35,8% in total respectively. Exports to EU
           ayna göre bu ülkelere yaplan ihracat %-10,2 orannda, ithalat ise %-                   countries decreased by -10,2% and imports from these countries
           16,1 orannda azalm tr.                                                                decreased by -16,1% compared to the same month of the previous
                                                                                                    year.


         TÜİK, Ekonomik Göstergeler, II. Dönem 2012
          TurkStat, Economic Indicators, Quarter II 2012
Turkish Economy	                                                                                                                            Türkiye Ekonomisi

    D ticaret
    Foreign trade
                                                                                                                                 (Milyon $- Million $)


                                                                                             D    ticaret           hracatn ithalat kar lama
                                                                                                 dengesi                                    oran
                                  hracat                          thalat                        Balance of      Rate of imports covered by exports
                                  Exports                        Imports                     foreign trade                                   (%)
    2011       7                  11   860                        21   061                          -9 201                                   56,3
               8                  11   245                        19   679                          -8 434                                   57,1
               9                  10   751                        21   204                        -10 453                                    50,7
              10                  11   907                        19   919                          -8 012                                   59,8
              11                  11   079                        18   649                          -7 571                                   59,4
              12                  12   477                        20   594                          -8 116                                   60,6
    2012*      1                  10   350                        17   376                          -7 026                                   59,6
               2                  11   750                        17   720                          -5 970                                   66,3
               3                  13   211                        20   600                          -7 389                                   64,1
               4                  12   634                        19   273                          -6 639                                   65,6
               5                  13   139                        21   750                          -8 611                                   60,4
               6                  13   247                        20   437                          -7 190                                   64,8


    Brüt d borç                                                                       Gross external debt

    Türkiye brüt d borç stoku 2012 ylnn ikinci döneminde 323 472                   In the second quarter of 2012, external debt stock of Turkey
    milyon ABD Dolar olarak gerçekle mi tir. Bunun 224 461 milyon                     realized as 323 472 million US Dollars. 224 461 million US Dollars
    ABD Dolar uzun vadeli, 99 011 milyon ABD Dolar ise ksa vadeli                   of this amount was long term, and remaining 99 011 million US
    borçlardan olu maktadr.                                                           Dollars was short term debt.

                     (Milyar $-
                                                                     Brüt d borç stoku
                      Billion $)
                                                                   Gross external debt stock
                    320


                    240


                    160


                    80


                     0
                              I              II          III        IV            I     II           III         IV          I           II

                                                  2010                                        2011                                2012

                                                          Uzun vadeli-Long term                   Ksa vadeli-Short term
                                                    Uzun vadeli-Long term                     Kısa vadeli-Short term

    Bu dönemde, uzun vadeli borçlarn toplam brüt borç stoku içindeki                  In this period, the share of long term debt in total gross external
    pay %69,4, ksa vadeli borçlarn pay ise %30,6’ dr.                             debt stock was 69,4% and that of short term was 30,6%.


    Brüt d borç stoku
    Gross external debt stock
                                                                                                                                              (Milyon $- Million $)
                          Türkiye brüt                                   Uzun vadeli
                              d borç                                     Long term

                                Gross                                                                         Özel sektör
                      external debt of             Toplam          Kamu sektörü                      TCMB          Private                            Ksa vadeli
                               Turkey                Total           Public sector                    CBRT          sector                             Short term
    2010        I             268      039         214   177               80 344                  10   876      122 956                                   53 862
               II             266      167         205   823               79 239                   9   873      116 711                                   60 344
              III             284      247         216   270               84 426                  10   687      121 157                                   67 977
               IV             292      222         214   753               84 786                  10   251      119 716                                   77 469
    2011        I             302      449         225   783               88 671                  10   633      126 479                                   76 666
               II             314      655         230   305               89 625                  10   528      130 152                                   84 350
              III             313      960         225   430               87 628                   9   270      128 531                                   88 530
               IV             306      704         222   857               87 268                   8   430      127 159                                   83 847
    2012        I             318      669         228   407               90 411                   8   419      129 577                                   90 262
               II             323      472         224   461               89 482                   7   559      127 420                                   99 011


                                                                                                               TÜİK, Ekonomik Göstergeler, II. Dönem 2012
                                                                                                                                                                      
                                                                                                                  TurkStat, Economic Indicators, Quarter II 2012
Türkiye Ekonomisi	                                                                                                          Turkish Economy


           2012 ylnn ikinci döneminde uzun vadeli brüt d borç stokunun           In the second quarter of 2012, the amount of 89 482 million US Dollars
           89 482 milyon ABD Dolarlk ksm (%39,9) kamu kesimine, 7 559             (39,9%) of the total long term gross external debt stock was due to
           milyon ABD dolarlk ksm Merkez Bankasna (%3,4), 127 420 milyon         public sector, 7 559 million US Dollars (3,4%) was due to Central Bank
           ABD Dolarlk (%56,8) ksm ise özel kesime aittir.                        and 127 420 million US Dollars (56,8%) was due to private sector.


           Bütçe                                                                     Budget

           2012 yl Haziran aynda bütçe gelirleri 158 300 milyon TL’ye, bütçe      In June 2012, total budget revenues rose to 158 300 million TL, and
           harcamalar ise 165 696 milyon TL’ye ula m tr. Kümülatif olarak         budget expenditures reached to 165 696 million TL. Total budget deficit
           bütçe 7 397 milyon TL açk vermi tir.                                     realized as 7 397 million TL.


                                                                         Bütçe dengesi
                          (Milyar TL-                                    Budget balance
                           Billion TL)
                         5

                         0

                        -5

                       -10

                       -15

                       -20
                                7        8        9           10    11       12      1            2    3           4       5        6

                                                      2011*                                                2012*


           2012 ylnn ikinci döneminde bütçe dengesinin GSYH’ye oran ise          In the second quarter of 2012, the ratio of budget balance to GDP was
           %-0,1’dir.                                                                -0,1%.


           2012 yl Haziran aynda, toplam vergi gelirleri içinde dolaysz          In June 2012, while the share of indirect taxes and direct taxes in total
           vergilerin pay %34,1 ve dolayl vergilerin pay %65,9 olurken,           tax revenues were 34,1% and 65,9%, respectively, the tax revenues in
           Haziran ayna ait vergi gelirleri geçen yln ayn ayna göre %6,9        the month of June increased by 6,9% compared to the same month of
           orannda artm tr.                                                       the previous year.


                     Bütçe
                     Budget
                                                                                                        (Milyon TL-Million TL)

                                                       Gelirler                    Harcamalar                      Bütçe dengesi
                                                      Revenues                      Expenditure                    Budget balance
                     2011*        7                    162    393                         166   261                        -3 868
                                  8                    194    134                         193   792                           341
                                                      215    516                         215   672                         - 157
                                 10                    237    435                         242   065                        -4 630
                                 11                    265    829                         267   781                        -1 952
                                 12                    287    909                         306   400                       -18 491
                     2012*        1                     27    648                          25   971                         1 677
                                  2                     54    440                          57   668                        -3 228
                                                       75    311                          82   302                        -6 991
                                  4                    104    447                         109   864                        -5 418
                                                      134    424                         136   390                        -1 966
                                  6                    158    300                         165   696                        -7 397


           2012 ylnn ikinci döneminde vergi yükü (vergi gelirleri/GSYH) %19,1     In the second quarter of 2012, tax burden which is the percentage ratio
           olarak gerçekle mi tir                                                    of tax revenues to GDP realized as 19,1%.


           2012 yl Haziran aynda personel harcamalarnn bütçe harcamalar        In June 2012, the share of personnel expenditures and share of interest
           içindeki pay %23,0, faiz ödemelerinin pay ise %15,8 olarak              payments in budget expenditures observed as 23,0% and 15,8%
           gerçekle mi tir.                                                          respectively.


         TÜİK, Ekonomik Göstergeler, II. Dönem 2012
          TurkStat, Economic Indicators, Quarter II 2012
Turkish Economy	                                                                                                                                  Türkiye Ekonomisi


 Para ve banka                                                                                 Money and banking

 2012 yl Haziran aynda para arz M1 geçen yla göre %0,9 orannda                           In June 2012, money supply M1 increased by 0,9% compared to the
 art la 142 242 milyon TL’ ye yükselmi tir. Ayn ayda M2 %5,5                                 previous year and rose to 142 242 million TL. In the same month, M2
 artarak 673 406 milyon TL’ye ve M3 %7,1 artarak 720 377 milyon                                increased by 5,5% and rose to 673 406 million TL and M3 increased
 TL'ye çkm tr.                                                                              by 7,1% and rose to 720 377 million TL.

                                                               Para arz ve ÜFE (aylk de i im oran)
                                                            Money supply and PPI (monthly percentage change)
                       (%)
                       3
                       2
                       1
                       0
                      -1
                      -2
                                7         8         9            10     11           12             1       2          3          4          5           6

                                                          2011                                                             2012


                                                                                M2             M3         ÜFE

 Ayn ayda döviz tevdiat hesab, bir önceki yla göre %18,4 orannda                           In the same month, foreign exchange deposit accounts was recorded
 artarak 196 395 milyon TL olarak izlenmi tir.                                                 as 196 395 million TL with 18,4% increase compared to the previous
                                                                                               year.

 2012 yl Haziran aynda dola mdaki para 51 887 milyon TL’ye                                 In June 2012, currency in circulation increased by 3,2% and reached
 yükselmi tir. Bu rakam geçen yla göre %3,2 orannda bir art  ifade                         to 51 887 million TL, compared to the same month of previous year.
 etmektedir.

 1 yllk vadeli tasarruf mevduat faiz oran 2011 yl Haziran aynda                         At the end of June 2012, annual timed saving deposit interest rate
 %14,8 iken, 2012 yl Haziran ay sonunda %16,1’e yükselmi tir.                               increased to 16,1% while in June 2011 it was %14,8.


 Parasal göstergeler
 Monetary indicators
                                                                                                                                                       (Milyon TL-Million TL)
                                                    2011                                                                                  2012
                               7          8          9           10       11              12                    1          2          3            4              5         6
 M1                    138 180       145 057    145 827    151 239    142 288    136 237                133 158     135 183    132 295      136 363          142 740   142 242
 M2                    644 249       648 253    654 290    657 806    651 527    655 523                646 026     649 974    657 482      660 362          673 038   673 406
 M3                    681 089       685 529    689 720    694 247    688 687    693 069                684 859     688 703    696 645      702 395          715 010   720 377

 Dola mdaki para
 Currency in
 circulation               51 387     54 084     51 844      58 118    51 005        49 408              47 903      47 215     48 749       49 096           49 602    51 887
 Merkez Bankas
 paras
 Central Bank money
 stock                     77 445     75 311     71 961      62 218    60 990        53 154              43 767      45 538     46 488       53 276           55 116    56 543


                      Parasal büyüklükler
                      Monetary aggregates (1)
                      [Yllk de i im oran]
                      [Yearly percentage change]
                                                                                                                                                 (%)

                                    Ay- Month                             M1                                M2                                    M3
                       2011               7                              13,0                              10,7                                  11,5
                                          8                              13,7                               9,0                                   9,8
                                          9                               8,6                               7,8                                   8,2
                                         10                              12,2                               6,5                                   7,3
                                         11                               5,8                               2,6                                   3,3
                                         12                             -11,6                              -1,8                                  -0,9
                       2012               1                              -3,6                              -0,6                                  -0,1
                                          2                              -2,9                              -1,3                                  -0,6
                                          3                              -7,0                              -0,6                                   0,3
                                          4                              -3,9                              -0,8                                   0,1
                                          5                              -2,2                              -0,9                                  -0,2
                                          6                              -5,5                              -1,0                                   0,6

                      (1) ÜFE (2003=100) ile deflate edilmi tir.                               (1) Figures are deflated using PPI (2003=100)


                                                                                                                    TÜİK, Ekonomik Göstergeler, II. Dönem 2012
                                                                                                                                                                                 
                                                                                                                       TurkStat, Economic Indicators, Quarter II 2012
National Accounts	                                                                                                       Ulusal Hesaplar


                           Ç NDEK LER                                                              CONTENTS

                                                                  Sayfa
                                                                  Page

   1. Tanm ve Kavramlar                                           13      1. Definitions and Concepts

   2. ekil                                                                  2. Figures

  1.1 2012 ylnn ikinci dönemine ait GSYH                        14     1.1 GDP in the second quarter of 2012 (production based)
      (üretim yöntemi)

  1.2 2012 ylnn ikinci dönemine ait GSYH                        15     1.2 GDP in the second quarter of 2012 (expenditure based)
      (harcama yöntemi)

  1.3 Yerle ik ve yerle ik olmayan hanehalklarnn 2012 ylnn    16     1.3 Shares of final consumption expenditures of resident and
      ikinci dönemine ait yurtiçi tüketim paylar                             non-resident households on the economic territory in the
      (1998 fiyatlaryla, COICOP)                                             second quarter of 2012 (at 1998 prices, COICOP)


   3. Grafik                                                                3. Graphics

  1.1 GSYH geli me hz (1998 fiyatlaryla)                        34      1.1 GDP growth rate (at 1998 prices)

  1.2 Ki i ba na gayri safi yurtiçi hasla (Cari fiyatlarla)      34      1.2 Gross domestic product per capita (In current prices)

  1.3 ktisadi faaliyetlerin GSYH içindeki paylar                  35      1.3 Shares of economic activities in GDP
     (1998 fiyatlaryla)                                                       (at 1998 prices)

  1.4 Ba lca iktisadi faaliyetlerin geli me hzlar               35      1.4 Growth rates of main economic activities
      (1998 fiyatlaryla)                                                      (at 1998 prices)

  1.5 ktisadi faaliyetlerin GSYH büyüme hzna katklar           35      1.5 Contribution of economic activities to growth rates of GDP
     (1998 fiyatlaryla)                                                       (at 1998 prices)

  1.6 Harcama kalemlerinin GSYH içindeki paylar                   44      1.6 Shares of expenditure types in GDP
      (1998 fiyatlaryla)                                                      (at 1998 prices)

  1.7 Yatrm, hanehalk ve hükümet harcamalarnn geli me         44      1.7 Growth rates of investment, households and government
      hzlar (1998 fiyatlaryla)                                              expenditures (at 1998 prices)

  1.8 Harcama kalemlerinin GSYH büyüme hzna katklar            44      1.8 Contribution of expenditure types to growth rates of GDP
      (1998 fiyatlaryla)                                                      (at 1998 prices)


  1.9 Harcama türlerinin hanehalk harcamalar içindeki paylar    51      1.9 Shares of expenditure types in households expenditures
      (1998 fiyatlaryla)                                                      (at 1998 prices)


 1.10 Ba lca harcama türlerinin geli me hzlar                   51     1.10 Growth rates of main expenditure types
      (1998 fiyatlaryla)                                                      (at 1998 prices)

 1.11 Cari i lemler hesab                                         59     1.11 Current account


 1.12 Ödemeler Dengesi                                             59     1.12 Balance of Payments

   4. Tablo                                                                 4. Tables


  1.1 GSYH ve GSYH deflatörünün geli me hzlar                    17      1.1 Growth rates of GDP and GDP deflator

  1.2 Ki i ba na gayri safi yurtiçi hasla                        17      1.2 Per capita gross domestic product

  1.3 ktisadi faaliyet kollarna göre GSYH (cari fiyatlarla)       18      1.3 GDP by economic activities (at current prices)

  1.4 ktisadi faaliyet kollarnn GSYH içindeki paylar            20      1.4 Shares of economic activities in GDP
     (cari fiyatlarla)                                                         (at current prices)

  1.5 ktisadi faaliyet kollarna göre GSYH geli me hzlar         22      1.5 Growth rate of GDP by economic activities
     (cari fiyatlarla)                                                         (at current prices)

  1.6 ktisadi faaliyet kollarnn GSYH geli me hzna katklar    24      1.6 Contribution of economic activites of growth rate of GDP
     (cari fiyatlarla)                                                         (at current prices)


                                                                                          TÜİK, Ekonomik Göstergeler, II. Dönem 2012
                                                                                                                                              11
                                                                                             TurkStat, Economic Indicators, Quarter II 2012
Ulusal Hesaplar	                                                                                                 National Accounts


             1.7 ktisadi faaliyet kollarna göre GSYH (1998 fiyatlaryla)      26    1.7 GDP by economic activities (at 1998 prices)


             1.8 ktisadi faaliyet kollarnn GSYH içindeki paylar             28    1.8 Shares of economic activities in GDP
                (1998 fiyatlaryla)                                                      (at 1998 prices)

             1.9 ktisadi faaliyet kollarna göre GSYH geli me hzlar          30    1.9 Growth rate of GDP by economic activities
                (1998 fiyatlaryla)                                                      (at 1998 prices)

            1.10 ktisadi faaliyet kollarnn GSYH geli me hzna katklar     32   1.10 Contribution of economic activites to growth rate of GDP
                (1998 fiyatlaryla)                                                      (at 1998 prices)

            1.11 Harcama kalemlerine göre GSYH (cari fiyatlarla)               36   1.11 GDP by expenditure types (at current prices)

            1.12 Harcama kalemlerinin GSYH içindeki paylar                    37   1.12 Shares of expenditure types in GDP
                 (cari fiyatlarla)                                                       (at current prices)

            1.13 Harcama kalemlerine göre GSYH geli me hzlar                 38   1.13 Growth rates of GDP by expenditure types
                 (cari fiyatlarla)                                                       (at current prices)

            1.14 Harcama kalemlerinin GSYH geli me hzna katklar            39   1.14 Contribution of expenditure types to growth rates of GDP
                 (cari fiyatlarla)                                                       (at current prices)

            1.15 Harcama kalemlerine göre GSYH (1998 fiyatlaryla)             40   1.15 GDP by expenditure types (at 1998 prices)

            1.16 Harcama kalemlerinin GSYH içindeki paylar                    41   1.16 Shares of expenditure types in GDP
                 (1998 fiyatlaryla)                                                     (at 1998 prices)

            1.17 Harcama kalemlerine göre GSYH geli me hzlar                 42   1.17 Growth rates of GDP by expenditure types
                 (1998 fiyatlaryla)                                                     (at 1998 prices)

            1.18 Harcama kalemlerinin GSYH geli me hzna katklar            43   1.18 Contribution of expenditure types to growth rates of GDP
                 (1998 fiyatlaryla)                                                     (at 1998 prices)

            1.19 Yerle ik ve yerle ik olmayan hanehalklarnn yurtiçi          45   1.19 Final consumption expenditure of resident and non-resident
                 tüketimi (cari fiyatlarla)                                              households on the economic territory (at current prices)


            1.20 Harcama türlerinin yerle ik ve yerle ik             olmayan   46   1.20 Shares of expenditure types in final consumption
                 hanehalklarnn yurtiçi tüketimi içindeki paylar                       expenditure of resident and non-resident households on the
                 (cari fiyatlarla)                                                       economic territory (at current prices)
            1.21 Yerle ik ve yerle ik olmayan hanehalklarnn yurtiçi          47   1.21 Growth rates of final consumption expenditure of resident
                 tüketimi geli me hzlar (cari fiyatlarla)                              and non-resident households on the economic territory
                                                                                         (at current prices)
            1.22 Yerle ik ve yerle ik olmayan hanehalklarnn yurtiçi          48   1.22 Final consumption expenditure of resident and non-resident
                 tüketimi (1998 fiyatlaryla)                                            households on the economic territory (at 1998 prices)

            1.23 Harcama türlerinin yerle ik ve yerle ik             olmayan   49   1.23 Shares of expenditure types in final consumption
                 hanehalklarnn yurtiçi tüketimi içindeki paylar                       expenditure of resident and non-resident households on the
                 (1998 fiyatlaryla)                                                     economic territory (at 1998 prices)
            1.24 Yerle ik ve yerle ik olmayan hanehalklarnn yurtiçi          50   1.24 Growth rates of final consumption expenditure of resident
                 tüketimi geli me hzlar (1998 fiyatlaryla)                            and non-resident households on the economic territory
                                                                                         (at 1998 prices)
            1.25 Ödemeler bilançosu                                            52   1.25 Balance of payments
            1.26 Cari i lemler hesab                                          53   1.26 Current account

            1.27 Sermaye ve finans hesaplar                                   56   1.27 Capital and financial accounts

            1.28 Rezerv varlklar                                              58   1.28 Reserve assets


    12     TÜİK, Ekonomik Göstergeler, II. Dönem 2012
           TurkStat, Economic Indicators, Quarter II 2012
Tuik - Turkish Economic Indicators, may 2012 (TR-ENG)

Contenu connexe

En vedette

2024 State of Marketing Report – by Hubspot
2024 State of Marketing Report – by Hubspot2024 State of Marketing Report – by Hubspot
2024 State of Marketing Report – by HubspotMarius Sescu
 
Everything You Need To Know About ChatGPT
Everything You Need To Know About ChatGPTEverything You Need To Know About ChatGPT
Everything You Need To Know About ChatGPTExpeed Software
 
Product Design Trends in 2024 | Teenage Engineerings
Product Design Trends in 2024 | Teenage EngineeringsProduct Design Trends in 2024 | Teenage Engineerings
Product Design Trends in 2024 | Teenage EngineeringsPixeldarts
 
How Race, Age and Gender Shape Attitudes Towards Mental Health
How Race, Age and Gender Shape Attitudes Towards Mental HealthHow Race, Age and Gender Shape Attitudes Towards Mental Health
How Race, Age and Gender Shape Attitudes Towards Mental HealthThinkNow
 
AI Trends in Creative Operations 2024 by Artwork Flow.pdf
AI Trends in Creative Operations 2024 by Artwork Flow.pdfAI Trends in Creative Operations 2024 by Artwork Flow.pdf
AI Trends in Creative Operations 2024 by Artwork Flow.pdfmarketingartwork
 
PEPSICO Presentation to CAGNY Conference Feb 2024
PEPSICO Presentation to CAGNY Conference Feb 2024PEPSICO Presentation to CAGNY Conference Feb 2024
PEPSICO Presentation to CAGNY Conference Feb 2024Neil Kimberley
 
Content Methodology: A Best Practices Report (Webinar)
Content Methodology: A Best Practices Report (Webinar)Content Methodology: A Best Practices Report (Webinar)
Content Methodology: A Best Practices Report (Webinar)contently
 
How to Prepare For a Successful Job Search for 2024
How to Prepare For a Successful Job Search for 2024How to Prepare For a Successful Job Search for 2024
How to Prepare For a Successful Job Search for 2024Albert Qian
 
Social Media Marketing Trends 2024 // The Global Indie Insights
Social Media Marketing Trends 2024 // The Global Indie InsightsSocial Media Marketing Trends 2024 // The Global Indie Insights
Social Media Marketing Trends 2024 // The Global Indie InsightsKurio // The Social Media Age(ncy)
 
Trends In Paid Search: Navigating The Digital Landscape In 2024
Trends In Paid Search: Navigating The Digital Landscape In 2024Trends In Paid Search: Navigating The Digital Landscape In 2024
Trends In Paid Search: Navigating The Digital Landscape In 2024Search Engine Journal
 
5 Public speaking tips from TED - Visualized summary
5 Public speaking tips from TED - Visualized summary5 Public speaking tips from TED - Visualized summary
5 Public speaking tips from TED - Visualized summarySpeakerHub
 
ChatGPT and the Future of Work - Clark Boyd
ChatGPT and the Future of Work - Clark Boyd ChatGPT and the Future of Work - Clark Boyd
ChatGPT and the Future of Work - Clark Boyd Clark Boyd
 
Getting into the tech field. what next
Getting into the tech field. what next Getting into the tech field. what next
Getting into the tech field. what next Tessa Mero
 
Google's Just Not That Into You: Understanding Core Updates & Search Intent
Google's Just Not That Into You: Understanding Core Updates & Search IntentGoogle's Just Not That Into You: Understanding Core Updates & Search Intent
Google's Just Not That Into You: Understanding Core Updates & Search IntentLily Ray
 
Time Management & Productivity - Best Practices
Time Management & Productivity -  Best PracticesTime Management & Productivity -  Best Practices
Time Management & Productivity - Best PracticesVit Horky
 
The six step guide to practical project management
The six step guide to practical project managementThe six step guide to practical project management
The six step guide to practical project managementMindGenius
 
Beginners Guide to TikTok for Search - Rachel Pearson - We are Tilt __ Bright...
Beginners Guide to TikTok for Search - Rachel Pearson - We are Tilt __ Bright...Beginners Guide to TikTok for Search - Rachel Pearson - We are Tilt __ Bright...
Beginners Guide to TikTok for Search - Rachel Pearson - We are Tilt __ Bright...RachelPearson36
 

En vedette (20)

2024 State of Marketing Report – by Hubspot
2024 State of Marketing Report – by Hubspot2024 State of Marketing Report – by Hubspot
2024 State of Marketing Report – by Hubspot
 
Everything You Need To Know About ChatGPT
Everything You Need To Know About ChatGPTEverything You Need To Know About ChatGPT
Everything You Need To Know About ChatGPT
 
Product Design Trends in 2024 | Teenage Engineerings
Product Design Trends in 2024 | Teenage EngineeringsProduct Design Trends in 2024 | Teenage Engineerings
Product Design Trends in 2024 | Teenage Engineerings
 
How Race, Age and Gender Shape Attitudes Towards Mental Health
How Race, Age and Gender Shape Attitudes Towards Mental HealthHow Race, Age and Gender Shape Attitudes Towards Mental Health
How Race, Age and Gender Shape Attitudes Towards Mental Health
 
AI Trends in Creative Operations 2024 by Artwork Flow.pdf
AI Trends in Creative Operations 2024 by Artwork Flow.pdfAI Trends in Creative Operations 2024 by Artwork Flow.pdf
AI Trends in Creative Operations 2024 by Artwork Flow.pdf
 
Skeleton Culture Code
Skeleton Culture CodeSkeleton Culture Code
Skeleton Culture Code
 
PEPSICO Presentation to CAGNY Conference Feb 2024
PEPSICO Presentation to CAGNY Conference Feb 2024PEPSICO Presentation to CAGNY Conference Feb 2024
PEPSICO Presentation to CAGNY Conference Feb 2024
 
Content Methodology: A Best Practices Report (Webinar)
Content Methodology: A Best Practices Report (Webinar)Content Methodology: A Best Practices Report (Webinar)
Content Methodology: A Best Practices Report (Webinar)
 
How to Prepare For a Successful Job Search for 2024
How to Prepare For a Successful Job Search for 2024How to Prepare For a Successful Job Search for 2024
How to Prepare For a Successful Job Search for 2024
 
Social Media Marketing Trends 2024 // The Global Indie Insights
Social Media Marketing Trends 2024 // The Global Indie InsightsSocial Media Marketing Trends 2024 // The Global Indie Insights
Social Media Marketing Trends 2024 // The Global Indie Insights
 
Trends In Paid Search: Navigating The Digital Landscape In 2024
Trends In Paid Search: Navigating The Digital Landscape In 2024Trends In Paid Search: Navigating The Digital Landscape In 2024
Trends In Paid Search: Navigating The Digital Landscape In 2024
 
5 Public speaking tips from TED - Visualized summary
5 Public speaking tips from TED - Visualized summary5 Public speaking tips from TED - Visualized summary
5 Public speaking tips from TED - Visualized summary
 
ChatGPT and the Future of Work - Clark Boyd
ChatGPT and the Future of Work - Clark Boyd ChatGPT and the Future of Work - Clark Boyd
ChatGPT and the Future of Work - Clark Boyd
 
Getting into the tech field. what next
Getting into the tech field. what next Getting into the tech field. what next
Getting into the tech field. what next
 
Google's Just Not That Into You: Understanding Core Updates & Search Intent
Google's Just Not That Into You: Understanding Core Updates & Search IntentGoogle's Just Not That Into You: Understanding Core Updates & Search Intent
Google's Just Not That Into You: Understanding Core Updates & Search Intent
 
How to have difficult conversations
How to have difficult conversations How to have difficult conversations
How to have difficult conversations
 
Introduction to Data Science
Introduction to Data ScienceIntroduction to Data Science
Introduction to Data Science
 
Time Management & Productivity - Best Practices
Time Management & Productivity -  Best PracticesTime Management & Productivity -  Best Practices
Time Management & Productivity - Best Practices
 
The six step guide to practical project management
The six step guide to practical project managementThe six step guide to practical project management
The six step guide to practical project management
 
Beginners Guide to TikTok for Search - Rachel Pearson - We are Tilt __ Bright...
Beginners Guide to TikTok for Search - Rachel Pearson - We are Tilt __ Bright...Beginners Guide to TikTok for Search - Rachel Pearson - We are Tilt __ Bright...
Beginners Guide to TikTok for Search - Rachel Pearson - We are Tilt __ Bright...
 

Tuik - Turkish Economic Indicators, may 2012 (TR-ENG)

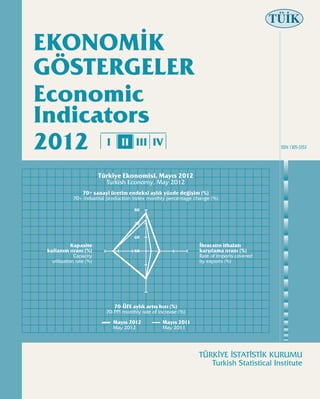
  • 1. TÜİK TÜİK EKONOMİK EKONOMİK GÖSTERGELER GÖSTERGELER Economic Economic Indicators Indicators 2012 I II III IV ISSN 1305-3353 2012 I II III IV ISSN 1305-3353 Türkiye Ekonomisi, Mayıs 2012 Türkiye Ekonomisi, Mayıs 2012 Turkish Economy, May 2012 Turkish Economy, May 2012 70+ sanayi üretim endeksi aylık yüzde değişim (%) 70+ sanayi üretim endeksi aylık yüzde değişim (%) 70+ industrial production index monthly percentage change (%) 70+ industrial production index monthly percentage change (%) 80 80 70 70 60 60 Kapasite İhracatın ithalatı Kapasite İhracatın ithalatı kullanım oranı (%) 50 karşılama oranı (%) kullanım oranı (%) 50 karşılama oranı (%) Capacity Rate of imports covered Capacity Rate of imports covered utilization rate (%) by exports (%) utilization rate (%) by exports (%) 70-ÜFE aylık artış hızı (%) 70-ÜFE aylık artış hızı (%) 70-PPI monthly rate of increase (%) 70-PPI monthly rate of increase (%) Mayıs 2012 Mayıs 2011 Mayıs 2012 Mayıs 2011 May 2012 May 2011 May 2012 May 2011 TÜRKİYE İSTATİSTİK KURUMU Turkish Statistical Institute
  • 2. TÜİK EKONOMİK GÖSTERGELER Economic Indicators 2012 I II III IV TÜİK, Ekonomik Göstergeler, II. Dönem 2012 TurkStat, Economic Indicators, Quarter II 2012
  • 3. I II III IV İstatistiki veri ve bilgi istekleri için Bilgi Dağıtım Grubu Tel: Faks-Fax: Yayın istekleri için Döner Sermaye İşletmesi Tel: Faks-Fax: Yayın içeriğine yönelik sorularınız için Ulusal ve Uluslararası Göstergeler Takımı Tel: Faks-Fax: İnternet http://www.tuik.gov.tr E-posta bilgi@tuik.gov.tr Yayın No 3874 ISSN 1305-3353 Türkiye İstatistik Kurumu Yücetepe Mah. Necatibey Cad. No: 114 06100 Çankaya-ANKARA / TÜRKİYE Bu yayının 5846 Sayılı Fikir ve Sanat Eserleri Kanununa göre her hakkı Türkiye İstatistik Kurumu Başkanlığına aittir. Gerçek veya tüzel kişiler tarafından izinsiz çoğaltılamaz ve dağıtılamaz. Türkiye İstatistik Kurumu Matbaası, Ankara Tel: 0312 410 01 64 * Faks-Fax: 0312 418 50 82 Ekim 2012 MTB: 2012-617-100 Adet-Copies II TÜİK, Ekonomik Göstergeler, II. Dönem 2012 ISBN 978-975-19-5365-0 Quarter II 2012 TurkStat, Economic Indicators,
  • 4. Foreword Önsöz ÖNSÖZ FOREWORD 1952 ylndan itibaren yaymlanmakta olan “Aylk “Monthly Bulletin of Statistics” published since 1952 statistik Bülteni” ve 1989 tarihinden itibaren kullanma and “Turkish Economy: Statistics and Analysis” published sunulan “Türkiye Ekonomisi statistik ve Yorumlar” yaynlar since 1989 are merged into one publication. The birle tirilerek tek bir yayn haline getirilmi tir. “Ekonomik publication titled as “Economic Indicators” contains Göstergeler” yayn, Türkiye ekonomisine ili kin temel statistical information and analyses constituting main ekonomik göstergeleri olu turan istatistiki bilgi ve analizleri economic indicators of Turkish economy. içermektedir. Üç aylk dönemler itibariyle Türkçe- ngilizce olarak The publication published quarterly in Turkish and yaymlanan yayn, içerdi i ekonomik göstergelerle, English aims at to enlighten the main economic trend konjonktürel geli meleri ve de i meleri yanstarak through economic indicators on conjectural movements ekonominin temel gidi at hakknda bilgi vermeyi and variations. amaçlamaktadr. lk kez 2004 ylnn ikinci döneminde kullanma sunulan The publication presented for the first time in the bu yaynda son be yla ait yllk, son üç yla ait aylk ve second quarter of 2004, covers annual data of the last five dönemlik veriler yer almaktadr. years and, monthly and quarterly data of last three years. statistiklerin, bilgiye dönü türülmesini ve kolay The publication is supported with a brief explanation kavranlmasn sa lamak amacyla yayn; analiz, grafik ve on analyses, graphs and related indicators in order to ilgili göstergelere ili kin ksa bir de erlendirme ile enable the transformation of statistics into information to desteklenmi tir. facilitate the comprehension. Bu yaynn, Türkiye ekonomisine ait verileri etkin, We believe that this publication will be an important güncel ve bütüncül bir yap içinde yanstmada önemli bir reference which reflects the figures of Turkish economy in kaynak olaca  inancndayz. an up-to-date, compact and efficient manner. Birol AYDEMİR Başkan Birol AYDEM R President Ba kan President TÜİK, Ekonomik Göstergeler, II. Dönem 2012 III TurkStat, Economic Indicators, Quarter II 2012
  • 5.
  • 6. Contents İçindekiler Ç NDEK LER CONTENTS Sayfa Page Önsöz III Foreword çindekiler V Contents Simge ve Ksaltmalar VI Symbols and Abbreviations Türkiye Ekonomisi 1 Turkish Economy Ulusal Hesaplar 11 National Accounts Sanayi ve statistikleri 61 Industry and Business Statistics Bina n aat 87 Building Construction Tarm 107 Agriculture Beklentiler 121 Expectations D Ticaret 143 Foreign Trade Fiyatlar 181 Prices gücü 217 Labour Gelir-Tüketim 255 Income-Consumption Borçlanma 273 Borrowing Bütçe 281 Budget Para-Banka 289 Money-Banking Turizm 303 Tourism Ula trma 315 Transportation Ek Appendix Yaymlama Takvimi 325 Release Calendar lgili Bilgilere Ula mak çin... 326 To Reach The Related Information… TÜİK, Ekonomik Göstergeler, II. Dönem 2012 TurkStat, Economic Indicators, Quarter II 2012
  • 7. Simge ve Kısaltmalar Symbols and Abbreviations S MGE VE KISALTMALAR SYMBOLS AND ABBREVIATIONS Bilgi geçicidir. * Data is provisional. Bilgi elde edilememi tir. … Data not available. Bilgi yoktur. - Denotes magnitude nil. Uygulanamam tr . Not applicable Kullanlan birimin yarsndan azdr. 0 Magnitude less than half of unit employed 53 sayl Kanun gere i gizlilik ilkesine göre özel sektörde bir (*) Data pertaining to one or two private sector establishments veya iki i yerine ili kin bilgiler verilmemi tir. are not given by law no. 53 which is indicated. Küçük veya e it Less than or equal to Büyük veya e it More than or equal to Ba ka yerde snflandrlmam b.y.s. n.e.c. Not elsewhere classified Ortalama (A) Average Bir önceki aya göre de i im oran (%) a/a Percentage change over the previous month (%) Bir önceki döneme göre de i im oran (%) d/d Percentage change over the previous quarter (%) Bir önceki yln ayn ayna/dönemine göre de i im oran (%) y/y Percentage change over the same month/quarter of the previous year (%) Yeni Türk Liras YTL TRY New Turkish Liras Yabanc Para YP FX Foreign exchange Tasarruf Mevduat Sigorta Fonu TMSF SDIF Saving Deposit Insurance Fund Maliyet, Sigorta, Ta ma c.i.f. Cost, Insurance, Fright Gemide Teslim f.o.b. Free on Board Uluslararas Standart E itim Snflamas, 1997 ISCED,97 Standard International Classification of Education Status, 1997 Uluslararas Standart Meslek Snflamas, 1988 ISCO - 88 International Standard Classification of Occupations, 1988 Version Tüm Ekonomik Faaliyetlerin Uluslararas Standart Sanayi ISIC Rev.3 Industrial Classification of All Economics Activities, Third Snflamas, 3. Revizyon Revision Geni Ekonomik Grup Snflamas BEC Broad Economic Classification Standart Uluslararas Ticaret Snnflamas, 3. Revizyon SITC Rev.3 Standard International Trade Classification Revision Türkiye Cumhuriyeti Merkez Bankas TCMB CBRT Central Bank of the Republic of Turkey Devlet Hava Meydanlar letmesi Genel Müdürlü ü (DHM ) DHM DHMI General Directorate of State Airport Authority Uluslararas Para Fonu IMF International Monetary Fund Ekonomik Kalknma ve birli i Örgütü OECD Organisation for Economic Co-operation and Development Uluslararas teki Durum Snflamas, 1993 ICSE,93 International Classification Of Status In Employment, 1993 Amaca göre Bireysel Tüketim Snflamas COICOP Classification of Individual Consumption by Purpose Avrupa Hesaplar Sistemi ESA Europion System of account Avrupa Toplulu unda Ekonomik Faaliyetlerin statistiki NACE Rev.1 Statistical Classification of Economic Activities in the Snflamas European Community Ulusal Hesaplar Sistemi SNA System of National Accounts NOT NOTE 1. Kayna  belirtilmeyen tablolardaki veriler, Türkiye 1. The data in tables in which the source is not statistik Kurumu’na aittir. indicated, are provided by TurkStat. 2. Tablolarda ve emalarda rakamlar yuvarlamadan dolay 2. Total figures in tables and schemes may not be exact toplam vermeyebilir. due to rounding. 3. Ayrca belirtilmedikçe ölçü birimleri metrik sisteme 3. Unless otherwise designated all units of göredir. measurement are given in the framework of the metric system. 4. 01.01.2009 tarihinden itibaren YTL ifadesi TL olarak 4. From 01.01.2009, TRY expression is changed as TL. de i mi tir. VI TÜİK, Ekonomik Göstergeler, II. Dönem 2012 TurkStat, Economic Indicators, Quarter II 2012
  • 8. Turkish Economy Türkiye Ekonomisi Ulusal hesaplar National accounts Üretim yönünden GSYH 2012 ylnn ikinci döneminde bir önceki yln In production based approach GDP increased by 2,9% at 1998 prices ayn dönemine göre 1998 fiyatlaryla %2,9, cari fiyatlarla ise %10,3 and increased by 10,3% at current prices in the second quarter of 2012 orannda artm tr. Bu oranlara göre GSYH, 1998 fiyatlaryla compared to the same quarter of the previous year. Consequently GDP 28 837 597 bin TL, cari fiyatlarla ise 349 630 197 bin TL olarak was realized as 28 837 597 thousand TL at 1998 prices and 349 630 197 gerçekle mi tir. 1998 fiyatlaryla bir önceki yln ayn dönemine göre thousand TL at current prices. At 1998 prices, compared to the same imalat sanayi, toptan ve perakende ticaret, ula trma, depolama ve quarter of previous year, the increases in manufacturing industry, haberle me ve in aat sektörlerinde srasyla %3,4, %1,2, %3,9 ve wholesale and retail trade, transport, storage and communication and %0,4 oranndaki art lar, 1998 fiyatlaryla GSYH büyüme orann pozitif construction sectors by 3,4%, 1,2%, 3,9% and 0,4%, respectively, yönde etkilemi tir. affected the growth rate of GDP at 1998 prices positively. GSYH büyüme hz (1998 fiyatlaryla) (%) Growth rate of GDP (at 1998 prices) [Üretim yönünden - Production based] 15 10 5 0 I II III IV I II III IV I II 2010 2011* 2012* 2011 ylnda ki i ba na gayri safi yurtiçi hasla de eri cari fiyatlarla In 2011 GDP per capita at current prices was estimated as 17 553 TL, 17 553 TL ve ABD dolar cinsinden 10 469 dolar olarak tahmin and US Dollars 10 469. edilmi tir. Seçilmi ekonomik faaliyetler ve GSYH büyüme hz (1998 fiyatlaryla) Growth rate of selected economic activity and GDP (at 1998 prices) (Üretim yönünden - Production based) (%) Gayri safi yurtiçi Toptan ve Ula trma, hasla (Alc Tarm, avclk ve parekende depolama ve fiyatlaryla) ormanclk ticaret haberle me Gross domestic Agriculture, hunting malat sanayi Wholesale and Transport, storage product and forestry Manufacturing industry retail trade and communication (Purchaser's price) 2010 I 3,8 22,0 21,2 12,7 12,6 II 2,8 15,4 14,0 10,4 10,4 III 0,9 7,2 7,5 6,0 5,3 IV 4,5 11,3 13,4 13,8 9,3 2011* I 8,2 15,1 18,0 12,7 12,1 II 6,5 9,3 13,7 12,1 9,1 III 4,9 9,5 10,6 11,4 8,4 IV 5,8 5,3 3,2 6,6 5,0 2012* I 5,4 2,8 0,7 5,1 3,3 II 3,5 3,4 1,2 3,9 2,9 Harcamalar yönünden incelendi inde, 2012 ylnn ikinci döneminde Taking into account the expenditure approach, it is seen that in the 1998 fiyatlaryla GSYH içinde en büyük bölümü %68,9 ile yerle ik ve second quarter of 2012, the final consumption expenditure, at 1998 yerle ik olmayan hanehalklarnn yurtiçi tüketiminin olu turdu u prices, of resident and non-resident households constituted the largest görülmektedir. Ayn dönemde, alt kalemler arasnda en fazla büyüme part of the GDP as 68,9%. In the same period the largest growth %19,8 ile mal ve hizmet ihracat sektöründe gerçekle mi tir. Yine ayn among the other sub sectors was realized in the exports of goods and dönemde, mal ve hizmet almlarnda %5,1 ve devletin nihai tüketim services sector with the percent of 19,8. Again in the same period, harcamalarnda ise %4,4 orannda art gerçekle mi tir. purchases of goods and services increased by 5,1% and Government final consumption expenditure increased by 4,4%. TÜİK, Ekonomik Göstergeler, II. Dönem 2012 TurkStat, Economic Indicators, Quarter II 2012
  • 9. Türkiye Ekonomisi Turkish Economy Tüketim harcamalarnn büyüme hz (1998 fiyatlaryla) Growth rate of final consumption expenditures (at 1998 prices) Hanehalkı [Harcama yönünden - Expenditure based] Households (%) Kamu-Public 16 Hanehalkı Hanehalk Households 12 Households Kamu-Public 8 Kamu-Public 4 0 -4 -8 I II III IV I II III IV I II 2010 2011* 2012* Sabit sermaye yatrmlarnn büyüme hz (1998 fiyatlaryla) Growth rate of fixed capital investments (at 1998 prices) (%) [Harcama yönünden - Expenditure based] Kamu-Public 60 Özel-Private 50 40 Kamu-Public 30 Özel-Private Kamu-Public 20 Özel-Private 10 0 -10 -20 I II III IV I II III IV I II 2010 2011* 2012* Ödemeler dengesi Balance of payments 2012 yl Haziran aynda cari i lemler hesab 4 189 milyon ABD Dolar In June 2012 current account deficit was realized as 4 189 million US açk vermi tir. Buna göre, 2012 yl ilk alt aynda cari i lemler dengesi Dollars. Therefore, current account deficit was realized totally 30 606 toplam 30 606 milyon ABD Dolar açk vermi tir. millions US Dollars in the first six months of 2012. Cari i lemler hesab Current account (Milyar $-Billion $) 0 -2 -4 -6 -8 -10 7 8 9 10 11 12 1 2 3 4 5 6 2011 2012 2012 yl Haziran aynda, bir önceki yln ayn ay ile kar la trld nda, In June 2012, compared to the same month of the previous year, turizm dengesi %10,7 orannda artm , in aat dengesi ise %-70,8 tourism balance increased by 10,7% but construction balance orannda azalm tr. decreased by -70,8%. Ayn ayda, do rudan yatrmlarda sermaye çk , portföy yatrmlarnda In the same month, there is an outflow in direct investments and inflow ise sermaye giri i olmu , sonuç olarak toplamda 355 milyon ABD Dolar in portfolio investments, as a result, total financial outflows realized as tutarnda finansman çk  gerçekle mi tir. 355 million US Dollars. TÜİK, Ekonomik Göstergeler, II. Dönem 2012 TurkStat, Economic Indicators, Quarter II 2012
  • 10. Turkish Economy Türkiye Ekonomisi Ödemeler dengesi Balance of payments (Milyon $- Million $) Cari i lemler hesab D ticaret Yatrm geliri Finans Current dengesi Hizmetler dengesi hesaplar account Trade dengesi Investment Cari transferler Financial balance balance Services balance income balance Current transfers account 2011 7 - 5 418 - 7 971 3 060 - 594 101 4 050 8 - 4 026 - 6 905 3 154 - 491 230 4 446 9 - 6 368 - 8 405 2 640 - 728 139 5 265 10 - 4 515 - 6 388 2 302 - 471 57 3 416 11 - 5 424 - 6 235 1 079 - 351 99 4 694 12 - 6 622 - 6 725 313 - 594 401 7 105 2012 1 - 5 720 - 5 798 591 - 561 65 3 431 2 - 4 263 - 4 714 667 - 432 233 2 654 3 - 6 276 - 6 039 635 - 926 71 3 789 4 - 4 701 - 5 250 1 148 - 726 143 5 796 5 - 5 457 - 6 965 1 912 - 475 88 6 719 6 - 4 189 - 5 740 1 840 - 355 84 4 728 Sanayi Industry 2012 yl Haziran aynda toplam sanayi üretimi bir önceki yln ayn ayna In June 2012, total industry production increased by 3,0% göre %3,0 orannda artm , bir önceki aya göre ise %-1,6 orannda compared to the same month of the previous year, but decreased azalm tr. by -1,6% compared to the previous month. Aylk sanayi üretim endeksi Monthly industrial production index [Yllk de i im oran - Annually rate of change] [2005=100] (%) Elektrik, gaz, buhar ve Toplam malat iklimlendirme üretimi ve sanayi Madencilik ve sanayii da tm Total ta ocakçl  Manufacturing Electricity, gas, steam and air industry Mining and quarrying industry conditioning supply 2011 7 7,0 1,2 7,3 7,1 8 3,8 -3,9 5,0 -0,5 9 12,1 2,1 12,9 9,8 10 7,5 8,6 7,2 9,2 11 8,5 2,6 7,8 16,5 12 3,7 6,7 2,8 10,3 2012 1 1,5 -2,3 0,4 9,6 2 4,4 6,8 3,1 12,7 3 2,6 3,7 1,8 7,9 4 1,5 -1,7 1,6 2,5 5 5,9 4,2 5,8 7,2 6 3,0 9,4 1,8 10,6 2012 yl Haziran ay imalat sanayi üretiminde bir önceki yla göre %1,8 In June 2012, manufacturing industry production increased by orannda art , bir önceki aya göre ise %-3,1 orannda azal tespit 1,8% compared to the previous year, but decreased by -3,1% edilmi tir. compared to the previous month. 2012 yl Haziran aynda bir önceki yln ayn ayna göre imalat sanayi alt In June 2012, compared to the same month of the previous year in sektörleri arasnda en fazla üretim dü ü ü %-14,9 ile deri ve ilgili ürünlerin the subsectors of manufacturing industry, the highest production imalat sektöründe gözlenirken, en büyük art %23,3 ile a aç, a aç ürünleri decrease of -14,9% was recorded in manufacture of leather and ve mantar ürünleri imalat sektöründe görülmü tür. related products while the highest production increase of 23,3% was recorded in sector of manufacture of wood and products of wood and cork. 2012 yl Haziran aynda imalat sanayinde kapasite kullanm oran toplamda In June 2012, the capacity utilization rate in manufacturing industry %74,6 olarak gerçekle mi tir. in total realized as 74,6%. TÜİK, Ekonomik Göstergeler, II. Dönem 2012 TurkStat, Economic Indicators, Quarter II 2012
  • 11. Türkiye Ekonomisi Turkish Economy Kapasite kullanm oran (%) Rate of capacity utilization 80 70 60 50 7 8 9 10 11 12 1 2 3 4 5 6 2011 2012 Bina in aat Building construction 2012 ylnn ikinci döneminde, yeni ve ilave yap says bir önceki yln In the second quarter of 2012, the number of new buildings and ayn dönemine göre %5,4 orannda artarak 28 217 olarak additions realized as 28 217 by increasing 5,4% compared to the same gerçekle mi tir. Ayn dönemde, tamamen veya ksmen biten yap says quarter of previous year. In the same quarter, the number of building ise geçen yln ayn dönemine göre %-15,1 orannda azalarak 21 631 completed or partially completed decreased to 21 631 with an -15,1% olarak gerçekle mi tir. increment compared to the same quarter of previous year. 2012 ylnn ikinci döneminde, yapmna ba lanan ve yaplmakta olan In the second quarter of 2012, the cost of per square meter of konutlarn m2 maliyeti bir önceki yln ayn dönemine göre %6,9 artarak residential buildings of which the construction started and under 694 TL olarak gerçekle mi tir. construction realized as 694 TL by increasing 6,9% compared to the same quarter of the previous year. Yeni ve ilave bina in aat Construction of new buildings and additions (Bin-Tousand) 70 60 50 Konut-Residential 40 Di er-Other 30 20 10 0 I II III IV I II III IV I II 2010* Konut-Residential 2011* Diğer-Other 2012* Konut-Residential Diğer-Other Konut-Residential Diğer-Other gücü Labour 2012 ylnn ikinci döneminde istihdam edilenlerin says bir önceki yln In the second quarter of 2012, number of employed persons increased ayn dönemine göre %3,4 artarak 25 282 000 ki i olarak by 3,4% and reached to 25 282 000 compared to the same quarter of gerçekle mi tir. Ayn dönemde i gücüne katlm oran ise %50,5 olarak previous year. The labour force participation rate realized as 50,5% in gerçekle mi tir. the same quarter. gücüne katlm ve i sizlik oran Labour force participation rate and unemployment rate (%) (%) 19 Labour force participation rate 52 gücüne katlm oran 16 Unemployment rate sizlik oran 50 13 48 10 46 7 44 4 I II III IV I II III IV I II 2010 2011 2012 İşgücüne katılım oranı-Labour force participation rate İşgücüne katılım oranı-Labour force participation rate İşsizlik oranı-Unemployment rate gücüne katlm oran-Labour force participation rate İşsizlik oranı-Unemployment rate force participation rate İşgücüne katılım oranı-Labour sizlik oran-Unemployment rate İşsizlik oranı-Unemployment rate TÜİK, Ekonomik Göstergeler, II. Dönem 2012 TurkStat, Economic Indicators, Quarter II 2012
  • 12. Turkish Economy Türkiye Ekonomisi 2012 ylnn ikinci döneminde i sizlerin says %-10,9 azal la In the second quarter of 2012, the number of unemployed persons 2 272 000 olarak tespit edilmi , buna göre i sizlik oran da %8,2 decreased to 2 272 000 with -10,9% descent and unemployment rate was olarak belirlenmi tir. realized as 8,2%. gücü Labour gücüne 15 ve daha dahil gücüne Kurumsal yukar ya taki olmayan katlm olmayan nüfus nüfus oran nüfus Population gücü stihdam Not in Labour force sizlik oran Non-institutional 15 years Labour edilenler labour siz participation Unemployment population and over force Employed force Unemployed rate rate Bin - Thousand (%) 2010 I 71 043 52 223 24 831 21 267 27 392 3 564 47,5 14,4 II 71 239 52 431 25 901 23 055 26 529 2 846 49,4 11,0 III 71 440 52 645 26 166 23 195 26 478 2 971 49,7 11,4 IV 71 642 52 860 25 665 22 854 27 195 2 811 48,6 11,0 2011 I 71 920 53 152 25 766 22 802 27 386 2 964 48,5 11,5 II 72 218 53 439 26 995 24 445 26 444 2 550 50,5 9,4 III 72 523 53 734 27 406 24 884 26 328 2 521 51,0 9,2 IV 72 826 54 027 26 696 24 267 27 331 2 429 49,4 9,1 2012 I 73 254 54 365 26 058 23 338 28 307 2 721 47,9 10,4 II 73 482 54 599 27 554 25 282 27 044 2 272 50,5 8,2 Fiyatlar Prices 2012 yl Haziran aynda tüketici fiyat endeksi (2003=100) aylk In June 2012, the consumer price index (2003=100) decreased by - bazda %-0,90 orannda dü mü tür. Fiyat de i imine yllk olarak 0,90% on a monthly base. Considering the annual price changes, it is bakld nda, tüketici fiyatlarndaki art n %8,87 oldu u seen that the increase in the consumer prices is 8,87%. In the same görülmektedir. Ayn ayda üretici fiyat endeksi (2003=100) aylk month, the producer price index (2003=100) decreased by -1,49% on a olarak %-1,49 orannda dü ü ve yllk olarak ise %6,44 orannda monthly base and increased by 6,44% on an annual basis. art göstermi tir. (%) Aylk enflasyon Monthly inflation 4 3 2 TÜFE-CPI TÜFE-CPI 1 ÜFE-PPI ÜFE-PPI 0 -1 -2 7 8 9 10 11 12 1 2 3 4 5 6 2011 2012 12 aylk ortalamalara göre, tüketici fiyatlarndaki art Haziran In June 2012, based on the 12 months averages, while the consumer 2012’de %8,89 düzeyinde gerçekle irken, üretici fiyatlarnda price index increased by 8,89%, the producer price index increased by %10,24 olmu tur. 10,24%. 2012 yl Haziran aynda tüketici fiyatlarnda bir önceki aya göre en In June 2012, the highest decrease in consumer prices compared to the fazla dü ü %-3,42 ile gda ve alkolsüz içecekler alt grubunda previous month was recorded in the food and non-alcoholic beverages meydana gelmi tir. sub-group as -3,42%. Üretici fiyat endeksi sektörler ayrmnda incelendi inde, 2012 yl Taking into account the producer price index in terms of sectors, it is seen Haziran aynda bir önceki aya göre Elektrik, gaz ve su sektörü that in June 2012, 1,72% increase was recorded in electricity, gas and %1,72 orannda artm tr. Tarm sektörü, malat sanayi sektörü ve water sector compared to the previous month. The prices decreased by Madencilik ve ta ocakçl  sektöründe ise srasyla %-6,12, %-0,75, -6,12%, -0,75%, -0,55% in agriculture sector, in manufacturing industry ve %-0,55 orannda fiyat dü ü ü gerçekle mi tir. sector and in mining and stone quarrying sector, respectively. TÜİK, Ekonomik Göstergeler, II. Dönem 2012 TurkStat, Economic Indicators, Quarter II 2012
  • 13. Türkiye Ekonomisi Turkish Economy (%) Yllk enflasyon Annual inflation 15 12 TÜFE-CPI TÜFE-CPI TÜFE-CPI ÜFE-PPI ÜFE-PPI 9 ÜFE-PPI 6 3 0 7 8 9 10 11 12 1 2 3 4 5 6 2011 2012 D ticaret Foreign trade 2012 yl Haziran aynda ihracat bir önceki yln ayn ayna göre %16,7 In June 2012, compared to the same month of the previous year, artarak 13 247 milyon ABD Dolarna yükselmi , ithalat ise %-5,4 export increased to 13 247 million US Dollars and import decreased to azalarak 20 437 milyon ABD Dolarna dü mü tür. Böylece d ticaret 20 437 million US Dollars by ascending 16,7% and -5,4%, respectively. dengesi 7 190 milyon ABD Dolar açk vermi , ihracatn ithalat kar lama Consequently, foreign trade deficit realized as 7 190 million US Dollars oran ise %64,8’ e yükselmi tir. and the rate of import covered by export increased to 64,8%. D ticaret (Milyar $-Billion $) Foreign trade 24 18 12 6 0 -6 -12 7 8 9 10 11 12 1 2 3 4 5 6 2011 2012* hracat-Exports thalat-Imports Denge-Balance İhracat-Exports İhracat-Exports İthalat-Imports İthalat-Imports Denge-Balance Denge-Balance hracat içinde en büyük paya sahip olan imalat sanayii ürünleri ihracat In June 2012, compared to the same month of the previous year, 2012 yl Haziran aynda geçen yln ayn ayna göre %16,3 artarak export of manufacturing industrial products, which has the largest 12 478 milyon ABD Dolarna yükselmi tir. Ayn ayda %28,9 art la tarm share in total export, rised to 12 478 million US Dollars with an 16,3% ve ormanclk ürünleri ihracat 391 milyon ABD Dolarna, madencilik ve increase. In the same month, the agricultural and forestry products ta ocakçl  ürünleri ihracat ise %29,1 orannda art la 322 milyon ABD exports increased to 391 million US Dollars by ascending 28,9%, and Dolarna yükselmi tir. mining and quarrying products exports rised to 322 million US Dollars with an increase of 29,1%. 2012 yl Haziran aynda bir önceki yln ayn ayna göre sermaye mallar In June 2012, compared to the same month of previous year, the ithalat %-30,7, tüketim mallar ithalat %-20,2 orannda azalm , ara imports of capital goods and the consumption goods decreased by mallar ithalat ise %3,3 orannda artm tr. -30,7% and -20,2%, respectively, while the intermediate goods increased by 3,3%. 2012 yl Haziran aynda AB ülkelerine yaplan ihracat ve ithalatn toplam In June 2012, the shares of the exports and imports to and from the EU içindeki paylar srasyla %37,1 ve %35,8’dir. Ayn ayda, geçen yln ayn countries were 37,1% and 35,8% in total respectively. Exports to EU ayna göre bu ülkelere yaplan ihracat %-10,2 orannda, ithalat ise %- countries decreased by -10,2% and imports from these countries 16,1 orannda azalm tr. decreased by -16,1% compared to the same month of the previous year. TÜİK, Ekonomik Göstergeler, II. Dönem 2012 TurkStat, Economic Indicators, Quarter II 2012
  • 14. Turkish Economy Türkiye Ekonomisi D ticaret Foreign trade (Milyon $- Million $) D ticaret hracatn ithalat kar lama dengesi oran hracat thalat Balance of Rate of imports covered by exports Exports Imports foreign trade (%) 2011 7 11 860 21 061 -9 201 56,3 8 11 245 19 679 -8 434 57,1 9 10 751 21 204 -10 453 50,7 10 11 907 19 919 -8 012 59,8 11 11 079 18 649 -7 571 59,4 12 12 477 20 594 -8 116 60,6 2012* 1 10 350 17 376 -7 026 59,6 2 11 750 17 720 -5 970 66,3 3 13 211 20 600 -7 389 64,1 4 12 634 19 273 -6 639 65,6 5 13 139 21 750 -8 611 60,4 6 13 247 20 437 -7 190 64,8 Brüt d borç Gross external debt Türkiye brüt d borç stoku 2012 ylnn ikinci döneminde 323 472 In the second quarter of 2012, external debt stock of Turkey milyon ABD Dolar olarak gerçekle mi tir. Bunun 224 461 milyon realized as 323 472 million US Dollars. 224 461 million US Dollars ABD Dolar uzun vadeli, 99 011 milyon ABD Dolar ise ksa vadeli of this amount was long term, and remaining 99 011 million US borçlardan olu maktadr. Dollars was short term debt. (Milyar $- Brüt d borç stoku Billion $) Gross external debt stock 320 240 160 80 0 I II III IV I II III IV I II 2010 2011 2012 Uzun vadeli-Long term Ksa vadeli-Short term Uzun vadeli-Long term Kısa vadeli-Short term Bu dönemde, uzun vadeli borçlarn toplam brüt borç stoku içindeki In this period, the share of long term debt in total gross external pay %69,4, ksa vadeli borçlarn pay ise %30,6’ dr. debt stock was 69,4% and that of short term was 30,6%. Brüt d borç stoku Gross external debt stock (Milyon $- Million $) Türkiye brüt Uzun vadeli d borç Long term Gross Özel sektör external debt of Toplam Kamu sektörü TCMB Private Ksa vadeli Turkey Total Public sector CBRT sector Short term 2010 I 268 039 214 177 80 344 10 876 122 956 53 862 II 266 167 205 823 79 239 9 873 116 711 60 344 III 284 247 216 270 84 426 10 687 121 157 67 977 IV 292 222 214 753 84 786 10 251 119 716 77 469 2011 I 302 449 225 783 88 671 10 633 126 479 76 666 II 314 655 230 305 89 625 10 528 130 152 84 350 III 313 960 225 430 87 628 9 270 128 531 88 530 IV 306 704 222 857 87 268 8 430 127 159 83 847 2012 I 318 669 228 407 90 411 8 419 129 577 90 262 II 323 472 224 461 89 482 7 559 127 420 99 011 TÜİK, Ekonomik Göstergeler, II. Dönem 2012 TurkStat, Economic Indicators, Quarter II 2012
  • 15. Türkiye Ekonomisi Turkish Economy 2012 ylnn ikinci döneminde uzun vadeli brüt d borç stokunun In the second quarter of 2012, the amount of 89 482 million US Dollars 89 482 milyon ABD Dolarlk ksm (%39,9) kamu kesimine, 7 559 (39,9%) of the total long term gross external debt stock was due to milyon ABD dolarlk ksm Merkez Bankasna (%3,4), 127 420 milyon public sector, 7 559 million US Dollars (3,4%) was due to Central Bank ABD Dolarlk (%56,8) ksm ise özel kesime aittir. and 127 420 million US Dollars (56,8%) was due to private sector. Bütçe Budget 2012 yl Haziran aynda bütçe gelirleri 158 300 milyon TL’ye, bütçe In June 2012, total budget revenues rose to 158 300 million TL, and harcamalar ise 165 696 milyon TL’ye ula m tr. Kümülatif olarak budget expenditures reached to 165 696 million TL. Total budget deficit bütçe 7 397 milyon TL açk vermi tir. realized as 7 397 million TL. Bütçe dengesi (Milyar TL- Budget balance Billion TL) 5 0 -5 -10 -15 -20 7 8 9 10 11 12 1 2 3 4 5 6 2011* 2012* 2012 ylnn ikinci döneminde bütçe dengesinin GSYH’ye oran ise In the second quarter of 2012, the ratio of budget balance to GDP was %-0,1’dir. -0,1%. 2012 yl Haziran aynda, toplam vergi gelirleri içinde dolaysz In June 2012, while the share of indirect taxes and direct taxes in total vergilerin pay %34,1 ve dolayl vergilerin pay %65,9 olurken, tax revenues were 34,1% and 65,9%, respectively, the tax revenues in Haziran ayna ait vergi gelirleri geçen yln ayn ayna göre %6,9 the month of June increased by 6,9% compared to the same month of orannda artm tr. the previous year. Bütçe Budget (Milyon TL-Million TL) Gelirler Harcamalar Bütçe dengesi Revenues Expenditure Budget balance 2011* 7 162 393 166 261 -3 868 8 194 134 193 792 341 215 516 215 672 - 157 10 237 435 242 065 -4 630 11 265 829 267 781 -1 952 12 287 909 306 400 -18 491 2012* 1 27 648 25 971 1 677 2 54 440 57 668 -3 228 75 311 82 302 -6 991 4 104 447 109 864 -5 418 134 424 136 390 -1 966 6 158 300 165 696 -7 397 2012 ylnn ikinci döneminde vergi yükü (vergi gelirleri/GSYH) %19,1 In the second quarter of 2012, tax burden which is the percentage ratio olarak gerçekle mi tir of tax revenues to GDP realized as 19,1%. 2012 yl Haziran aynda personel harcamalarnn bütçe harcamalar In June 2012, the share of personnel expenditures and share of interest içindeki pay %23,0, faiz ödemelerinin pay ise %15,8 olarak payments in budget expenditures observed as 23,0% and 15,8% gerçekle mi tir. respectively. TÜİK, Ekonomik Göstergeler, II. Dönem 2012 TurkStat, Economic Indicators, Quarter II 2012
  • 16. Turkish Economy Türkiye Ekonomisi Para ve banka Money and banking 2012 yl Haziran aynda para arz M1 geçen yla göre %0,9 orannda In June 2012, money supply M1 increased by 0,9% compared to the art la 142 242 milyon TL’ ye yükselmi tir. Ayn ayda M2 %5,5 previous year and rose to 142 242 million TL. In the same month, M2 artarak 673 406 milyon TL’ye ve M3 %7,1 artarak 720 377 milyon increased by 5,5% and rose to 673 406 million TL and M3 increased TL'ye çkm tr. by 7,1% and rose to 720 377 million TL. Para arz ve ÜFE (aylk de i im oran) Money supply and PPI (monthly percentage change) (%) 3 2 1 0 -1 -2 7 8 9 10 11 12 1 2 3 4 5 6 2011 2012 M2 M3 ÜFE Ayn ayda döviz tevdiat hesab, bir önceki yla göre %18,4 orannda In the same month, foreign exchange deposit accounts was recorded artarak 196 395 milyon TL olarak izlenmi tir. as 196 395 million TL with 18,4% increase compared to the previous year. 2012 yl Haziran aynda dola mdaki para 51 887 milyon TL’ye In June 2012, currency in circulation increased by 3,2% and reached yükselmi tir. Bu rakam geçen yla göre %3,2 orannda bir art  ifade to 51 887 million TL, compared to the same month of previous year. etmektedir. 1 yllk vadeli tasarruf mevduat faiz oran 2011 yl Haziran aynda At the end of June 2012, annual timed saving deposit interest rate %14,8 iken, 2012 yl Haziran ay sonunda %16,1’e yükselmi tir. increased to 16,1% while in June 2011 it was %14,8. Parasal göstergeler Monetary indicators (Milyon TL-Million TL) 2011 2012 7 8 9 10 11 12 1 2 3 4 5 6 M1 138 180 145 057 145 827 151 239 142 288 136 237 133 158 135 183 132 295 136 363 142 740 142 242 M2 644 249 648 253 654 290 657 806 651 527 655 523 646 026 649 974 657 482 660 362 673 038 673 406 M3 681 089 685 529 689 720 694 247 688 687 693 069 684 859 688 703 696 645 702 395 715 010 720 377 Dola mdaki para Currency in circulation 51 387 54 084 51 844 58 118 51 005 49 408 47 903 47 215 48 749 49 096 49 602 51 887 Merkez Bankas paras Central Bank money stock 77 445 75 311 71 961 62 218 60 990 53 154 43 767 45 538 46 488 53 276 55 116 56 543 Parasal büyüklükler Monetary aggregates (1) [Yllk de i im oran] [Yearly percentage change] (%) Ay- Month M1 M2 M3 2011 7 13,0 10,7 11,5 8 13,7 9,0 9,8 9 8,6 7,8 8,2 10 12,2 6,5 7,3 11 5,8 2,6 3,3 12 -11,6 -1,8 -0,9 2012 1 -3,6 -0,6 -0,1 2 -2,9 -1,3 -0,6 3 -7,0 -0,6 0,3 4 -3,9 -0,8 0,1 5 -2,2 -0,9 -0,2 6 -5,5 -1,0 0,6 (1) ÜFE (2003=100) ile deflate edilmi tir. (1) Figures are deflated using PPI (2003=100) TÜİK, Ekonomik Göstergeler, II. Dönem 2012 TurkStat, Economic Indicators, Quarter II 2012
  • 17.
  • 18. National Accounts Ulusal Hesaplar Ç NDEK LER CONTENTS Sayfa Page 1. Tanm ve Kavramlar 13 1. Definitions and Concepts 2. ekil 2. Figures 1.1 2012 ylnn ikinci dönemine ait GSYH 14 1.1 GDP in the second quarter of 2012 (production based) (üretim yöntemi) 1.2 2012 ylnn ikinci dönemine ait GSYH 15 1.2 GDP in the second quarter of 2012 (expenditure based) (harcama yöntemi) 1.3 Yerle ik ve yerle ik olmayan hanehalklarnn 2012 ylnn 16 1.3 Shares of final consumption expenditures of resident and ikinci dönemine ait yurtiçi tüketim paylar non-resident households on the economic territory in the (1998 fiyatlaryla, COICOP) second quarter of 2012 (at 1998 prices, COICOP) 3. Grafik 3. Graphics 1.1 GSYH geli me hz (1998 fiyatlaryla) 34 1.1 GDP growth rate (at 1998 prices) 1.2 Ki i ba na gayri safi yurtiçi hasla (Cari fiyatlarla) 34 1.2 Gross domestic product per capita (In current prices) 1.3 ktisadi faaliyetlerin GSYH içindeki paylar 35 1.3 Shares of economic activities in GDP (1998 fiyatlaryla) (at 1998 prices) 1.4 Ba lca iktisadi faaliyetlerin geli me hzlar 35 1.4 Growth rates of main economic activities (1998 fiyatlaryla) (at 1998 prices) 1.5 ktisadi faaliyetlerin GSYH büyüme hzna katklar 35 1.5 Contribution of economic activities to growth rates of GDP (1998 fiyatlaryla) (at 1998 prices) 1.6 Harcama kalemlerinin GSYH içindeki paylar 44 1.6 Shares of expenditure types in GDP (1998 fiyatlaryla) (at 1998 prices) 1.7 Yatrm, hanehalk ve hükümet harcamalarnn geli me 44 1.7 Growth rates of investment, households and government hzlar (1998 fiyatlaryla) expenditures (at 1998 prices) 1.8 Harcama kalemlerinin GSYH büyüme hzna katklar 44 1.8 Contribution of expenditure types to growth rates of GDP (1998 fiyatlaryla) (at 1998 prices) 1.9 Harcama türlerinin hanehalk harcamalar içindeki paylar 51 1.9 Shares of expenditure types in households expenditures (1998 fiyatlaryla) (at 1998 prices) 1.10 Ba lca harcama türlerinin geli me hzlar 51 1.10 Growth rates of main expenditure types (1998 fiyatlaryla) (at 1998 prices) 1.11 Cari i lemler hesab 59 1.11 Current account 1.12 Ödemeler Dengesi 59 1.12 Balance of Payments 4. Tablo 4. Tables 1.1 GSYH ve GSYH deflatörünün geli me hzlar 17 1.1 Growth rates of GDP and GDP deflator 1.2 Ki i ba na gayri safi yurtiçi hasla 17 1.2 Per capita gross domestic product 1.3 ktisadi faaliyet kollarna göre GSYH (cari fiyatlarla) 18 1.3 GDP by economic activities (at current prices) 1.4 ktisadi faaliyet kollarnn GSYH içindeki paylar 20 1.4 Shares of economic activities in GDP (cari fiyatlarla) (at current prices) 1.5 ktisadi faaliyet kollarna göre GSYH geli me hzlar 22 1.5 Growth rate of GDP by economic activities (cari fiyatlarla) (at current prices) 1.6 ktisadi faaliyet kollarnn GSYH geli me hzna katklar 24 1.6 Contribution of economic activites of growth rate of GDP (cari fiyatlarla) (at current prices) TÜİK, Ekonomik Göstergeler, II. Dönem 2012 11 TurkStat, Economic Indicators, Quarter II 2012
  • 19. Ulusal Hesaplar National Accounts 1.7 ktisadi faaliyet kollarna göre GSYH (1998 fiyatlaryla) 26 1.7 GDP by economic activities (at 1998 prices) 1.8 ktisadi faaliyet kollarnn GSYH içindeki paylar 28 1.8 Shares of economic activities in GDP (1998 fiyatlaryla) (at 1998 prices) 1.9 ktisadi faaliyet kollarna göre GSYH geli me hzlar 30 1.9 Growth rate of GDP by economic activities (1998 fiyatlaryla) (at 1998 prices) 1.10 ktisadi faaliyet kollarnn GSYH geli me hzna katklar 32 1.10 Contribution of economic activites to growth rate of GDP (1998 fiyatlaryla) (at 1998 prices) 1.11 Harcama kalemlerine göre GSYH (cari fiyatlarla) 36 1.11 GDP by expenditure types (at current prices) 1.12 Harcama kalemlerinin GSYH içindeki paylar 37 1.12 Shares of expenditure types in GDP (cari fiyatlarla) (at current prices) 1.13 Harcama kalemlerine göre GSYH geli me hzlar 38 1.13 Growth rates of GDP by expenditure types (cari fiyatlarla) (at current prices) 1.14 Harcama kalemlerinin GSYH geli me hzna katklar 39 1.14 Contribution of expenditure types to growth rates of GDP (cari fiyatlarla) (at current prices) 1.15 Harcama kalemlerine göre GSYH (1998 fiyatlaryla) 40 1.15 GDP by expenditure types (at 1998 prices) 1.16 Harcama kalemlerinin GSYH içindeki paylar 41 1.16 Shares of expenditure types in GDP (1998 fiyatlaryla) (at 1998 prices) 1.17 Harcama kalemlerine göre GSYH geli me hzlar 42 1.17 Growth rates of GDP by expenditure types (1998 fiyatlaryla) (at 1998 prices) 1.18 Harcama kalemlerinin GSYH geli me hzna katklar 43 1.18 Contribution of expenditure types to growth rates of GDP (1998 fiyatlaryla) (at 1998 prices) 1.19 Yerle ik ve yerle ik olmayan hanehalklarnn yurtiçi 45 1.19 Final consumption expenditure of resident and non-resident tüketimi (cari fiyatlarla) households on the economic territory (at current prices) 1.20 Harcama türlerinin yerle ik ve yerle ik olmayan 46 1.20 Shares of expenditure types in final consumption hanehalklarnn yurtiçi tüketimi içindeki paylar expenditure of resident and non-resident households on the (cari fiyatlarla) economic territory (at current prices) 1.21 Yerle ik ve yerle ik olmayan hanehalklarnn yurtiçi 47 1.21 Growth rates of final consumption expenditure of resident tüketimi geli me hzlar (cari fiyatlarla) and non-resident households on the economic territory (at current prices) 1.22 Yerle ik ve yerle ik olmayan hanehalklarnn yurtiçi 48 1.22 Final consumption expenditure of resident and non-resident tüketimi (1998 fiyatlaryla) households on the economic territory (at 1998 prices) 1.23 Harcama türlerinin yerle ik ve yerle ik olmayan 49 1.23 Shares of expenditure types in final consumption hanehalklarnn yurtiçi tüketimi içindeki paylar expenditure of resident and non-resident households on the (1998 fiyatlaryla) economic territory (at 1998 prices) 1.24 Yerle ik ve yerle ik olmayan hanehalklarnn yurtiçi 50 1.24 Growth rates of final consumption expenditure of resident tüketimi geli me hzlar (1998 fiyatlaryla) and non-resident households on the economic territory (at 1998 prices) 1.25 Ödemeler bilançosu 52 1.25 Balance of payments 1.26 Cari i lemler hesab 53 1.26 Current account 1.27 Sermaye ve finans hesaplar 56 1.27 Capital and financial accounts 1.28 Rezerv varlklar 58 1.28 Reserve assets 12 TÜİK, Ekonomik Göstergeler, II. Dönem 2012 TurkStat, Economic Indicators, Quarter II 2012