SlideShare une entreprise Scribd logo
1  sur  21


                            Recession Looms for the  
                              U.S. Economy in 2007  
                                                                

                                               Dean Baker 
                                                          
                                               November 2006


Center for Economic and Policy Research 
1611 Connecticut Avenue, NW, Suite 400 
Washington, D.C. 20009 
Tel: 202‐293‐5380 
Fax:202‐588‐1356 
www.cepr.net 
Recession Looms for the U.S. Economy in 2007                               ii


                                                            Contents 
Introduction.......................................................................................................................................... 1

Overview ............................................................................................................................................... 1

Housing ................................................................................................................................................. 5

Consumption ........................................................................................................................................ 9

Investment .......................................................................................................................................... 11

Exports and Imports ......................................................................................................................... 12

Government Spending ...................................................................................................................... 14

Job Growth ......................................................................................................................................... 15

Inflation ............................................................................................................................................... 18

Interest Rates and the Dollar............................................................................................................ 19

After 2007 ........................................................................................................................................... 19


About the Author
Dean Baker is Co-Director at the Center for Economic and Policy Research in
Washington, DC.
Recession Looms for the U.S. Economy in 2007         1


Introduction 

The recovery that began in November of 2001 is likely to come to an end in 2007. The main factor
pushing the economy into recession will be weakness in the housing market. The housing market
had been the primary fuel for the recovery until the last year, as there was an unprecedented run-up
in house prices since 1997. With prices now headed downward, construction and home sales have
dropped off by almost 20 percent against year ago levels. Even more importantly, borrowing against
home equity, which had been the main factor fueling consumption growth, will plummet as many
homeowners lack any further equity to borrow against. The result will be a downturn in
consumption spending, which together with plunging housing investment, will likely push the
economy into recession. The economy will see a substantial net loss of jobs, with nominal wage
growth slowing as the labor market weakens over the course of the year.

Overview  
This recovery has been fueled to a very large extent by a housing bubble, just as the second half of
the nineties cycle was fueled by a stock bubble. Since 1997, average house prices have risen by more
than 50 percent, after adjusting for inflation. Historically, house prices have moved at approximately
the same pace as the overall rate of inflation.1 This unprecedented run-up has not been associated
with extraordinary population or income growth, both of which have been below their average pace
for the post-war years since 2000. It is also not associated with any new restrictions on supply, as
housing construction was at near record levels over the period 2003-2005. The run-up in house sale
prices was also not associated with any extraordinary increase in rents, which rose only slightly more
rapidly than the overall rate of inflation over this period. In short, the run-up in house prices cannot
be explained except as a speculative bubble.

This bubble fueled the economy directly through its impact on the housing sector and indirectly
through the impact that housing wealth had on consumption. Housing construction and sales
account for more than six percent of GDP. The run-up in prices has led to a near doubling of sales
of new and existing homes since the mid-nineties. It has also led to record nationwide vacancy rates
for both rental and owner occupied housing. In past downturns housing investment has fallen by
30-40 percent. The sector has never seen as much overbuilding as it has experienced in the current
cycle. Also, with the huge baby boom cohort now entering its retirement years, demand for housing
should be shrinking relative to the size of the population in the years ahead. Based on past patterns,
it is reasonable to expect a drop in output in the housing sector from its 2005 peaks of at least 40
percent. It should reach this bottom by the end of 2007 or early 2008 at the latest.

The wealth effect created by the housing bubble fueled an extraordinary surge in consumption over
the last five years, as savings actually turned negative. (The country’s demographics, with most of the
baby boom cohort still in its prime saving years, is heavily tilted toward saving.) The run-up in prices


1   Background data on the housing bubble can be found in Baker, D., 2005, “The Housing Bubble Fact Sheet,” Center
    for Economic and Policy Research [http://www.cepr.net/publications/housing_fact_2005_07.pdf] and Baker, D.,
    2006, “Is the Housing Bubble Collapsing? Ten Economic Indicators to Watch” Center for Economic and Policy
    Research [http://www.cepr.net/publications/housing_indicators_2006_06.pdf].
Recession Looms for the U.S. Economy in 2007   2


created $5 trillion in excess housing wealth. Conventional estimates of the size of the housing wealth
effect imply that this wealth would have generated an additional $200-$300 billion of consumption
(1.6-2.3 percent of GDP).

It is plausible that the impact of this bubble wealth was actually considerably larger than the
conventional estimates imply. Historically, the saving rate in the United States had averaged close to
eight percent of disposable income. The savings rate began to decline sharply in the nineties, at least
partially in response to the stock bubble, although other factors likely played a role. However, even
assuming a baseline savings rate of just four percent, the current rate of -1 percent implies an
amount of excess consumption of almost $480 billion annually, given current income levels. This
higher figure is consistent with data showing that households were borrowing more than $600
billion annually against their home equity in 2005.

This home equity-fueled consumption will be sharply curtailed in the near future. In spite of the
record run-up in house prices, the ratio of homeowners’ equity to market value stood at a record
low in the second quarter of 2006. (This is especially striking since the baby boom cohort is now
ages 42-60 and would be expected to have accumulated considerable equity in their homes.) With
house prices now falling, the number of homeowners who have exhausted the ability to borrow
against their home will rise rapidly. A sharp run-up in credit card debt earlier this year provides
evidence that this is already happening, as people who were unable to borrow against their homes
likely turned to their credit cards. However, credit card borrowing cannot replace borrowing against
home equity (the volume of outstanding credit card debt is less than one tenth of the volume of
mortgage debt); millions of homeowners will soon be forced to curtail their consumption as home
prices decline.

Homeowners will also be hit by the resetting of more than $2 trillion in adjustable rate mortgages in
2006 and 2007. While most homeowners in the United States have generally opted for fixed rate
mortgages, adjustable rate mortgages have become far more popular in the last five years. This is
especially striking, since the mortgage rate available on fixed rate mortgages was at its lowest level in
fifty years. Presumably, homebuyers opted for adjustable rate mortgages to take advantage of the
lower starting rate. Typically, this rate is locked in for a period of three years. More than 30 percent
of the mortgages issued in 2003 and 2004 had adjustable rates, which were record years for
mortgage financing. The lock-in period on these mortgages is ending in 2006-07. In many cases the
interest rate is resetting upward by close to two percentage points. This will be a major strain for
many homeowners who were already struggling to meet mortgage payments on over-priced houses.
Some homeowners will be unable to meet these higher payments and forced to sell, putting further
downward pressure on the housing market.

There also will be an increase in default rates, as many homeowners will be unable to meet mortgage
payments and unable or unwilling to sell their homes. The rise in defaults will put severe strains on
the portions of the financial industry that hold large amounts of mortgage debt.

The turnaround in the housing market has already begun to affect the economy. There was a marked
slowdown in consumption growth beginning in the second quarter, which has continued into the
third quarter according to currently available data. At the least, it seems that the savings rate is no
longer declining. It is likely to begin rising in the near future, and will almost certainly have moved
into positive territory by early 2007. This means that consumption growth will be trailing income
growth.
Recession Looms for the U.S. Economy in 2007   3


With the housing and consumer sectors both showing weakness, there is little prospect that growth
in other sectors will be able to offset this drag on growth. The continuing large budget deficits rule
out any substantial boosts to government spending or further tax cuts. State and local governments
are in better financial shape, but this is driven in part by higher property tax collections, which in
turn are based on the run-up in house prices. With house prices moving downward in many areas,
tax collections are likely to fall in the near future also.

Investment spending has weakened in recent months, following the slower growth in consumption.
Measures of capacity utilization have already fallen substantially from the not very high levels
reached in the spring. While investment growth may stay positive in 2007, it is likely to be slower
than it was in 2005 and the beginning of 2006. It will provide little offset to the downturn in housing
and consumption.

TABLE 1
Summary Predictions
                                                             4th Quarter 2006 ― 4th Quarter 2007

 GDP Growth                                                                      -0.7%
 Job Growth                                                                -1.2 million
 Nominal Wage Growth                                                        3.4 percent
 Inflation (CPI)                                                            2.6 percent
 Core Inflation (CPI)                                                       2.6 percent
 Inflation (GDP Deflator)                                                   2.4 percent
 Residential Construction                                                 -12.0 percent
 Consumption                                                               -1.2 percent
 Investment                                                                 2.0 percent
 Exports                                                                    4.0 percent
 Imports                                                                   -2.0 percent
 Government Expenditures                                                    2.0 percent

 Government Budget Deficit (Fiscal ’07)                                    $370 billion
 Trade Deficit                                                             $750 billion
 Existing Home Sales                                                         5,600,000
 Housing Starts                                                              1,670,000

                                                                        End of Period

 Unemployment Rate                                                         6.3 percent
 Federal Funds Rate                                                       4.00 percent
 10-Year Treasury                                                         5.20 percent
 Dollar/Euro                                                                 0.77 euro
 Dollar/Yen                                                                   105 yen


The slowdown in the U.S. economy should lead to a modest improvement in the trade deficit,
assuming that there are no major adjustments in currency prices and that oil stays near its current
price. Since the trade deficit has been growing, and would likely continue to grow if the economy
sustained its recent growth path, it would take substantial slowing just to hold the size of the deficit
constant. With a falloff in GDP growth over the course of the year, the deficit may fall by around
$40-50 billion (about 0.4 percent of GDP) from its current level.
Recession Looms for the U.S. Economy in 2007   4


The Fed is likely to respond to the slowdown by lowering interest rates. It will almost certainly be
very cautious in its rate reductions for two reasons. First, even with the economy slowing, inflation
is still above the Fed’s, or at least Bernanke’s, target rate. With Bernanke feeling the need to establish
his reputation as an inflation fighter, he will be hesitant to abandon the battle against inflation too
quickly.

The other reason that the Fed is likely to be cautious in lowering rates is that it is far more
concerned about long-term rates than the short-term interest rates directly under its control. The
long-term rate has barely budged in response to the two-year tightening by the Fed. (The 10-year
Treasury rate was just over 4.6 percent when Greenspan began tightening in June 2004, which is also
the rate in November 2006.) Investors, and more importantly the Chinese and Japanese central
banks have been willing to hold long-term treasuries at very low real interest rates. The central banks
are presumably holding these bonds to support the dollar and the U.S. economy, thereby sustaining
their export market. They must recognize that they will lose money on these bonds when they
decide to sell them, but consider this loss to be an acceptable price for sustaining their exports.
However, if they came to feel the Fed was being reckless in its monetary policy, these central banks
may become less willing to hold long-term bonds. Any substantial sell-off could lead to sharp rises
in long-term interest rates in the United States. The fear of such a sell-off (either by central banks or
private investors), will lead the Fed to be very cautious in lowering interest rates. However, it is likely
that it will begin dropping rates in its first meeting in 2007 and will lower them by 1.0-1.5 percentage
points over the course of the year.
Recession Looms for the U.S. Economy in 2007       5


Housing 
The key factor determining the strength of the U.S. economy in 2007 will be the extent of the
decline in the housing market. Historically, house prices have just kept even with the overall rate of
inflation. Since the mid-90s, inflation-adjusted house prices have risen by a nationwide average of
more than 50 percent, implying an over-valuation of close to one-third.

FIGURE 1
Real House Sale Prices
                  200

                  180

                  160

                  140

                  120
     1953 = 100


                  100

                   80

                   60

                   40

                   20

                    0
                  19 3
                  19 5
                  19 7
                     59

                  19 1
                  19 3
                  19 5
                  19 7
                  19 9
                  19 1
                  19 3
                     75

                  19 7
                  19 9
                  19 1
                  19 3
                  19 5
                  19 7
                  19 9
                     91

                  19 3
                  19 5
                  19 7
                  20 9
                  20 1
                  20 3
                     05
                     5
                     5
                     5


                     6
                     6
                     6
                     6
                     6
                     7
                     7


                     7
                     7
                     8
                     8
                     8
                     8
                     8


                     9
                     9
                     9
                     9
                     0
                     0
                  19


                  19


                  19


                  19


Source: OFHEO, BLS, and BEA.2

This over-valuation has provided an enormous boost to the economy over the last five years, leading
to record high sales of existing homes and near record rates of construction. The charts below make
comparisons to the mid-90s, since these were the years just prior to the beginning of the housing
boom when the economic recovery was already well underway. With the U.S. population having
increased by approximately 10 percent over the last decade, it would be reasonable to expect an
increase in sales and construction numbers of approximately 10 percent. Instead, housing starts had
increased by more than 50 percent at their 2005 peak, and sales were up by almost 90 percent.
Assuming that the mid-90s provides a reasonable reference point (few economists argued that
housing was depressed at the time), the data indicate that construction will stabilize at a level that is
more than 25 percent lower than the 2005 peak and that stable level for sales will be more than 40
percent lower. Of course, given the extraordinary overbuilding of the last few years, it is likely that


2   The real house price shown in Figure 1 uses the BLS home price index for 1953 to 1977, the OFHEO House Price
    Index from 1982 to 2006, and averages the change in the two indexes over the period from 1977 to 1982.
Recession Looms for the U.S. Economy in 2007      6


the economy will overshoot on the way down. Construction and sales could fall considerably below
these levels for a few years as the housing market adjusts to a more normal situation.

FIGURE 2
Sales of Existing Single Family Homes
             8,000

                                                                            7,075
             7,000                                                6,779
                                                                                       6,450
                                                       6,175
             6,000
                                                                                                  5,600
 Thousands


             5,000


                             3,886   3,852
             4,000   3,739


             3,000


             2,000
                     1993    1994    1995               2003      2004       2005     2006(p)    2007(p)


Source: NAR [http://www.realtor.org/Research.nsf/files/REL0603TS.pdf/$FILE/REL0603TS.pdf]

Sales of existing homes have already fallen sharply in first nine months of 2006. The projections
shown in Figure 2 assume that this decline continues for the rest of the year and through 2007. The
projection assumes that 2006 sales will be 6,450,000, a decline of 8.8 percent from the 2005 peak. It
assumes that sales will decline by another 13.2 percent to 5,600,000 in 2007.
Recession Looms for the U.S. Economy in 2007      7


FIGURE 3
New Housing Starts
              2,500

                                                                                2,068
                                                                     1,956
              2,000                                       1,848                           1,870
                                                                                                     1,670

                              1,457
              1,500                   1,354
  Thousands


                      1,288


              1,000


               500


                 0
                      1993    1994    1995                 2003      2004       2005      2006(p)   2007(p)


Source: Census Bureau, http://www.census.gov/const/www/quarterly_starts_completions.pdf

The projections in Figure 3 show year-round housing starts for 2006 totaling 1,870,000, a decline of
9.6 percent from the peak hit in 2005. The projections assume that housing starts will decline by
another 10.7 percent to 1,670,000 in 2007. It is likely that housing starts will decline further to the
range of 1.5 to 1.6 million in 2008, although overshooting could cause housing starts to fall below
this level for a period of time.

Housing has been important not only for its direct effect on the economy through the employment
of workers in the construction, real estate, and mortgage banking sector, it also has been important
through the effect of housing wealth on consumption. Homeowners have been borrowing against
their homes at a record pace. As a result, the nationwide ratio of home equity to home value stands
at a record low of 54.1 percent at the end of the second quarter of 2006. This ratio averaged close to
70 percent in the 60s, 70s, and 80s. This is remarkable since the unprecedented increase in house
prices over the last decade would be expected to lead a high ratio of equity to value (a rise in house
prices translates one to one into an increase in equity). Also, the nation’s demographics, with the
huge baby boom cohort nearing retirement, should be tilted toward having higher than normal ratios
of equity to value.
Recession Looms for the U.S. Economy in 2007                               8


FIGURE 4
Mortgage Equity Withdrawals
                           900
                                                                                     780.9
                           800

                           700                                              658.3            645.9
                                                         631.2
  Billions (annual rate)


                           600                   555.6

                           500
                                         404.5                                                                388.8
                           400                                                                        350.7            350.0
                                                                    308.0                                                         300.0
                           300
                                 219.6                                                                                                     225.0
                           200                                                                                                                        175.0
                                                                                                                                                               125.0
                           100                                                                                                                                            75.0


                             0
                                 1

                                         2

                                                 3

                                                         4


                                                                                           4

                                                                                                   1

                                                                                                            2
                                                                 1

                                                                          2

                                                                                  3


                                                                                                                        )

                                                                                                                                 )

                                                                                                                                            )

                                                                                                                                                     )

                                                                                                                                                                )

                                                                                                                                                                         )
                                                                                                                     (p

                                                                                                                              (p

                                                                                                                                         (p

                                                                                                                                                  (p

                                                                                                                                                             (p

                                                                                                                                                                      (p
                                0

                                        0

                                                0

                                                        0


                                                                                                 6:

                                                                                                          6:
                                                                                         5:
                                                               5:

                                                                        5:

                                                                                5:
                             20

                                     20

                                             20

                                                     20


                                                                                                  0

                                                                                                          0
                                                                0

                                                                        0

                                                                                 0

                                                                                         0


                                                                                                                  3

                                                                                                                              4

                                                                                                                                       1

                                                                                                                                                  2

                                                                                                                                                           3

                                                                                                                                                                      4
                                                                                               20

                                                                                                       20
                                                             20

                                                                     20

                                                                              20

                                                                                      20


                                                                                                                6:

                                                                                                                            6:

                                                                                                                                     7:

                                                                                                                                                7:

                                                                                                                                                         7:

                                                                                                                                                                    7:
                                                                                                                 0

                                                                                                                         0

                                                                                                                                     0

                                                                                                                                              0

                                                                                                                                                         0

                                                                                                                                                                  0
                                                                                                              20

                                                                                                                      20

                                                                                                                                  20

                                                                                                                                           20

                                                                                                                                                      20

                                                                                                                                                               20
Source: Federal Reserve Board, Flow of Funds, Table B.100 and NIPA, Table 5.3.5, line 19.

With house prices now falling, the number of homeowners who no longer have any equity against
which to borrow is increasing rapidly. This will substantially slow the growth in consumption, a
process that may have already begun in 2006. Limitations on the ability to borrow against home
equity may also explain the uptick in the growth rate of credit card debt. Credit card debt has grown
at a 10.1 percent annual rate from April through September after having grown at an average annual
rate of just 3.6 percent from 2002 through 2005.
Recession Looms for the U.S. Economy in 2007    9


Consumption 
Consumption has been the leading factor driving the economy in this business cycle. The
consumption share of GDP rose from 68.7 percent at the peak of the last cycle in 2000, to 70.3
percent of GDP in the third quarter of 2006. All components of consumption have expanded at a
healthy pace, as shown in Figure 5 but consumer durables have shown by far the most rapid pace of
growth. However, the strong reported growth in durable goods consumption is primarily the result
of falling computer prices leading to an increase in the real measure of durable goods. The share of
durable goods consumption in GDP has actually fallen slightly since 2000, dropping from 8.7
percent of GDP in 2000 to 8.1 percent in the third quarter of 2006. The shares of expenditure on
non-durable goods and services have both risen, more than offsetting this decline.

FIGURE 5
Consumption Spending
             145
                          GDP
             140          Consumption
             135          Durable Goods
                          Non-Durable Goods
             130          Services

             125
  2000=100


             120

             115

             110

             105

             100

              95

                   2000         2001      2002     2003         2004       2005      2006(p)      2007(p)
Source: Bureau of Economic Analysis and author’s projections.

The growing share of consumption in GDP was fueled by a drop in the savings rate. The wealth
effect from the stock bubble had already depressed the savings rate to a then post-war low of 1.8
percent in 2001 (it had averaged more than 8 percent in the 60s, 70s, and 80s). The savings rate has
continued to decline in the current decade due to the housing wealth effect.
Recession Looms for the U.S. Economy in 2007                              10


FIGURE 6
Savings Rate
                                 3.0
                                                   2.4
                                 2.5
                                                            2.1     2.0
                                 2.0       1.8
  Percent of Disposable Income


                                 1.5
                                                                                                                                                                                    1.1
                                 1.0                                                                                                                                      0.8
                                                                             0.6                                                                                 0.5
                                 0.5                                                                                                                  0.2
                                 0.0

                                 -0.5                                                  -0.3             -0.3     -0.3                        -0.2
                                                                                                                         -0.6    -0.5
                                 -1.0

                                 -1.5
                                                                                                -1.5
                                 -2.0
                                        1

                                                 2

                                                         3

                                                                  4

                                                                            1

                                                                                     2

                                                                                             3

                                                                                                     4

                                                                                                             1

                                                                                                                      2

                                                                                                                                  )

                                                                                                                                           )

                                                                                                                                                      )

                                                                                                                                                               )

                                                                                                                                                                          )

                                                                                                                                                                                   )
                                                                                                                               (p

                                                                                                                                        (p

                                                                                                                                                   (p

                                                                                                                                                            (p

                                                                                                                                                                       (p

                                                                                                                                                                                (p
                                       0

                                               0

                                                        0

                                                                0


                                                                                           5:

                                                                                                   5:

                                                                                                           6:

                                                                                                                    6:
                                                                          5:

                                                                                   5:
                                    20

                                            20

                                                     20

                                                             20

                                                                         0

                                                                                   0

                                                                                            0

                                                                                                    0

                                                                                                            0

                                                                                                                     0

                                                                                                                            3

                                                                                                                                        4

                                                                                                                                                 1

                                                                                                                                                            2

                                                                                                                                                                     3

                                                                                                                                                                                4
                                                                      20

                                                                                20

                                                                                         20

                                                                                                 20

                                                                                                         20

                                                                                                                  20

                                                                                                                          6:

                                                                                                                                      6:

                                                                                                                                               7:

                                                                                                                                                          7:

                                                                                                                                                                   7:

                                                                                                                                                                              7:
                                                                                                                           0

                                                                                                                                   0

                                                                                                                                               0

                                                                                                                                                        0

                                                                                                                                                                   0

                                                                                                                                                                            0
                                                                                                                        20

                                                                                                                                20

                                                                                                                                            20

                                                                                                                                                     20

                                                                                                                                                                20

                                                                                                                                                                         20
Source: Bureau of Economic Analysis and author’s projections.

With millions of homeowners reaching the limits of their ability to borrow, the savings rate will
begin to rise in 2007 back towards more normal levels. As the savings rate continues to rise in 2008
and 2009, consumption growth will trail the growth in disposable income. The resetting of $3 trillion
in adjustable rate mortgages at substantially higher interest rates will also reduce income available for
consumption.
Recession Looms for the U.S. Economy in 2007     11


Investment 
Investment growth has been relatively weak thus far in this recovery. (Investment growth was
somewhat overstated in the 90s by the growth of car leasing. A leased car counts as an investment
by the leasing company. A purchased car appears in consumption.) One of the main reasons was
that the economy had sustained a very high level of investment in the late 90s as a result of the tech
bubble. This led to overinvestment in large segments of the economy, and also created a relatively
high starting point. Two other factors have also depressed investment. The housing bubble has
pulled resources (construction workers and material) away from non-residential construction. As a
result, a backlog of demand for non-residential structures accumulated over the last few years. The
other factor depressing investment is the trade deficit. With demand for manufactured goods
increasingly being filled by imports, many industries are investing in other countries rather than
domestically.

As the economy slows, the pace of growth of investment is likely to slow as well. This slowdown
was already showing up in equipment and software investment in 2006. Growth in the second and
third quarters averaged just 2.5 percent. Non-residential investment actually picked up sharply in the
second and third quarters of the year as resources were finally freed up from residential
construction. However, this burst will be relatively short-lived as the backlog of demand in the non-
residential sector will be quickly filled. (Non-residential construction rose at a 20.3 percent annual
rate in the second quarter. It rose at a 14.3 percent rate in the third quarter.) Investment growth in
both categories will average close to two percent in 2007.

FIGURE 7
Investment Spending
             120
                          GDP
             115          Non-Residential Investment
                          Structures
             110          Equipment and Software

             105
  2000=100


             100

              95

              90

              85

              80

              75


                   2000         2001        2002       2003       2004        2005       2006(p)     2007(p)
Source: Bureau of Economic Analysis and author’s projections.
Recession Looms for the U.S. Economy in 2007     12


Exports and Imports   
The high value of the dollar has led to rapid growth in the trade deficit over the course of the
business cycle. In the last two years, the size of the nominal deficit has been inflated due to the sharp
jump in oil prices. With the economy weakening, real imports will fall by close to 2 percent in 2007.
While exports of end products are likely to continue to grow at close to their current pace, a growing
share of U.S. exports are intermediate goods for products that are later imported back into the
United States. With imports falling, this will reduce the demand for exports of intermediate goods.
This should cause the growth of total exports to fall back to around 4.0 percent. On net, the
reduction in imports and the increase in exports will add approximately 0.7 percentage points to
GDP growth.

FIGURE 8
Exports and Imports
             135
                          GDP
             130
                          Exports
             125          Imports

             120

             115
  2000=100


             110

             105

             100

              95

              90

              85


                   2000    2001        2002         2003        2004       2005       2006(p)     2007(p)
Source: Bureau of Economic Analysis and author’s projections.
Recession Looms for the U.S. Economy in 2007   13


FIGURE 9
Exports, Imports, and Trade Balance
                        2,500
                                       Trade Balance
                                       Exports
                        2,000
                                       Imports

                        1,500
  Billions of dollars


                        1,000


                         500


                           0


                        -500


                 -1,000


                                2000      2001         2002   2003        2004        2005       2006(p)     2007(p)
Source: Bureau of Economic Analysis and author’s projections.

The rise in exports and decline in imports will produce a modest improvement in the trade deficit.
The decline in real imports of two percent, coupled with a three percent rise in import prices will
lead to an increase in nominal imports of one percent, or just over $20 billion. Export prices will rise
by 2.0 percent, which will lead to an increase in the nominal value of exports of 6.6 percent or
approximately $90 billion. This will lead to a net improvement in the trade deficit of $70 billion by
the 4th quarter of 2007, as shown in Figure 9.
Recession Looms for the U.S. Economy in 2007    14


Government Spending  
Government spending is likely to make somewhat more of a contribution to GDP growth in 2007,
primarily due to the relatively rapid growth of state and local spending. State and local spending had
grown very slowly from 2002 to 2005 as many states were in a weak financial situation following the
recession. However, state and local finances are considerably stronger in most areas and there is
backlog of unmet demands. While tax collections may slow over the course of 2007, appropriations
will have been made when the budget situation was relatively strong. State and local spending will
grow by 3.0 percent in 2007.

The growth of federal spending is likely to slow due to pressures to limit the size of the deficit and
possibly some reduction in the size of the forces occupying Iraq. Federal spending will grow at a 0.7
percent rate in 2007, with real defense spending increasing by 0.2 percent and non-defense spending
rising at a 1.8 percent rate. This will lead to an overall increase in government spending of 2.2
percent.

The decline in GDP will lead to a substantial drop in tax revenues. As result, the deficit in fiscal year
2007 will be $370 billion. It will rise to $460 billion in fiscal year 2008.

FIGURE 10
Government Spending
               135
                            GDP
               130          Government Spending
                            Federal
               125          Defense
                            State and Local
               120
    2000=100


               115

               110

               105

               100

                95


                     2000      2001       2002     2003         2004      2005       2006(p)    (2007(p)


Source: Bureau of Economic Analysis and author’s projections.


Recession Looms for the U.S. Economy in 2007   15


Job Growth  

The rate of job growth has slowed sharply over the course of 2006. The economy was creating jobs
at a healthy rate of 230,000 per month in 2005.3 In three months ending in October 2006, job
creation averaged 157,000. Job growth in the private sector averaged just 119,000 over this period.
This rate is virtually certain to slow sharply in the months ahead. Thus far the slowdown in
construction has led to almost no falloff in employment in the construction sector. Similarly,
employment in real estate is still at its peak levels, even though sales of new and existing homes are
both down by close to 15 percent on a year over year basis. Clearly employment levels in these and
other housing related sectors will soon adjust to the falloff in demand.

As consumption growth falls off, there will be reduction in employment growth in other sectors.
This downturn is already visible in manufacturing, which has lost 55,000 jobs from July to October.
Retail trade has also been shedding jobs, with employment down by 63,000 year over year. Much of
this job decline is attributable to consolidation within the industry, but it is likely that slower demand
growth will lead to continuing job losses even as the impact of the consolidation diminishes. Slower
consumption growth will likely also curtail the growth in employment in restaurants, a sector that
added 292,000 jobs over the last year. The health care sector, which added 300,000 jobs in the last
year, is likely to sustain a healthy pace of job growth, as is the government sector, which added
230,000 jobs.

Over the course of the year, the economy will shed 1.2 million jobs. The greatest job loss will be the
housing related sectors, construction, real estate, and mortgage banking, but most sectors are likely
to be affected by the drop in output.


3   This includes the addition of 810,000 jobs from the Bureau of Labor Statistics benchmark revision to the
    establishment survey.
Recession Looms for the U.S. Economy in 2007                                16


FIGURE 11
Jobs (Establishment Survey)
              138


              136


              134
   Millions


              132


              130


              128


              126


                             2000           2001             2002             2003                     2004                 2005            2006(p)              2007(p)
Source: Bureau of Labor Statistics and author’s projections.


FIGURE 12
Unemployment Rate
              6.5
                                                                                                                                                                 6.2
                                                    6.0
              6.0                          5.8                                                                                                         5.8
                                                             5.5
              5.5                                                                                                                           5.4
                                                                      5.1
                                                                                                                                  5.0
              5.0                                                                  4.8
  Percent


                                4.7                                                                          4.7       4.7
                                                                                                4.6
              4.5
                       4.0
              4.0


              3.5


              3.0
                                                                              1

                                                                                           2

                                                                                                        3
                    0

                              1

                                      2

                                                 3

                                                          4

                                                                    5


                                                                                                                      p)

                                                                                                                                p)

                                                                                                                                           p)

                                                                                                                                                     p)

                                                                                                                                                                p)
                                                                               :

                                                                                            :

                                                                                                         :
                   0

                            0

                                       0

                                                0

                                                         0

                                                                  0

                                                                            06

                                                                                         06

                                                                                                      06


                                                                                                                   4(

                                                                                                                             1(

                                                                                                                                        2(

                                                                                                                                                  3(

                                                                                                                                                             4(
                20

                         20

                                    20

                                             20

                                                      20

                                                               20


                                                                                                                 :

                                                                                                                              :

                                                                                                                                        :

                                                                                                                                                   :

                                                                                                                                                             :
                                                                                                              06

                                                                                                                           07

                                                                                                                                     07

                                                                                                                                                07

                                                                                                                                                          07


Source: Bureau of Labor Statistics and author’s projections.
Recession Looms for the U.S. Economy in 2007   17


FIGURE 13
Nominal Wage Growth (3-month average, annual rate)
            5.0

            4.5

            4.0

            3.5

            3.0
  Percent


            2.5

            2.0

            1.5

            1.0

            0.5

            0.0


                  2000      2001         2002          2003         2004         2005        2006(p)     2007(p)


Source: Bureau of Labor Statistics and author’s projections.

With slower job growth, the unemployment rate will begin to rise, which will in turn weaken the
labor market and lead to slower wage growth. Unemployment will begin rising by the end of 2006.
(The 4.4 percent figure for October was probably somewhat of a fluke.) By the end of 2007, the
unemployment rate will be over 6.0 percent. Wage growth will slow from its current level of 4.0
percent to under 3.0 percent by the end of 2007. For the calendar year, it will average 3.4 percent.
Recession Looms for the U.S. Economy in 2007    18


Inflation 
There will be important forces pushing inflation in opposite directions in 2007. The higher
unemployment rate and resulting downward pressure on wage growth will help to ameliorate
inflation. Similarly, the oversupply of housing and the record high vacancy rates will lead to
downward pressure on rents. The rental components account for more than 30 percent of the
overall consumer price index and almost 40 percent of the core index, so a slower rate of rental
inflation will have a substantial impact on the overall index.

Figure 14
Inflation – CPI (3-month average, annual rate)
            8.0
                          Overall CPI
                          Core CPI
            6.0           Rental Inflation


            4.0
  Percent


            2.0


            0.0


            -2.0


            -4.0


                   2000         2001         2002    2003         2004        2005       2006(p)     2007(p)
Source: Bureau of Labor Statistics and author’s projections.

On the other side, productivity growth has slowed sharply over the last year. Productivity rose by
just 1.3 percent from the third quarter of 2005 through the third quarter of 2006. This is down from
a growth rate of more than three percent in 2001-2004. This number will be revised down by
approximately 0.2 percentage points after the benchmark revision to the establishment survey. In
addition to slower productivity growth, import prices are likely to stay on an upward path in 2007.
Non-oil import prices had been falling earlier in this cycle. However, with most other economies
growing rapidly and the dollar falling at least modestly against other currencies, we are likely to see
some further increase in the inflation rate in non-oil imports.

On net, the inflation rate is likely to moderate slightly in 2007 as the impact of slower wage growth
and rental inflation more than offsets the impact of slower productivity growth and higher inflation
in import prices. The core and overall CPI inflation rate should both average 2.6 percent over the
year, with both easing downward from their current rates over the course of the year. Rental
inflation is likely to end the year at just over 2.0 percent, driven down by the record high vacancy
rate.
Recession Looms for the U.S. Economy in 2007   19


Interest Rates and the Dollar 
The Fed will be torn between the desire to slow inflation, which will remain slightly above its target
range, and the need to boost the economy. (The risk of inflation is likely to appear somewhat worse
with the apparent slowing of productivity growth to just 1.0 percent over the last year. While this
effect may be largely cyclical, slower productivity growth will reduce the extent to which higher costs
can be absorbed by business without either experiencing a loss in profits or raising prices.) With the
economy’s weakness becoming evident by the end of the year, the Fed is likely to begin lowering
rates no later than its first meeting in January. However, just as raising the Federal Funds rate had
little impact on the 10-year treasury rate, lowering the Federal Funds rate is likely to have little effect
in lowering rates, especially in a context in which the bond market seems to have already anticipated
a drop in interest rates.

By the end of the year, the Fed will likely have lowered the Federal Funds rate to close to 4.0
percent. However, investors are likely to be more concerned about the prospects of a falling dollar
as rising interest rates in Europe, Japan and elsewhere make foreign currencies more attractive. For
this reason, the short-term and long-term rates will move in opposite directions. The 10-year
treasury rate is likely to end the year close to 5.2 percent, which would still be relatively low by
historical standards in both nominal and real terms.

Both the euro and the yen will appreciate modestly against the dollar, with the dollar worth 0.77
euros and 105 yen by the end of the year. This analysis assumes only modest appreciation of the
yuan (about 2 percent) against the dollar. If the Chinese government allows for more rapid
appreciation, then long-term interest rates in the United States could be considerably higher.

After 2007  
The ability of the economy to recover from the 2007 recession will depend both on how quickly the
imbalances are corrected (the housing bubble and the over-valued dollar) and the direction of the
policy response. The Federal Reserve Board will have to choose whether to fight the risk of inflation
associated with a declining dollar (which is essential for correcting the trade imbalance) or whether
to provide stimulus to counterattack the slump brought on by the collapse of the housing bubble.
Since there may be no consensus for either path, it is very possible that it will end up in an
intermediate position where it lowers interest rates modestly, but does not act to aggressively
counteract the slump.

Fiscal policy could be subject to a similar paralysis. It would be reasonable for Congress to enact a
stimulus package including tax cuts and/or spending measures to counteract the slump; however,
concern over the size of the deficit could prevent effective action. If political factors prevent
effective monetary and fiscal measures, then a slump caused by the collapse of the housing bubble
could be prolonged considerably.

Contenu connexe

Tendances

The Global Economy No. 7 - October 31, 2011
The Global Economy No. 7 -  October 31, 2011The Global Economy No. 7 -  October 31, 2011
The Global Economy No. 7 - October 31, 2011Swedbank
 
Final ppt eco
Final ppt ecoFinal ppt eco
Final ppt ecoatme007
 
sub prime mortgage crisis
sub prime mortgage crisissub prime mortgage crisis
sub prime mortgage crisisisanox98
 
May 2010 market update presetation
May  2010 market update presetationMay  2010 market update presetation
May 2010 market update presetationWeichert Realtors
 
The Subprime Crisis
The Subprime CrisisThe Subprime Crisis
The Subprime Crisiskayaltribdu
 
This Month in Real Estate August 2011
This Month in Real Estate August 2011This Month in Real Estate August 2011
This Month in Real Estate August 2011pdrury
 
2008_Past Economic Downturns and the Outlook for Foundation Giving_Steven Law...
2008_Past Economic Downturns and the Outlook for Foundation Giving_Steven Law...2008_Past Economic Downturns and the Outlook for Foundation Giving_Steven Law...
2008_Past Economic Downturns and the Outlook for Foundation Giving_Steven Law...Steven Lawrence
 
Changes in U.S. Family Finances from 2007 to 2010 - Federal Reserve
Changes in U.S. Family Finances from 2007 to 2010 - Federal ReserveChanges in U.S. Family Finances from 2007 to 2010 - Federal Reserve
Changes in U.S. Family Finances from 2007 to 2010 - Federal ReserveThe Fiscal Times
 
Subprime Crisis(Brief)
Subprime Crisis(Brief)Subprime Crisis(Brief)
Subprime Crisis(Brief)Rohan Negi
 
A Quarterly Economic Update March 2010
A Quarterly Economic Update March 2010A Quarterly Economic Update March 2010
A Quarterly Economic Update March 2010Mercatus Center
 
A Quarterly Economic Update March 2010
A Quarterly Economic Update March 2010A Quarterly Economic Update March 2010
A Quarterly Economic Update March 2010Mercatus Center
 
Currency wars
Currency warsCurrency wars
Currency warsFIT Group
 

Tendances (18)

Late 2000s recession
Late 2000s recessionLate 2000s recession
Late 2000s recession
 
The Global Economy No. 7 - October 31, 2011
The Global Economy No. 7 -  October 31, 2011The Global Economy No. 7 -  October 31, 2011
The Global Economy No. 7 - October 31, 2011
 
Final ppt eco
Final ppt ecoFinal ppt eco
Final ppt eco
 
February 2016 Realtor Report
February 2016 Realtor ReportFebruary 2016 Realtor Report
February 2016 Realtor Report
 
sub prime mortgage crisis
sub prime mortgage crisissub prime mortgage crisis
sub prime mortgage crisis
 
May 2010 market update presetation
May  2010 market update presetationMay  2010 market update presetation
May 2010 market update presetation
 
Straight Forward Autumn 2016
Straight Forward Autumn 2016Straight Forward Autumn 2016
Straight Forward Autumn 2016
 
The Subprime Crisis
The Subprime CrisisThe Subprime Crisis
The Subprime Crisis
 
Asset Price Bubbles
Asset Price BubblesAsset Price Bubbles
Asset Price Bubbles
 
This Month in Real Estate August 2011
This Month in Real Estate August 2011This Month in Real Estate August 2011
This Month in Real Estate August 2011
 
2008_Past Economic Downturns and the Outlook for Foundation Giving_Steven Law...
2008_Past Economic Downturns and the Outlook for Foundation Giving_Steven Law...2008_Past Economic Downturns and the Outlook for Foundation Giving_Steven Law...
2008_Past Economic Downturns and the Outlook for Foundation Giving_Steven Law...
 
Changes in U.S. Family Finances from 2007 to 2010 - Federal Reserve
Changes in U.S. Family Finances from 2007 to 2010 - Federal ReserveChanges in U.S. Family Finances from 2007 to 2010 - Federal Reserve
Changes in U.S. Family Finances from 2007 to 2010 - Federal Reserve
 
Olympian Oct2012
Olympian Oct2012Olympian Oct2012
Olympian Oct2012
 
2011 july-17
2011 july-172011 july-17
2011 july-17
 
Subprime Crisis(Brief)
Subprime Crisis(Brief)Subprime Crisis(Brief)
Subprime Crisis(Brief)
 
A Quarterly Economic Update March 2010
A Quarterly Economic Update March 2010A Quarterly Economic Update March 2010
A Quarterly Economic Update March 2010
 
A Quarterly Economic Update March 2010
A Quarterly Economic Update March 2010A Quarterly Economic Update March 2010
A Quarterly Economic Update March 2010
 
Currency wars
Currency warsCurrency wars
Currency wars
 

En vedette

Advisor Jumpstart: JavaScript
Advisor Jumpstart: JavaScriptAdvisor Jumpstart: JavaScript
Advisor Jumpstart: JavaScriptdominion
 
Sé Tú Un Ejemplo Gordon B Hinckley
Sé Tú Un Ejemplo   Gordon B HinckleySé Tú Un Ejemplo   Gordon B Hinckley
Sé Tú Un Ejemplo Gordon B Hinckleyinstitutoaltabix
 
Post globe robert gow
Post globe robert gowPost globe robert gow
Post globe robert gowONEIA
 
Developing Interactive Applications Using Windows Live Robots, Activities, an...
Developing Interactive Applications Using Windows Live Robots, Activities, an...Developing Interactive Applications Using Windows Live Robots, Activities, an...
Developing Interactive Applications Using Windows Live Robots, Activities, an...goodfriday
 
Imagen Institucional
Imagen InstitucionalImagen Institucional
Imagen InstitucionalCML
 
Revision Exercise (A) Answers Section B
Revision Exercise (A) Answers Section BRevision Exercise (A) Answers Section B
Revision Exercise (A) Answers Section Bbenpooi
 
Gu Agency Presentation
Gu Agency PresentationGu Agency Presentation
Gu Agency Presentationsbamossy
 
Welcome To Moodle 1.9
Welcome To Moodle 1.9Welcome To Moodle 1.9
Welcome To Moodle 1.9Roger Gardner
 
09 08 25 Web 2.0 Weekly
09 08 25 Web 2.0 Weekly09 08 25 Web 2.0 Weekly
09 08 25 Web 2.0 WeeklyDavid Shore
 

En vedette (12)

Advisor Jumpstart: JavaScript
Advisor Jumpstart: JavaScriptAdvisor Jumpstart: JavaScript
Advisor Jumpstart: JavaScript
 
Sé Tú Un Ejemplo Gordon B Hinckley
Sé Tú Un Ejemplo   Gordon B HinckleySé Tú Un Ejemplo   Gordon B Hinckley
Sé Tú Un Ejemplo Gordon B Hinckley
 
Post globe robert gow
Post globe robert gowPost globe robert gow
Post globe robert gow
 
Developing Interactive Applications Using Windows Live Robots, Activities, an...
Developing Interactive Applications Using Windows Live Robots, Activities, an...Developing Interactive Applications Using Windows Live Robots, Activities, an...
Developing Interactive Applications Using Windows Live Robots, Activities, an...
 
Rfc5849aut
Rfc5849autRfc5849aut
Rfc5849aut
 
Imagen Institucional
Imagen InstitucionalImagen Institucional
Imagen Institucional
 
Revision Exercise (A) Answers Section B
Revision Exercise (A) Answers Section BRevision Exercise (A) Answers Section B
Revision Exercise (A) Answers Section B
 
Gu Agency Presentation
Gu Agency PresentationGu Agency Presentation
Gu Agency Presentation
 
Welcome To Moodle 1.9
Welcome To Moodle 1.9Welcome To Moodle 1.9
Welcome To Moodle 1.9
 
Effective ui
Effective uiEffective ui
Effective ui
 
09 08 25 Web 2.0 Weekly
09 08 25 Web 2.0 Weekly09 08 25 Web 2.0 Weekly
09 08 25 Web 2.0 Weekly
 
Inf3240122
Inf3240122Inf3240122
Inf3240122
 

Similaire à Eco

THE HOUSING MARKETGreat RecessionMortgage collapseHigh i.docx
THE HOUSING MARKETGreat RecessionMortgage collapseHigh i.docxTHE HOUSING MARKETGreat RecessionMortgage collapseHigh i.docx
THE HOUSING MARKETGreat RecessionMortgage collapseHigh i.docxrtodd33
 
State of the Construction & Surety Industry (2006 2007)
State of the Construction & Surety Industry (2006 2007)State of the Construction & Surety Industry (2006 2007)
State of the Construction & Surety Industry (2006 2007)The Vertex Companies, LLC
 
State of the construction industry (2006 2007)
State of the construction industry (2006 2007)State of the construction industry (2006 2007)
State of the construction industry (2006 2007)Lisa Dehner
 
NABE - Current Outlook for the California Housing Market
NABE -   Current Outlook for the California Housing MarketNABE -   Current Outlook for the California Housing Market
NABE - Current Outlook for the California Housing Marketcaesar7
 
US Real Estate Housing Market: A Case For Reasonable Optimisim?
US Real Estate Housing Market:   A Case For Reasonable Optimisim?US Real Estate Housing Market:   A Case For Reasonable Optimisim?
US Real Estate Housing Market: A Case For Reasonable Optimisim?Markets Beyond
 
Federal Reserve housing white paper
Federal Reserve housing white paperFederal Reserve housing white paper
Federal Reserve housing white paperBruce Judson
 
Newsletter Fall 2008
Newsletter Fall 2008Newsletter Fall 2008
Newsletter Fall 2008Dan Flanagan
 
Wells Market Outlook 09 09
Wells Market Outlook 09 09Wells Market Outlook 09 09
Wells Market Outlook 09 09johnhaag
 
Journal of Aging & Social Policy, 22117–128, 2010Copyright .docx
Journal of Aging & Social Policy, 22117–128, 2010Copyright .docxJournal of Aging & Social Policy, 22117–128, 2010Copyright .docx
Journal of Aging & Social Policy, 22117–128, 2010Copyright .docxpriestmanmable
 
State of the Construction and Surety Industry Report (2009)
State of the Construction and Surety Industry Report (2009)State of the Construction and Surety Industry Report (2009)
State of the Construction and Surety Industry Report (2009)Lisa Dehner
 
State of the Construction and Surety Industry Report (2009)
State of the Construction and Surety Industry Report (2009)State of the Construction and Surety Industry Report (2009)
State of the Construction and Surety Industry Report (2009)The Vertex Companies, LLC
 
Oct./2005-Jan/2006--Economic Report FY2006 Q1-Q2 (Full Report)
Oct./2005-Jan/2006--Economic Report FY2006 Q1-Q2 (Full Report)Oct./2005-Jan/2006--Economic Report FY2006 Q1-Q2 (Full Report)
Oct./2005-Jan/2006--Economic Report FY2006 Q1-Q2 (Full Report)EconReport
 
Sub prime & eurozone crisis
Sub prime & eurozone crisisSub prime & eurozone crisis
Sub prime & eurozone crisisSiddhant Agarwal
 
RICS UK Economy and Property Market Chart Book - December 2015
RICS UK Economy and Property Market Chart Book - December 2015RICS UK Economy and Property Market Chart Book - December 2015
RICS UK Economy and Property Market Chart Book - December 2015George Marcou
 
Why Baby Boomers Will Need To Work Longer
Why Baby Boomers Will Need To Work LongerWhy Baby Boomers Will Need To Work Longer
Why Baby Boomers Will Need To Work Longerlalitranka
 

Similaire à Eco (20)

THE HOUSING MARKETGreat RecessionMortgage collapseHigh i.docx
THE HOUSING MARKETGreat RecessionMortgage collapseHigh i.docxTHE HOUSING MARKETGreat RecessionMortgage collapseHigh i.docx
THE HOUSING MARKETGreat RecessionMortgage collapseHigh i.docx
 
State of the Construction & Surety Industry (2006 2007)
State of the Construction & Surety Industry (2006 2007)State of the Construction & Surety Industry (2006 2007)
State of the Construction & Surety Industry (2006 2007)
 
State of the construction industry (2006 2007)
State of the construction industry (2006 2007)State of the construction industry (2006 2007)
State of the construction industry (2006 2007)
 
NABE - Current Outlook for the California Housing Market
NABE -   Current Outlook for the California Housing MarketNABE -   Current Outlook for the California Housing Market
NABE - Current Outlook for the California Housing Market
 
US Real Estate Housing Market: A Case For Reasonable Optimisim?
US Real Estate Housing Market:   A Case For Reasonable Optimisim?US Real Estate Housing Market:   A Case For Reasonable Optimisim?
US Real Estate Housing Market: A Case For Reasonable Optimisim?
 
Federal Reserve housing white paper
Federal Reserve housing white paperFederal Reserve housing white paper
Federal Reserve housing white paper
 
HOUSING.pptx
HOUSING.pptxHOUSING.pptx
HOUSING.pptx
 
Newsletter Fall 2008
Newsletter Fall 2008Newsletter Fall 2008
Newsletter Fall 2008
 
October Housing Report for Southwest California
October Housing Report for Southwest CaliforniaOctober Housing Report for Southwest California
October Housing Report for Southwest California
 
Wells Market Outlook 09 09
Wells Market Outlook 09 09Wells Market Outlook 09 09
Wells Market Outlook 09 09
 
George perendia
George perendiaGeorge perendia
George perendia
 
Journal of Aging & Social Policy, 22117–128, 2010Copyright .docx
Journal of Aging & Social Policy, 22117–128, 2010Copyright .docxJournal of Aging & Social Policy, 22117–128, 2010Copyright .docx
Journal of Aging & Social Policy, 22117–128, 2010Copyright .docx
 
2000 Recession
2000 Recession2000 Recession
2000 Recession
 
State of the Construction and Surety Industry Report (2009)
State of the Construction and Surety Industry Report (2009)State of the Construction and Surety Industry Report (2009)
State of the Construction and Surety Industry Report (2009)
 
State of the Construction and Surety Industry Report (2009)
State of the Construction and Surety Industry Report (2009)State of the Construction and Surety Industry Report (2009)
State of the Construction and Surety Industry Report (2009)
 
Oct./2005-Jan/2006--Economic Report FY2006 Q1-Q2 (Full Report)
Oct./2005-Jan/2006--Economic Report FY2006 Q1-Q2 (Full Report)Oct./2005-Jan/2006--Economic Report FY2006 Q1-Q2 (Full Report)
Oct./2005-Jan/2006--Economic Report FY2006 Q1-Q2 (Full Report)
 
Sub prime & eurozone crisis
Sub prime & eurozone crisisSub prime & eurozone crisis
Sub prime & eurozone crisis
 
Great Recession
Great RecessionGreat Recession
Great Recession
 
RICS UK Economy and Property Market Chart Book - December 2015
RICS UK Economy and Property Market Chart Book - December 2015RICS UK Economy and Property Market Chart Book - December 2015
RICS UK Economy and Property Market Chart Book - December 2015
 
Why Baby Boomers Will Need To Work Longer
Why Baby Boomers Will Need To Work LongerWhy Baby Boomers Will Need To Work Longer
Why Baby Boomers Will Need To Work Longer
 

Eco

  • 1.     Recession Looms for the   U.S. Economy in 2007     Dean Baker    November 2006   Center for Economic and Policy Research  1611 Connecticut Avenue, NW, Suite 400  Washington, D.C. 20009  Tel: 202‐293‐5380  Fax:202‐588‐1356  www.cepr.net 
  • 2. Recession Looms for the U.S. Economy in 2007 ii Contents  Introduction.......................................................................................................................................... 1 Overview ............................................................................................................................................... 1 Housing ................................................................................................................................................. 5 Consumption ........................................................................................................................................ 9 Investment .......................................................................................................................................... 11 Exports and Imports ......................................................................................................................... 12 Government Spending ...................................................................................................................... 14 Job Growth ......................................................................................................................................... 15 Inflation ............................................................................................................................................... 18 Interest Rates and the Dollar............................................................................................................ 19 After 2007 ........................................................................................................................................... 19 About the Author Dean Baker is Co-Director at the Center for Economic and Policy Research in Washington, DC.
  • 3. Recession Looms for the U.S. Economy in 2007 1 Introduction  The recovery that began in November of 2001 is likely to come to an end in 2007. The main factor pushing the economy into recession will be weakness in the housing market. The housing market had been the primary fuel for the recovery until the last year, as there was an unprecedented run-up in house prices since 1997. With prices now headed downward, construction and home sales have dropped off by almost 20 percent against year ago levels. Even more importantly, borrowing against home equity, which had been the main factor fueling consumption growth, will plummet as many homeowners lack any further equity to borrow against. The result will be a downturn in consumption spending, which together with plunging housing investment, will likely push the economy into recession. The economy will see a substantial net loss of jobs, with nominal wage growth slowing as the labor market weakens over the course of the year. Overview   This recovery has been fueled to a very large extent by a housing bubble, just as the second half of the nineties cycle was fueled by a stock bubble. Since 1997, average house prices have risen by more than 50 percent, after adjusting for inflation. Historically, house prices have moved at approximately the same pace as the overall rate of inflation.1 This unprecedented run-up has not been associated with extraordinary population or income growth, both of which have been below their average pace for the post-war years since 2000. It is also not associated with any new restrictions on supply, as housing construction was at near record levels over the period 2003-2005. The run-up in house sale prices was also not associated with any extraordinary increase in rents, which rose only slightly more rapidly than the overall rate of inflation over this period. In short, the run-up in house prices cannot be explained except as a speculative bubble. This bubble fueled the economy directly through its impact on the housing sector and indirectly through the impact that housing wealth had on consumption. Housing construction and sales account for more than six percent of GDP. The run-up in prices has led to a near doubling of sales of new and existing homes since the mid-nineties. It has also led to record nationwide vacancy rates for both rental and owner occupied housing. In past downturns housing investment has fallen by 30-40 percent. The sector has never seen as much overbuilding as it has experienced in the current cycle. Also, with the huge baby boom cohort now entering its retirement years, demand for housing should be shrinking relative to the size of the population in the years ahead. Based on past patterns, it is reasonable to expect a drop in output in the housing sector from its 2005 peaks of at least 40 percent. It should reach this bottom by the end of 2007 or early 2008 at the latest. The wealth effect created by the housing bubble fueled an extraordinary surge in consumption over the last five years, as savings actually turned negative. (The country’s demographics, with most of the baby boom cohort still in its prime saving years, is heavily tilted toward saving.) The run-up in prices 1 Background data on the housing bubble can be found in Baker, D., 2005, “The Housing Bubble Fact Sheet,” Center for Economic and Policy Research [http://www.cepr.net/publications/housing_fact_2005_07.pdf] and Baker, D., 2006, “Is the Housing Bubble Collapsing? Ten Economic Indicators to Watch” Center for Economic and Policy Research [http://www.cepr.net/publications/housing_indicators_2006_06.pdf].
  • 4. Recession Looms for the U.S. Economy in 2007 2 created $5 trillion in excess housing wealth. Conventional estimates of the size of the housing wealth effect imply that this wealth would have generated an additional $200-$300 billion of consumption (1.6-2.3 percent of GDP). It is plausible that the impact of this bubble wealth was actually considerably larger than the conventional estimates imply. Historically, the saving rate in the United States had averaged close to eight percent of disposable income. The savings rate began to decline sharply in the nineties, at least partially in response to the stock bubble, although other factors likely played a role. However, even assuming a baseline savings rate of just four percent, the current rate of -1 percent implies an amount of excess consumption of almost $480 billion annually, given current income levels. This higher figure is consistent with data showing that households were borrowing more than $600 billion annually against their home equity in 2005. This home equity-fueled consumption will be sharply curtailed in the near future. In spite of the record run-up in house prices, the ratio of homeowners’ equity to market value stood at a record low in the second quarter of 2006. (This is especially striking since the baby boom cohort is now ages 42-60 and would be expected to have accumulated considerable equity in their homes.) With house prices now falling, the number of homeowners who have exhausted the ability to borrow against their home will rise rapidly. A sharp run-up in credit card debt earlier this year provides evidence that this is already happening, as people who were unable to borrow against their homes likely turned to their credit cards. However, credit card borrowing cannot replace borrowing against home equity (the volume of outstanding credit card debt is less than one tenth of the volume of mortgage debt); millions of homeowners will soon be forced to curtail their consumption as home prices decline. Homeowners will also be hit by the resetting of more than $2 trillion in adjustable rate mortgages in 2006 and 2007. While most homeowners in the United States have generally opted for fixed rate mortgages, adjustable rate mortgages have become far more popular in the last five years. This is especially striking, since the mortgage rate available on fixed rate mortgages was at its lowest level in fifty years. Presumably, homebuyers opted for adjustable rate mortgages to take advantage of the lower starting rate. Typically, this rate is locked in for a period of three years. More than 30 percent of the mortgages issued in 2003 and 2004 had adjustable rates, which were record years for mortgage financing. The lock-in period on these mortgages is ending in 2006-07. In many cases the interest rate is resetting upward by close to two percentage points. This will be a major strain for many homeowners who were already struggling to meet mortgage payments on over-priced houses. Some homeowners will be unable to meet these higher payments and forced to sell, putting further downward pressure on the housing market. There also will be an increase in default rates, as many homeowners will be unable to meet mortgage payments and unable or unwilling to sell their homes. The rise in defaults will put severe strains on the portions of the financial industry that hold large amounts of mortgage debt. The turnaround in the housing market has already begun to affect the economy. There was a marked slowdown in consumption growth beginning in the second quarter, which has continued into the third quarter according to currently available data. At the least, it seems that the savings rate is no longer declining. It is likely to begin rising in the near future, and will almost certainly have moved into positive territory by early 2007. This means that consumption growth will be trailing income growth.
  • 5. Recession Looms for the U.S. Economy in 2007 3 With the housing and consumer sectors both showing weakness, there is little prospect that growth in other sectors will be able to offset this drag on growth. The continuing large budget deficits rule out any substantial boosts to government spending or further tax cuts. State and local governments are in better financial shape, but this is driven in part by higher property tax collections, which in turn are based on the run-up in house prices. With house prices moving downward in many areas, tax collections are likely to fall in the near future also. Investment spending has weakened in recent months, following the slower growth in consumption. Measures of capacity utilization have already fallen substantially from the not very high levels reached in the spring. While investment growth may stay positive in 2007, it is likely to be slower than it was in 2005 and the beginning of 2006. It will provide little offset to the downturn in housing and consumption. TABLE 1 Summary Predictions 4th Quarter 2006 ― 4th Quarter 2007 GDP Growth -0.7% Job Growth -1.2 million Nominal Wage Growth 3.4 percent Inflation (CPI) 2.6 percent Core Inflation (CPI) 2.6 percent Inflation (GDP Deflator) 2.4 percent Residential Construction -12.0 percent Consumption -1.2 percent Investment 2.0 percent Exports 4.0 percent Imports -2.0 percent Government Expenditures 2.0 percent Government Budget Deficit (Fiscal ’07) $370 billion Trade Deficit $750 billion Existing Home Sales 5,600,000 Housing Starts 1,670,000 End of Period Unemployment Rate 6.3 percent Federal Funds Rate 4.00 percent 10-Year Treasury 5.20 percent Dollar/Euro 0.77 euro Dollar/Yen 105 yen The slowdown in the U.S. economy should lead to a modest improvement in the trade deficit, assuming that there are no major adjustments in currency prices and that oil stays near its current price. Since the trade deficit has been growing, and would likely continue to grow if the economy sustained its recent growth path, it would take substantial slowing just to hold the size of the deficit constant. With a falloff in GDP growth over the course of the year, the deficit may fall by around $40-50 billion (about 0.4 percent of GDP) from its current level.
  • 6. Recession Looms for the U.S. Economy in 2007 4 The Fed is likely to respond to the slowdown by lowering interest rates. It will almost certainly be very cautious in its rate reductions for two reasons. First, even with the economy slowing, inflation is still above the Fed’s, or at least Bernanke’s, target rate. With Bernanke feeling the need to establish his reputation as an inflation fighter, he will be hesitant to abandon the battle against inflation too quickly. The other reason that the Fed is likely to be cautious in lowering rates is that it is far more concerned about long-term rates than the short-term interest rates directly under its control. The long-term rate has barely budged in response to the two-year tightening by the Fed. (The 10-year Treasury rate was just over 4.6 percent when Greenspan began tightening in June 2004, which is also the rate in November 2006.) Investors, and more importantly the Chinese and Japanese central banks have been willing to hold long-term treasuries at very low real interest rates. The central banks are presumably holding these bonds to support the dollar and the U.S. economy, thereby sustaining their export market. They must recognize that they will lose money on these bonds when they decide to sell them, but consider this loss to be an acceptable price for sustaining their exports. However, if they came to feel the Fed was being reckless in its monetary policy, these central banks may become less willing to hold long-term bonds. Any substantial sell-off could lead to sharp rises in long-term interest rates in the United States. The fear of such a sell-off (either by central banks or private investors), will lead the Fed to be very cautious in lowering interest rates. However, it is likely that it will begin dropping rates in its first meeting in 2007 and will lower them by 1.0-1.5 percentage points over the course of the year.
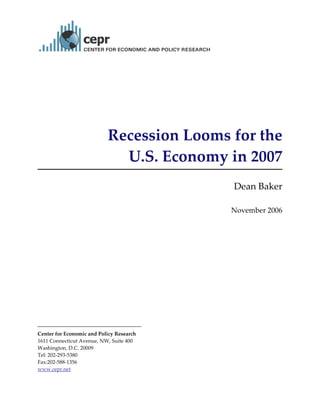
  • 7. Recession Looms for the U.S. Economy in 2007 5 Housing  The key factor determining the strength of the U.S. economy in 2007 will be the extent of the decline in the housing market. Historically, house prices have just kept even with the overall rate of inflation. Since the mid-90s, inflation-adjusted house prices have risen by a nationwide average of more than 50 percent, implying an over-valuation of close to one-third. FIGURE 1 Real House Sale Prices 200 180 160 140 120 1953 = 100 100 80 60 40 20 0 19 3 19 5 19 7 59 19 1 19 3 19 5 19 7 19 9 19 1 19 3 75 19 7 19 9 19 1 19 3 19 5 19 7 19 9 91 19 3 19 5 19 7 20 9 20 1 20 3 05 5 5 5 6 6 6 6 6 7 7 7 7 8 8 8 8 8 9 9 9 9 0 0 19 19 19 19 Source: OFHEO, BLS, and BEA.2 This over-valuation has provided an enormous boost to the economy over the last five years, leading to record high sales of existing homes and near record rates of construction. The charts below make comparisons to the mid-90s, since these were the years just prior to the beginning of the housing boom when the economic recovery was already well underway. With the U.S. population having increased by approximately 10 percent over the last decade, it would be reasonable to expect an increase in sales and construction numbers of approximately 10 percent. Instead, housing starts had increased by more than 50 percent at their 2005 peak, and sales were up by almost 90 percent. Assuming that the mid-90s provides a reasonable reference point (few economists argued that housing was depressed at the time), the data indicate that construction will stabilize at a level that is more than 25 percent lower than the 2005 peak and that stable level for sales will be more than 40 percent lower. Of course, given the extraordinary overbuilding of the last few years, it is likely that 2 The real house price shown in Figure 1 uses the BLS home price index for 1953 to 1977, the OFHEO House Price Index from 1982 to 2006, and averages the change in the two indexes over the period from 1977 to 1982.
  • 8. Recession Looms for the U.S. Economy in 2007 6 the economy will overshoot on the way down. Construction and sales could fall considerably below these levels for a few years as the housing market adjusts to a more normal situation. FIGURE 2 Sales of Existing Single Family Homes 8,000 7,075 7,000 6,779 6,450 6,175 6,000 5,600 Thousands 5,000 3,886 3,852 4,000 3,739 3,000 2,000 1993 1994 1995 2003 2004 2005 2006(p) 2007(p) Source: NAR [http://www.realtor.org/Research.nsf/files/REL0603TS.pdf/$FILE/REL0603TS.pdf] Sales of existing homes have already fallen sharply in first nine months of 2006. The projections shown in Figure 2 assume that this decline continues for the rest of the year and through 2007. The projection assumes that 2006 sales will be 6,450,000, a decline of 8.8 percent from the 2005 peak. It assumes that sales will decline by another 13.2 percent to 5,600,000 in 2007.
  • 9. Recession Looms for the U.S. Economy in 2007 7 FIGURE 3 New Housing Starts 2,500 2,068 1,956 2,000 1,848 1,870 1,670 1,457 1,500 1,354 Thousands 1,288 1,000 500 0 1993 1994 1995 2003 2004 2005 2006(p) 2007(p) Source: Census Bureau, http://www.census.gov/const/www/quarterly_starts_completions.pdf The projections in Figure 3 show year-round housing starts for 2006 totaling 1,870,000, a decline of 9.6 percent from the peak hit in 2005. The projections assume that housing starts will decline by another 10.7 percent to 1,670,000 in 2007. It is likely that housing starts will decline further to the range of 1.5 to 1.6 million in 2008, although overshooting could cause housing starts to fall below this level for a period of time. Housing has been important not only for its direct effect on the economy through the employment of workers in the construction, real estate, and mortgage banking sector, it also has been important through the effect of housing wealth on consumption. Homeowners have been borrowing against their homes at a record pace. As a result, the nationwide ratio of home equity to home value stands at a record low of 54.1 percent at the end of the second quarter of 2006. This ratio averaged close to 70 percent in the 60s, 70s, and 80s. This is remarkable since the unprecedented increase in house prices over the last decade would be expected to lead a high ratio of equity to value (a rise in house prices translates one to one into an increase in equity). Also, the nation’s demographics, with the huge baby boom cohort nearing retirement, should be tilted toward having higher than normal ratios of equity to value.
  • 10. Recession Looms for the U.S. Economy in 2007 8 FIGURE 4 Mortgage Equity Withdrawals 900 780.9 800 700 658.3 645.9 631.2 Billions (annual rate) 600 555.6 500 404.5 388.8 400 350.7 350.0 308.0 300.0 300 219.6 225.0 200 175.0 125.0 100 75.0 0 1 2 3 4 4 1 2 1 2 3 ) ) ) ) ) ) (p (p (p (p (p (p 0 0 0 0 6: 6: 5: 5: 5: 5: 20 20 20 20 0 0 0 0 0 0 3 4 1 2 3 4 20 20 20 20 20 20 6: 6: 7: 7: 7: 7: 0 0 0 0 0 0 20 20 20 20 20 20 Source: Federal Reserve Board, Flow of Funds, Table B.100 and NIPA, Table 5.3.5, line 19. With house prices now falling, the number of homeowners who no longer have any equity against which to borrow is increasing rapidly. This will substantially slow the growth in consumption, a process that may have already begun in 2006. Limitations on the ability to borrow against home equity may also explain the uptick in the growth rate of credit card debt. Credit card debt has grown at a 10.1 percent annual rate from April through September after having grown at an average annual rate of just 3.6 percent from 2002 through 2005.
  • 11. Recession Looms for the U.S. Economy in 2007 9 Consumption  Consumption has been the leading factor driving the economy in this business cycle. The consumption share of GDP rose from 68.7 percent at the peak of the last cycle in 2000, to 70.3 percent of GDP in the third quarter of 2006. All components of consumption have expanded at a healthy pace, as shown in Figure 5 but consumer durables have shown by far the most rapid pace of growth. However, the strong reported growth in durable goods consumption is primarily the result of falling computer prices leading to an increase in the real measure of durable goods. The share of durable goods consumption in GDP has actually fallen slightly since 2000, dropping from 8.7 percent of GDP in 2000 to 8.1 percent in the third quarter of 2006. The shares of expenditure on non-durable goods and services have both risen, more than offsetting this decline. FIGURE 5 Consumption Spending 145 GDP 140 Consumption 135 Durable Goods Non-Durable Goods 130 Services 125 2000=100 120 115 110 105 100 95 2000 2001 2002 2003 2004 2005 2006(p) 2007(p) Source: Bureau of Economic Analysis and author’s projections. The growing share of consumption in GDP was fueled by a drop in the savings rate. The wealth effect from the stock bubble had already depressed the savings rate to a then post-war low of 1.8 percent in 2001 (it had averaged more than 8 percent in the 60s, 70s, and 80s). The savings rate has continued to decline in the current decade due to the housing wealth effect.
  • 12. Recession Looms for the U.S. Economy in 2007 10 FIGURE 6 Savings Rate 3.0 2.4 2.5 2.1 2.0 2.0 1.8 Percent of Disposable Income 1.5 1.1 1.0 0.8 0.6 0.5 0.5 0.2 0.0 -0.5 -0.3 -0.3 -0.3 -0.2 -0.6 -0.5 -1.0 -1.5 -1.5 -2.0 1 2 3 4 1 2 3 4 1 2 ) ) ) ) ) ) (p (p (p (p (p (p 0 0 0 0 5: 5: 6: 6: 5: 5: 20 20 20 20 0 0 0 0 0 0 3 4 1 2 3 4 20 20 20 20 20 20 6: 6: 7: 7: 7: 7: 0 0 0 0 0 0 20 20 20 20 20 20 Source: Bureau of Economic Analysis and author’s projections. With millions of homeowners reaching the limits of their ability to borrow, the savings rate will begin to rise in 2007 back towards more normal levels. As the savings rate continues to rise in 2008 and 2009, consumption growth will trail the growth in disposable income. The resetting of $3 trillion in adjustable rate mortgages at substantially higher interest rates will also reduce income available for consumption.
  • 13. Recession Looms for the U.S. Economy in 2007 11 Investment  Investment growth has been relatively weak thus far in this recovery. (Investment growth was somewhat overstated in the 90s by the growth of car leasing. A leased car counts as an investment by the leasing company. A purchased car appears in consumption.) One of the main reasons was that the economy had sustained a very high level of investment in the late 90s as a result of the tech bubble. This led to overinvestment in large segments of the economy, and also created a relatively high starting point. Two other factors have also depressed investment. The housing bubble has pulled resources (construction workers and material) away from non-residential construction. As a result, a backlog of demand for non-residential structures accumulated over the last few years. The other factor depressing investment is the trade deficit. With demand for manufactured goods increasingly being filled by imports, many industries are investing in other countries rather than domestically. As the economy slows, the pace of growth of investment is likely to slow as well. This slowdown was already showing up in equipment and software investment in 2006. Growth in the second and third quarters averaged just 2.5 percent. Non-residential investment actually picked up sharply in the second and third quarters of the year as resources were finally freed up from residential construction. However, this burst will be relatively short-lived as the backlog of demand in the non- residential sector will be quickly filled. (Non-residential construction rose at a 20.3 percent annual rate in the second quarter. It rose at a 14.3 percent rate in the third quarter.) Investment growth in both categories will average close to two percent in 2007. FIGURE 7 Investment Spending 120 GDP 115 Non-Residential Investment Structures 110 Equipment and Software 105 2000=100 100 95 90 85 80 75 2000 2001 2002 2003 2004 2005 2006(p) 2007(p) Source: Bureau of Economic Analysis and author’s projections.
  • 14. Recession Looms for the U.S. Economy in 2007 12 Exports and Imports    The high value of the dollar has led to rapid growth in the trade deficit over the course of the business cycle. In the last two years, the size of the nominal deficit has been inflated due to the sharp jump in oil prices. With the economy weakening, real imports will fall by close to 2 percent in 2007. While exports of end products are likely to continue to grow at close to their current pace, a growing share of U.S. exports are intermediate goods for products that are later imported back into the United States. With imports falling, this will reduce the demand for exports of intermediate goods. This should cause the growth of total exports to fall back to around 4.0 percent. On net, the reduction in imports and the increase in exports will add approximately 0.7 percentage points to GDP growth. FIGURE 8 Exports and Imports 135 GDP 130 Exports 125 Imports 120 115 2000=100 110 105 100 95 90 85 2000 2001 2002 2003 2004 2005 2006(p) 2007(p) Source: Bureau of Economic Analysis and author’s projections.
  • 15. Recession Looms for the U.S. Economy in 2007 13 FIGURE 9 Exports, Imports, and Trade Balance 2,500 Trade Balance Exports 2,000 Imports 1,500 Billions of dollars 1,000 500 0 -500 -1,000 2000 2001 2002 2003 2004 2005 2006(p) 2007(p) Source: Bureau of Economic Analysis and author’s projections. The rise in exports and decline in imports will produce a modest improvement in the trade deficit. The decline in real imports of two percent, coupled with a three percent rise in import prices will lead to an increase in nominal imports of one percent, or just over $20 billion. Export prices will rise by 2.0 percent, which will lead to an increase in the nominal value of exports of 6.6 percent or approximately $90 billion. This will lead to a net improvement in the trade deficit of $70 billion by the 4th quarter of 2007, as shown in Figure 9.
  • 16. Recession Looms for the U.S. Economy in 2007 14 Government Spending   Government spending is likely to make somewhat more of a contribution to GDP growth in 2007, primarily due to the relatively rapid growth of state and local spending. State and local spending had grown very slowly from 2002 to 2005 as many states were in a weak financial situation following the recession. However, state and local finances are considerably stronger in most areas and there is backlog of unmet demands. While tax collections may slow over the course of 2007, appropriations will have been made when the budget situation was relatively strong. State and local spending will grow by 3.0 percent in 2007. The growth of federal spending is likely to slow due to pressures to limit the size of the deficit and possibly some reduction in the size of the forces occupying Iraq. Federal spending will grow at a 0.7 percent rate in 2007, with real defense spending increasing by 0.2 percent and non-defense spending rising at a 1.8 percent rate. This will lead to an overall increase in government spending of 2.2 percent. The decline in GDP will lead to a substantial drop in tax revenues. As result, the deficit in fiscal year 2007 will be $370 billion. It will rise to $460 billion in fiscal year 2008. FIGURE 10 Government Spending 135 GDP 130 Government Spending Federal 125 Defense State and Local 120 2000=100 115 110 105 100 95 2000 2001 2002 2003 2004 2005 2006(p) (2007(p) Source: Bureau of Economic Analysis and author’s projections.    
  • 17. Recession Looms for the U.S. Economy in 2007 15 Job Growth   The rate of job growth has slowed sharply over the course of 2006. The economy was creating jobs at a healthy rate of 230,000 per month in 2005.3 In three months ending in October 2006, job creation averaged 157,000. Job growth in the private sector averaged just 119,000 over this period. This rate is virtually certain to slow sharply in the months ahead. Thus far the slowdown in construction has led to almost no falloff in employment in the construction sector. Similarly, employment in real estate is still at its peak levels, even though sales of new and existing homes are both down by close to 15 percent on a year over year basis. Clearly employment levels in these and other housing related sectors will soon adjust to the falloff in demand. As consumption growth falls off, there will be reduction in employment growth in other sectors. This downturn is already visible in manufacturing, which has lost 55,000 jobs from July to October. Retail trade has also been shedding jobs, with employment down by 63,000 year over year. Much of this job decline is attributable to consolidation within the industry, but it is likely that slower demand growth will lead to continuing job losses even as the impact of the consolidation diminishes. Slower consumption growth will likely also curtail the growth in employment in restaurants, a sector that added 292,000 jobs over the last year. The health care sector, which added 300,000 jobs in the last year, is likely to sustain a healthy pace of job growth, as is the government sector, which added 230,000 jobs. Over the course of the year, the economy will shed 1.2 million jobs. The greatest job loss will be the housing related sectors, construction, real estate, and mortgage banking, but most sectors are likely to be affected by the drop in output. 3 This includes the addition of 810,000 jobs from the Bureau of Labor Statistics benchmark revision to the establishment survey.
  • 18. Recession Looms for the U.S. Economy in 2007 16 FIGURE 11 Jobs (Establishment Survey) 138 136 134 Millions 132 130 128 126 2000 2001 2002 2003 2004 2005 2006(p) 2007(p) Source: Bureau of Labor Statistics and author’s projections. FIGURE 12 Unemployment Rate 6.5 6.2 6.0 6.0 5.8 5.8 5.5 5.5 5.4 5.1 5.0 5.0 4.8 Percent 4.7 4.7 4.7 4.6 4.5 4.0 4.0 3.5 3.0 1 2 3 0 1 2 3 4 5 p) p) p) p) p) : : : 0 0 0 0 0 0 06 06 06 4( 1( 2( 3( 4( 20 20 20 20 20 20 : : : : : 06 07 07 07 07 Source: Bureau of Labor Statistics and author’s projections.
  • 19. Recession Looms for the U.S. Economy in 2007 17 FIGURE 13 Nominal Wage Growth (3-month average, annual rate) 5.0 4.5 4.0 3.5 3.0 Percent 2.5 2.0 1.5 1.0 0.5 0.0 2000 2001 2002 2003 2004 2005 2006(p) 2007(p) Source: Bureau of Labor Statistics and author’s projections. With slower job growth, the unemployment rate will begin to rise, which will in turn weaken the labor market and lead to slower wage growth. Unemployment will begin rising by the end of 2006. (The 4.4 percent figure for October was probably somewhat of a fluke.) By the end of 2007, the unemployment rate will be over 6.0 percent. Wage growth will slow from its current level of 4.0 percent to under 3.0 percent by the end of 2007. For the calendar year, it will average 3.4 percent.
  • 20. Recession Looms for the U.S. Economy in 2007 18 Inflation  There will be important forces pushing inflation in opposite directions in 2007. The higher unemployment rate and resulting downward pressure on wage growth will help to ameliorate inflation. Similarly, the oversupply of housing and the record high vacancy rates will lead to downward pressure on rents. The rental components account for more than 30 percent of the overall consumer price index and almost 40 percent of the core index, so a slower rate of rental inflation will have a substantial impact on the overall index. Figure 14 Inflation – CPI (3-month average, annual rate) 8.0 Overall CPI Core CPI 6.0 Rental Inflation 4.0 Percent 2.0 0.0 -2.0 -4.0 2000 2001 2002 2003 2004 2005 2006(p) 2007(p) Source: Bureau of Labor Statistics and author’s projections. On the other side, productivity growth has slowed sharply over the last year. Productivity rose by just 1.3 percent from the third quarter of 2005 through the third quarter of 2006. This is down from a growth rate of more than three percent in 2001-2004. This number will be revised down by approximately 0.2 percentage points after the benchmark revision to the establishment survey. In addition to slower productivity growth, import prices are likely to stay on an upward path in 2007. Non-oil import prices had been falling earlier in this cycle. However, with most other economies growing rapidly and the dollar falling at least modestly against other currencies, we are likely to see some further increase in the inflation rate in non-oil imports. On net, the inflation rate is likely to moderate slightly in 2007 as the impact of slower wage growth and rental inflation more than offsets the impact of slower productivity growth and higher inflation in import prices. The core and overall CPI inflation rate should both average 2.6 percent over the year, with both easing downward from their current rates over the course of the year. Rental inflation is likely to end the year at just over 2.0 percent, driven down by the record high vacancy rate.
  • 21. Recession Looms for the U.S. Economy in 2007 19 Interest Rates and the Dollar  The Fed will be torn between the desire to slow inflation, which will remain slightly above its target range, and the need to boost the economy. (The risk of inflation is likely to appear somewhat worse with the apparent slowing of productivity growth to just 1.0 percent over the last year. While this effect may be largely cyclical, slower productivity growth will reduce the extent to which higher costs can be absorbed by business without either experiencing a loss in profits or raising prices.) With the economy’s weakness becoming evident by the end of the year, the Fed is likely to begin lowering rates no later than its first meeting in January. However, just as raising the Federal Funds rate had little impact on the 10-year treasury rate, lowering the Federal Funds rate is likely to have little effect in lowering rates, especially in a context in which the bond market seems to have already anticipated a drop in interest rates. By the end of the year, the Fed will likely have lowered the Federal Funds rate to close to 4.0 percent. However, investors are likely to be more concerned about the prospects of a falling dollar as rising interest rates in Europe, Japan and elsewhere make foreign currencies more attractive. For this reason, the short-term and long-term rates will move in opposite directions. The 10-year treasury rate is likely to end the year close to 5.2 percent, which would still be relatively low by historical standards in both nominal and real terms. Both the euro and the yen will appreciate modestly against the dollar, with the dollar worth 0.77 euros and 105 yen by the end of the year. This analysis assumes only modest appreciation of the yuan (about 2 percent) against the dollar. If the Chinese government allows for more rapid appreciation, then long-term interest rates in the United States could be considerably higher. After 2007   The ability of the economy to recover from the 2007 recession will depend both on how quickly the imbalances are corrected (the housing bubble and the over-valued dollar) and the direction of the policy response. The Federal Reserve Board will have to choose whether to fight the risk of inflation associated with a declining dollar (which is essential for correcting the trade imbalance) or whether to provide stimulus to counterattack the slump brought on by the collapse of the housing bubble. Since there may be no consensus for either path, it is very possible that it will end up in an intermediate position where it lowers interest rates modestly, but does not act to aggressively counteract the slump. Fiscal policy could be subject to a similar paralysis. It would be reasonable for Congress to enact a stimulus package including tax cuts and/or spending measures to counteract the slump; however, concern over the size of the deficit could prevent effective action. If political factors prevent effective monetary and fiscal measures, then a slump caused by the collapse of the housing bubble could be prolonged considerably.