1. 69
The parasite Lernaeocera branchialis on caged cod :
infection pattern is caused by differences in host
susceptibility
D. A. L Y S N E "* and A. S K O R P I N G #
" Finnmark University College, Follumsvei 31, N-9509 Alta, Norway
# Department of Zoology, University of Bergen, Realfagbygget, AlleT gaten 41, 5007 Bergen, Norway
(Received 23 January 2001 ; revised 5 May 2001 and 1 August 2001 ; accepted 1 August 2001)
Variation in host susceptibility causes significant differences in infection rates between hosts living in a semi-natural
situation. Such knowledge has implications for population dynamics and evolutionary models of host–parasite interactions
as well as for estimations of parasite abundance. Infection rates by Lernaeocera branchialis (L.) were measured through
time and space on caged Atlantic cod (Gadus morhua L.). One group of hosts, identified by their infection history,
developed significantly higher infection rates than the others. These were fish which had been infected previously, but had
lost their infection. Differences between groups were consistent through both time and space. Two types of cod seem to
have been present in the caged population ; a small group of inherently susceptible fish, which were infected, and reinfected
if the parasite was lost, and another group of resistant hosts with a small chance of becoming infected.
Key words : Atlantic cod, Gadus morhua, Lernaeocera branchialis, susceptibility.
studies where the effect of heterogeneities in ex-
posure rate to infective stages can be separated from
Most macroparasites show a non-random distri- heterogeneities in host susceptibility. As pointed out
bution across their host population (Shaw, Grenfell by Clayton, Pruett-Jones & Lande (1992), a major
& Dobson, 1998). The level of parasite aggregation shortcoming in many studies has been that workers
has consequences for population regulation have been using variation in parasite numbers as a
(Anderson & May, 1978 ; May & Anderson, 1978), as measure of variation in susceptibility. Experimental
well as for epidemiological studies since, at in- studies in the laboratory, where individuals are
creasing levels of aggregation, a larger number of exposed to a known number of infective stages, have
hosts must be sampled in order to estimate parasite repeatedly shown that host susceptibility varies
abundance. Furthermore, several evolutionary between individuals (Chevassus & Dorson, 1990 ;
models hypothesize that parasites can be important Bakke et al. 1992 ; Wakelin, 1994). These are not
selective agents on their hosts (Barbehenn, 1969 ; easily extrapolated to natural situations because
Hamilton & Zuk, 1982 ; Freeland, 1983 ; Hamilton, exposure rates may differ widely from those in the
Axelrod & Tanese, 1990). A necessary requirement field (Quinnell & Keymer, 1990), and also because
for such parasite-mediated selection is that the trait host susceptibility may be affected by conditions in
to be selected must covary with parasite numbers the laboratory (Lloyd, 1995). An alternative is to run
(Goater & Holmes, 1997 ; Skorping, 1998). For field experiments where hosts can be exposed to
example, in the hypothesis proposed by Hamilton & naturally occurring transmission stages under en-
Zuk (1982) on sexual selection, it is assumed that vironmental conditions more similar to those ex-
differences in male heritable susceptibility will be perienced in the wild. By using ectoparasites on
reflected in the distribution of parasites. The im- individually marked hosts, it should be possible to
portance of parasites as selective agents is likely to compare infection rates between host individuals,
increase when parasite distribution becomes less and examine if differences in rates are consistent
aggregated because more hosts harbour a higher through time.
number of parasites. This paper describes fluctuations in the population
In order to understand why wild-living parasites of Lernaeocera branchialis (L.) on caged cod (Gadus
aggregate within their host populations we need morhua L.) for 598 days. L. branchialis uses mainly
different species of flatfish as intermediate hosts
(Kabata, 1979), but can also develop on other fish
* Corresponding author : Finnmark University College,
N-9509 Alta, Norway, Tel : j 47 78 45 03 56. Fax : j47 species (Lester & Roubal, 1995). After mating, the
78 43 44 38. E-mail : daga!hifm.no pregnant female has a short free-living period
Parasitology (2002), 124, 69–76. " 2002 Cambridge University Press
DOI : 10.1017S0031182001008848 Printed in the United Kingdom
2. D. A. Lysne and A. Skorping 70
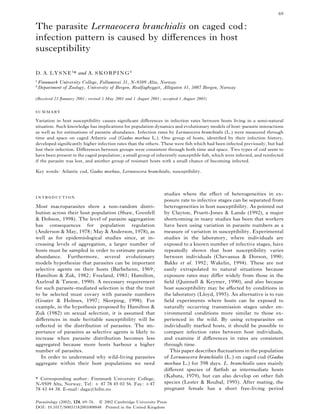
Fig. 1. Chart of Kvalfjorden with cage locations marked by dots. Four net bags were placed in cage A, while cages B
and C had 1 net bag each.
searching for the definitive host, a gadoid fish. If
successful, she will settle at the base of the gill arches
on the ventral side, and undergo a metamorphosis Six hundred cod were caught by floating trawl off the
where the head penetrates into the heart region of the coast of Finnmark County, Norway, and caged in
fish (Grabda, 1991). The parasite is known to Kvalfjorden (70m 42h N and 23m 48h E). The fish were
influence both growth and level of liver fat, and may allowed to recover from capture and acclimatized for
be lethal, especially to young fish (Khan, Lee & 2 weeks while fed several times a day with artificial
Barker, 1990). The parasite may live up to 18 months food. Thereafter, the fish were caged in 6 net bags
(Lester & Roubal, 1995) and can not move between (height 4 m, volume 40 m$ each) at 3 different
hosts. locations in the fjord. One hundred cod were placed
In the present study a field experimental approach in each of 4 net bags in cage A (see Fig. 1). These
was used to address the following question. Do were all free from infection by L. branchialis, with 3
infection rates vary between hosts due to inherent accidental exceptions. The depth at low tide was 8 m
differences in susceptibility? Exposure can be at this cage. This paper is part of a larger study, and
assumed to be random within each of the host fish from another 2 cages, which were placed in the
locations used in this experimental set-up. If then study area for other reasons (labelled B and C in Fig.
the pattern of infection is caused mainly by factors 1), were also included in the present data. At caging
unrelated to host susceptibility, infection rates 100 cod were placed at random, with respect to
should show random variations between host indi- infection, in one net bag in each of cage B and C
viduals. (Table 1). The cages were placed 200 m and 50 m
3. Variation in susceptibility to L. branchialis 71
Table 1. Infection levels of Lernaeocera branchialis on the caged cod at
the start of the experiment are given separately for the 3 cages in the
experiment together with the mean and range of both body mass and
length of the fish at caging, as well as increase in body mass and
length through the study period
(Cage-labelling refers to Fig. 1)
Cage A Cage B Cage C
Infection
Abundance 0n01 0n85 0n71
Prevalence 1n1 % 38n5 % 40n9 %
Mass (g)
Mean 1876n4 1855n2 2013n2
Range 1025n0–2905n0 1110n0–2525n0 1110n0–4300n0
Increase, mean 2454n6 2408n6 2248n7
Increase, range 410n0–4170n0 705n0–4490n0 310n0–5070n0
Length (cm)
Mean 60n6 60n5 61n2
Range 47n5–71n0 48n0–66n0 50n0–79n5
Increase, mean 10n6 10n3 9n5
Increase, range 3n5–21n0 2n0–18n5 1n0–20n5
from the shore respectively. Depths at low tide were (i) included fish where numbers of parasites in-
31n5 m at cage B and 18n5 m at cage C. In the fjord creased during a time-period, and group (ii) included
the average water level change is 1n8 m (Statens fish where numbers of parasites did not increase.
Kartverk, 2001) between high to low tide. Strong The data were used in a logistic regression model
tidal currents, which are especially pronounced close with binomial errors in Glim4 (Crawley, 1993).
to the shores (Fig. 1), continuously replaced the Groups of cod, identified by infection history, were
water within the cages. tested for differences in age distributions using
Before the separation into different cages fish were contingency tables (GLM with Poisson errors and
inspected for L. branchialis, and length and mass log link function). The variables were included in the
were recorded (Table 1). All fish were also in- models in a forward stepwise manner. Significance
dividually tagged with external anchor tags (T-tags). of effects in the models were tested by comparing the
Before handling, each fish was anaesthetized in change in deviance by the removal of a term from the
0n15 % chlorobutanol (C H Cl O). During the ex- model with the values of Chi-square tables in
% ( $
perimental period the fish were anaesthetized, L. accordance with Crawley (1993).
branchialis counted and length and mass recorded 6
times ; on days 0, 74, 327, 431, 522 and 598 after
caging. The large gap in collection times between the
second and third sample was caused by bad weather A total of 495 cod survived the experimental period.
conditions which made it impossible to transport the Of the survivors, 339 fish could be identified
fish between the cages and the location where they throughout the study, while the remaining indi-
were anaesthetized and inspected. On day 598 all viduals had lost their tags and were subsequently re-
surviving fish were killed and sexed. The otoliths tagged. Of the 339 cod, which were identified
were removed for age determination. During the throughout the study, 79 % remained uninfected,
experiment cod were fed cuttings from the codfillet while the rest of the fish harboured the parasite at
industry and herring meal mixed with commercial one or more sampling points. During the study
fish food (‘ Salmomix 45 % ’). Food was added to the period there was a decline in numbers of hosts
cages twice a week, and what was not eaten, sank out harbouring more than 1 L. branchialis (Fig. 2 ; χ# l
of the cage within a period of less than 30 sec. 9n29 ; P l 0n0023 at 1 ..). The death of 22 fish was
Only fish which survived longer than day 327, caused by predation by the otter, Lutra lutra, which
were included in the analyses. All statistical tests in most cases made the fish impossible to inspect for
were run using generalized linear models (GLMs) in parasites. These killings took place during the dark
the Glim4 computer package (Crawley, 1993). period each year, between late November and early
Changes in frequency distribution of parasites February. The otter entered the cages through self-
through time were tested using a contingency table made holes in the net. However, among the dead fish
(Poisson errors and log link function). Changes in which could be inspected, intensity and prevalence
rates of infection were treated as binary data : group were within the levels measured among the survivors
4. D. A. Lysne and A. Skorping 72
40
30
Number of fish
20
10
0
0 74 327 431 522 598
June August April August November January
1993 1993 1994 1994 1994 1995
Days after caging and month and year of sampling
Fig. 2. Numbers of cod harbouring different numbers of Lernaeocera branchialis during the period of caging. Only
fish which appeared in all samples (n l 339) were included. Number of L. branchialis per fish 1; 2;
3; 8 4;
: 5 ; 5 6.
Fig. 3. Infection rates, with standard errors, by Lernaeocera branchialis for fish which were free from infection at the
start of a time-period (open columns), compared to rates for fish which harboured the parasite (filled columns). ‘ 0 ’ l
No fish acquired new infections.
(intensity l 1.78, prevalence l 0n36, n l 22). Data the changes in infection rates were not apparent from
on the surviving fish therefore seem not to have been the analyses. Inclusion of a second order and third
biased by parasite-related deaths. order parameter of the ‘ time ’ variable did not exert
The rate at which L. branchialis established within significant influence on infection rates (χ# l 0n30 ; P
the caged population was high during the first time l 0n58 at 1 ., and χ# l 2n56 ; P l 0n11 at 1 ..,
period (Fig. 3), but then dropped to a lower level ( χ# respectively).
l 50n5 ; P 0n001 at 1. ..). Seasonal fluctuations in Infection rates were compared between groups of
5. Variation in susceptibility to L. branchialis 73
Table 2. The influence of infection history and location on infection
rates of Lernaeocera branchialis on cod during successive time-periods
(‘ Infection history ’ identifies 2 groups among the cod. Fish which were un-
infected at the start of the time-period are compared to fish which harboured the
parasite (see also Fig. 3). ‘ Location ’ refers to the 3 locations in the fjord where
the cod were caged. In the analysis ‘ infection rate ’ was treated as a binary response
variable, and included in models (GLMs) with binomial errors.)
Inf. history Location Inf. history i
Days after caging (.. l 1) (.. l 2) loc. (.. l 2)
0–74 χ# l 1n93 χ# l 4n94 χ# l 0n31
P l 0n16 P l 0n09 P l 0n86
74–327 χ# l 1n37 χ# l 2n44 χ# l 0n38
P l 0n24 P l 0n30 P l 0n83
327–431 χ# l 0n28 χ# l 0n92 χ# l 0n002
P l 0n60 P l 0n63 P l 0n999
431–522 χ# l 1n76 χ# l 1n64 χ# l 0n001
P l 0n19 P l 0n44 P l 0n999
522–598 χ# l 0n13 χ# l 0n30 χ# l 3n099
P l 0n72 P l 0n86 P l 0n21
Fig. 4. Infection rates, with standard errors, by Lernaeocera branchialis for 2 subgroups of the fish classified as
‘ uninfected ’ in Fig. 3. Fish which had lost the infection, and therefore were free from the parasite at the start of the
time-period (open columns), are compared to fish which were not recorded as infected prior to the start of the time-
period (filled columns). ‘ 0 ’ l No fish acquired new infections.
cod identified by their infection history. Rates did of the 4 time-periods, these cod were more likely to
not differ between fish which were uninfected at the be infected than the cod which had never harboured
start of a time-period, compared to infected fish (Fig. the parasite at any of the previous sampling points
3). This was shown statistically by the lack of (the statistics are given in Table 3). In the second
difference within all of the 5 time-periods which interval in Fig. 4, where infection rate is zero in the
were compared (the statistics are given in Table 2). group of previously infected cod, only 11 of the
However, 1 subgroup among the uninfected fish individuals which were free from infection after 327
showed significantly higher rates of infection than days in the cage, had been recorded as infected
the others. These were the fish which had been earlier in the study. None of these were recorded as
infected, but had lost their infection prior to the start infected after 431 days in the cage. Furthermore,
of the time-period under investigation (Fig. 4). This when compared to the group of cod which harboured
loss of infection was identified among individuals the parasite at the start of a time-period, the group of
which had harboured the parasite at one or more of cod which had lost all their parasites, showed
the previous samplings but were free from infection significantly higher infection rates in 2 of the 4 time-
at the start of the time-period in question. Within 3 periods (the statistics are given in Table 4). This
6. D. A. Lysne and A. Skorping 74
Table 3. Fish which had been infected by Lernaeocera branchialis, but
had lost their infection prior to the start of the time-period, are
compared to fish which were not recorded as infected (see Fig. 4)
(These are subgroups of the ‘ uninfected ’ fish in Fig. 3. In the analyses ‘ infection
rate ’ was treated as a binary response variable, and included in models (GLMs)
with binomial errors.)
Inf. history Location Inf. history
Days after caging (.. l 1) (.. l 2) i location
74–327 χ# l 7n92 χ# l 2n14 χ# l 3n06
P l 0n005 P l 0n34 P l 0n08 (1 ..)
327–431 χ# l 0n11 χ# l 0n61 χ# l 0n0002
P l 0n74 P l 0n74 P l 0n999 (2 ..)
431–522 χ# l 13n60 χ# l 3n58 χ# l 0n24
P l 0n001 P l 0n17 P l 0n89 (2 ..)
522–598 χ# l 7n03 χ# l 1n66 χ# l 0n118
P l 0n008 P l 0n44 P l 0n94 (2 ..)
Table 4. Fish which had been infected by Lernaeocera branchialis
previous to the time-period in question, but had lost the infection (a
subgroup of the ‘ uninfected ’ in Fig. 3), are compared to fish which
harboured the parasite at the start of the period (the ‘ infected ’ fish in
Fig. 3)
(In the analyses ‘ infection rate ’ was treated as a binary response variable, and
included in models (GLMs) with binomial errors.)
Inf. history Location Inf. history
Days after caging (.. l 1) (.. l 2) i location
74–327 χ# l 7n31 χ# l 4n64 χ# l 0n0008
P l 0n007 P l 0n10 P l 0n977 (1 ..)
327–431 χ# l 0n21 – –
P l 0n65 – –
431–522 χ# l 10n68 χ# l 3n22 χ# l 0n001
P l 0n001 P l 0n20 P l 0n999 (2 ..)
522–598 χ# l 2n41 χ# l 0n34 χ# l 2n82
P l 0n12 P l 0n84 P l 0n24 (2 ..)
pattern may have been caused by age-related as uninfected. This difference was consistent through
differences in infection rates. If so, age of the fish time and between locations. With respect to infection
should differ between groups identified by infective rates, 2 types of cod therefore appear to have been
history. This was not found to be the case within any present in the caged population ; one large group
of the time-periods (χ# 8n57 ; P 0n29 at 7 ..). with a relatively small chance of becoming infected
Differences in infection rates between individuals and another smaller group with a much higher risk of
did not depend on which location the fish were acquiring the parasite. The strong water currents in
placed in. This appeared from the fact that ‘ location ’ the caging area, which caused continuously re-
neither affected infection rate (Tables 2, 3 and 4), placement of the water within the cages, should
nor influenced the effect of ‘ infection history ’ within produce random variation in exposure to infective
any of the time-periods (non-significant effects of the stages among fish within each cage. Furthermore,
‘ infection historyilocation ’ interactions ; Tables 2, during the experimental period there were no
3 and 4). significant differences in infection rates between the
cages. Therefore, the differences in rates between the
2 groups of cod, could not have been caused by
differences in the rate of exposure, but must have
In this study, infection rates did not vary randomly been related to phenotypic differences.
between individual cod. Fish which had been An alternative explanation would be that the
infected previously with L. branchialis and had lost smaller group of hosts may have differed in their
the infection, had a significantly higher rate of behaviour in a way that made them more frequently
infection than cod which previously were recorded exposed to transmission stages, for example, by
7. Variation in susceptibility to L. branchialis 75
occupying the bottom of the net bags. Poulin, Rau Susceptibility can appear as a gradient from highly
Curtis (1991) showed that variation in behaviour susceptible to resistant hosts. This view does not
influenced infection rates among laboratory reared change the argument that infection rates decreased
brook trout fry (Salvelinus fontinalis) infected by the through time due to declining probability of encoun-
crustacean ectoparasite Salmincola edwardsii. How- tering susceptible hosts because the highly sus-
ever, if host behaviour were an important factor in ceptible individuals were infected during the first
the present study the frequently exposed hosts part of the study and moved into the infected class
should show high levels of infection rates throughout with a low probability of reinfection.
the study period, independent of their previous Other explanations for the observed decrease in
infection status. This was not observed. infection rate with time are possible, but less likely.
The assumption that the caged cod population A decrease in rates of infection with time could be
initially consisted of a small group of inherently caused by stress during the caging process, which
susceptible fish among a larger group of resistant may increase initial susceptibility to parasites (Lloyd,
ones, would explain both the decrease in the infection 1995). However, fish seem to acclimatize to cages
rates within the whole group of cod, and the over a short time. Pickering (1987) argued that
fluctuating rate of infection among the fish which within 3 weeks most individuals of several species do
had carried the parasite earlier, but lost it. The not show signs of immune suppression. Seasonal or
infection rate within the whole group should decline annual changes in densities of transmission stages
because the number of susceptibles rapidly became may cause a decrease in rate of infection through
infected and moved into the infected class with a low time. If densities decreased through the first autumn
probability of reinfection. Since this parasite may and winter, the rates of infection should have
live for 18 months (Lester Roubal, 1995), few of increased again over the second summer (from April
these fish had lost their infection after 327 days in the to early November which would be from 327 to 522
cage. This may explain the lack of new infections days in the cage). This did not happen. Neither is it
among the group of susceptibles during the second likely that annual fluctuations in densities of trans-
time-interval. mission stages caused the observed pattern, because
Are cod with a previous record of carrying the changes in rates of infection with time differed
parasite more vulnerable to reinfection due to between groups of cod. For example, infection rates
parasite-induced increase in susceptibility ? Such increased in the group of infected cod between the
patterns were observed in the laboratory on juvenile second-to-last and the last time-period. At the same
sticklebacks (Gasterosteidae) infected by the crus- time the group of cod which had lost their infection,
tacean ectoparasite Argulus canadensis (Wilson, 1916 ; showed a 40 % decrease in infection rates. It is
Poulin FitzGerald, 1989), and on brook trout therefore reasonable to conclude that the decrease in
fry infected by another crustacean ectoparasite S. infection rates with time was caused by a declining
edwardsii (Poulin et al. 1991). However, the present number of susceptible hosts.
data seem not to fit this explanation. L. branchialis Are the present results comparable to the wild
did not induce higher infection rates among the fish situation ? It is not likely that factors tied to the
harbouring the parasite, because the number of fish caging situation, for example stress, would affect a
carrying more than 1 parasite did not increase with fraction of the caged cod, i.e. the susceptible fish
time, and fish infected by the parasite at the start of identified by their infection history, more seriously
a given time-period did not show higher infection than the rest of the population. However, the
rates than uninfected hosts. A supposed increase in availability of food may be more uniformly distri-
susceptibility due to earlier infection may also take buted, and for part of the year more abundant,
effect only after the fish have lost the infection. between caged individuals than experienced by wild-
However, if parasite-induced facilitation of re- living fish. As a consequence, differences in host
infection were the most important factor causing resistance caused by fluctuation in nutritional re-
changes in infection rates, we would expect rates to source may be more pronounced among wild-living
be low at the start of the study period, and thereafter hosts. The frequent availability of high quality food
increase as parasites died and numbers of previously may explain why the numbers of multi-infected
infected fish increased through time. This was not hosts decreased throughout the study period.
observed. Since this is a relatively pathogenic parasite (Khan,
The argument that the caged cod initially con- 1988 ; Khan et al. 1990), cod that are able to avoid it
sisted of a small group of inherently susceptible fish should have a fitness advantage relative to the
among a larger group of resistant ones, depends on susceptible group. Why then, does resistance not
the assumption that the observed temporal variations spread to the whole cod population ? We suggest 2
in infection rate are caused by changes in availability possible mechanisms that may maintain such poly-
of susceptibles. The distribution of the cod popu- morphism in susceptibility.
lation in 2 distinct groups, susceptible or resistant Given that parasites show virulence specific to
hosts, may, however, not be a realistic model. genotypes, Hamilton (1980) hypothesized that be-
8. D. A. Lysne and A. Skorping 76
cause of frequency-dependent selection, parasites , . (1991). Marine Fish Parasitology. Polish
may generate cyclical processes where the fre- Scientific Publishers.
quencies of host genotypes are changing with time. , . . (1980). Sex versus non-sex versus
Susceptibility to L. branchialis may also be parasite. Oikos 35, 282–290.
maintained if resistance is costly and therefore affects , . ., , . , . (1990).
Sexual reproduction as an adaptation to resist
some other factors related to fitness. Life-history
parasites (a review). Proceedings of the National
theory suggests that hosts may increase their fitness Academy of Sciences, USA 87, 3566–3573.
by suppressing responses against parasites, in order , . . , . (1982). Heritable true fitness
to restrict the operation of the immune system for and bright birds : A role for parasites? Science 218,
frequently occurring and pathogenic parasites 384–386.
(Behnke, Barnard Wakelin, 1992). , . (1979). Parasitic Copepoda of British fishes.
The present data show that variation between The Ray Society, London.
individuals in rates of infection was consistent , . . (1988). Experimental transmission,
through time and space when living in environments development, and effects of a parasitic copepod,
similar to the natural one. We conclude that this Lernaeocera branchialis, on Atlantic cod, Gadus
pattern was caused by inherent differences in host morhua. Journal of Parasitology 74, 586–599.
susceptibility. , . ., , . . , . (1990). Lernaeocera
branchialis : a potential pathogen to cod ranching.
Journal of Parasitology 76, 913–917.
We thank the staff at Finnmark Research Centre for their , . . . , . . (1995). Phylum
cooperation, Ellen Andersen and Sissel Kaino for technical
Arthropoda. In Fish Diseases and Disorders. Vol. I.
assistance. We also acknowledge Peter Hudson for con-
structive comments and discussions, and for improving Protozoan and Metazoan Infections (ed. Woo,
the English. This study was financially supported by the P. T. K.), pp. 475–598. CAB International,
Norwegian Research Council. Wallingford, UK.
, . (1995). Environmental influences on host
immunity. In Ecology of Infectious Diseases in Natural
Populations (ed. Grenfell, B. T. Dobson, A. P.), pp.
327–361. Cambridge University Press, Cambridge.
, . . , . . (1978). Regulation and , . . , . . (1978). Regulation and
stability of host–parasite population interactions. stability of host-parasite population interactions. II.
I. Regulatory Processes. Journal of Animal Ecology 47, Destabilizing processes. Journal of Animal Ecology 47,
219–247. 249–267.
, . ., , . ., , . . , . . , . . (1987). Stress responses and disease
(1992). Host specificity and dispersal strategy in resistance in farmed fish. Aqua Nor 87, 35–49.
gyrodactylid monogeneans, with particular reference , . , . . (1989). A possible
to Gyrodactylus salaris (Platyhelminthes, Monogenea). explanation for the aggregated distribution of Argulus
Diseases of Aquatic Organisms 13, 63–74. canadensis Wilson, 1916 (Crustacea : Branchiura) on
, . . (1969). Host–parasite relationships and juvenile sticklebacks (Gasterosteidae). Journal of
species diversity in mammals : an hypothesis. Parasitology 75, 58–60.
Biotropica 1, 29–35. , ., , . . , . . (1991). Infection
, . ., , . . , . (1992). of brook trout fry, Salvelinus fontinalis, by
Understanding chronic namatode infections : ectoparasitic copepods : the role of host behaviour and
Evolutionary considerations, current hypotheses and initial parasite load. Animal Behaviour 41, 467–476.
the way forward. International Journal for Parasitology , . . , . . (1990). Acquired
22, 861–907. immunity and epidemiology. In Parasites : Immunity
, . , . (1990). Genetics of and Pathology. The Consequences of Parasitic Infection
resistance to disease in fishes. Aquaculture 85, 83–107. in Mammals (ed. Behnke, J. M.), pp. 317–343. Taylor
, . ., -, . . , . (1992). and Francis Ltd, London.
Reappraisal of the interspecific prediction of parasite- , . ., , . . , . . (1998).
mediated sexual selection : opportunity knocks. Patterns of macroparasite aggregation in wildlife host
Journal of Theoretical Biology 157, 95–108. populations. Parasitology 117, 597–610.
, . . (1993). Methods in Ecology, Glim for , . (1998). Macroparasites as selective agents
Ecologists. Blackwell Science Ltd, Oxford. in birds. Bulletin of the Scandinavian Society for
, . . (1983). Parasites and the coexistence of Parasitology 8, 33–38.
animal host species. American Naturalist 121, , (2001).
223–236. Tidevannstabeller for den norske kyst med Svalbard
, . . , . . (1997). Parasite-mediated samt. Dover, England.
natural selection. In Host–Parasite Evolution. General , . (1994). Host populations : Genetics and
Principles and Avian Models (ed. Clayton, D. H. immunity. In Parasitic and Infectious Diseases,
Moore, J.), pp. 9–29. Oxford University Press, Epidemiology and Ecology (ed. Scott, M. E. Smith,
Oxford. G.), pp. 83–100. Academic Press, London.