Ride the Storm: Navigating Through Unstable Periods / Katerina Rudko (Belka G...
Media and Entertainment
1. Customer
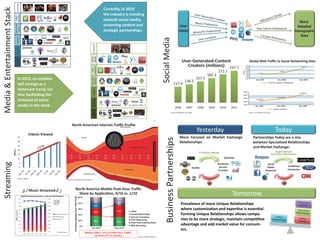
Media & Entertainment Stack Currently, in 2010
the industry is trending
Interface
User
towards social media, More
streaming content and User Detailed
Operating
System
Pop Culture Preferences
strategic partnerships. Inputs Demographic
Data
Social Media
Device
Customer
Delivery
Media
Social
User-Generated-Content
Content
Global Web Traffic to Social Networking Sites
Creators (millions) 237.7
Interface
User
211.1
182.3
In 2015, co-creation 157.5
Operating
System
136.5
will emerge as a 117.9
dominant trend, fur-
Device
ther facilitating the
entrance of social
Delivery
media in the stack. 2006 2007 2008 2009 2010 2011
Content
Source: eMarketer, June 2007 Source: The Nielsen Company
North American Internet Traffic Profile
Yesterday Today
Videos Viewed A
sample of
35
daily Internet
traffic maps the More Focused on Market Exchange Partnerships Today are a mix
Business Partnerships
relative volume of
different data types.
30 Video now accounts
for 43 percent of the
total during peak
Relationships: between Specialized Relationships
25 evening hours.
and Market Exchange:
20
billions
TV Shows, Movies Target Market/
15 Consumer Information
10
5
Streaming
Broadcast Social
0 Service Media Traditional
Studios
Provider Networks Companies
Source: Mintel
Source: Bloomberg Businessweek
North America Mobile Peak Hour Traffic
♫ Music Streamed ♫
Share by Application, 9/10 vs. 1/10 5%
Tomorrow
Normalized Aggregate Peak Traffic Profile
100%
10% 10%
6% 8%
80% 4%
18%
3%
6% Prevalence of more Unique Relationships M
60%
41% Other
where customization and expertise is essential.
27%
40% Social Networking Forming Unique Relationships allows compa-
Secure Tunneling
U
20% 36% 32%
P2P Filesharing nies to be more strategic, maintain competitive
Real-Time Entertainment
0% Web Browsing advantage and add market value for consum-
Jan 2010 Sep 2010
ers.
Mobile Video = 41% of Peak Hour Traffic,
Up from 27% in January Source: Morgan Stanley