1. H o u s i n g M a r k e t I n f o r m a t i o n
HousIng now
Halifax CMA
Canada Mortgage and Housing Corporation
Table of contents
Date Released: January 2010 1 Home Sales and Starts Finish
the Year Down While Prices
Home Sales and employment and wages. However,
economic uncertainty contributed to
Rise
Starts Finish the fewer MLS® sales and new housing 4 Map - Halifax CMA Total
starts in 2009 relative to 2008. Number of Starts
Year Down while Average sale prices in the existing
5 Housing Now Report Tables
Prices rise homes market grew by 3.2 per cent
over 2008’s strong growth rate 6 Report Tables (6-14)
A stable December concluded a of 6.6 per cent. In the new homes
mixed year for the 2009 Halifax market, following 2008’s average price 15 Glossary of Terms, Definitions
Regional Municipality (HRM) and Methodology
decline of one per cent, prices for a
housing market. The local economy new single-detached home in HRM 17 CMHC - Home to Canadians
remained resilient in 2009, with increased by 1.6 per cent to $335,070.
continued growth in the labour force,
Figure 1
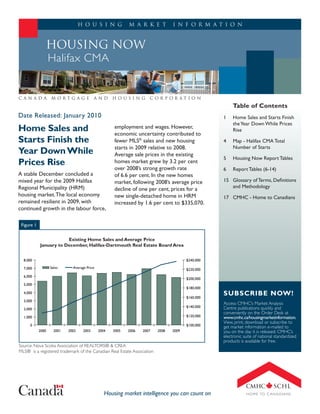
existing Home Sales and Average Price
January to December, Halifax-Dartmouth real estate board Area
8,000 $240,000
7,000 Sales Average Price $220,000
6,000
$200,000
5,000
$180,000
4,000
$160,000
SubScribe Now!
3,000
Access CMHC’s Market Analysis
$140,000 Centre publications quickly and
2,000
conveniently on the Order Desk at
1,000 $120,000 www.cmhc.ca/housingmarketinformation.
View, print, download or subscribe to
0 $100,000
get market information e-mailed to
2000 2001 2002 2003 2004 2005 2006 2007 2008 2009 you on the day it is released. CMHC’s
electronic suite of national standardized
products is available for free.
Source: Nova Scotia Association of REALTORS® & CREA
MLS® is a registered trademark of the Canadian Real Estate Association
Housing market intelligence you can count on
2. Housing Now - Halifax CMA - Date Released - January 2010
Figure 2
The percentage share of new
single-detached homes priced
under $250,000 declined in
Housing Starts by Type
January to December, Halifax cMA 2009 relative to 2008. Of the
1,209 new homes sold in 2008,
359 (29 per cent) were priced
3,500
Single Semi & Row Apartment & Other
under $250,000, compared to 246
3,000 (26 per cent) in 2009. Homes priced
2,500 between $250,000 and $399,999
experienced the largest gain in market
2,000
share in 2009, up to 55 per cent from
1,500 52 per cent in 2008.
1,000
The overall price increase in 2009
500 was a result of each submarket, with
0 the exception of Sackville, reporting
2000 2001 2002 2003 2004 2005 2006 2007 2008 2009 an increase in average sale price.
Halifax County East saw the largest
growth of 19 per cent, followed by
Source: CMHC
Dartmouth City (12 per cent), Fall
Overall starts remained stable in There was a 20 per cent decline in River – Beaverbank (eight per cent)
December with 106 units breaking new home sales in HRM in 2009 and Halifax City (seven per cent),
ground compared to 109 in 2008. compared to 2008. The average respectively.
Single starts experienced the largest price of a new single-detached home In the existing homes market, there
increase, up 42 per cent to 92 units. increased in 2009 to $335,070, up were 5,862 MLS® sales in HRM
Additionally, eight semi-detached units from $329,765 in 2008. The median last year, a decline of 5.6 per cent
broke ground in December, up from price in 2009 was $311,400, an compared to 6,210 in 2008. Halifax
six units in December 2008. There increase of four per cent over 2008’s City had the most existing home sales
were no condominium or rental units median of $299,900. in 2009 with 1,476 - three per cent
started in December 2009, compared fewer than the 1,520 recorded in
to ten and 20 units, respectively, in
2008.
Figure 3
For the year, total starts declined
17 per cent to 1,733 units, the lowest New construction Growth Limited to rental units
recorded level since 1,570 starts Percentage change 2009 vs 2008 - January to December - Halifax cMA
in 1982. The decrease was largely
attributed to a steep decline in single-
detached starts (down 26 per cent for Rental
the year), as well as significant declines
in apartment-style condominium units
Semi & Row
(down 45 per cent).
Single-detached starts fell to 874 Single
starts in 2009 compared to 1,177 in
2008. Single-detached starts were
down 45 per cent after the first five Apt Condo
months of 2009; however a strong
June began an upward trend which -50% -40% -30% -20% -10% 0% 10%
continued throughout the remainder
of 2009. Source: CMHC
Canada Mortgage and Housing Corporation 2
3. Housing Now - Halifax CMA - Date Released - January 2010
2008. MLS® sales in Dartmouth City
declined 14 per cent in 2009 to 1,438,
while sales in Sackville, Halifax County
East, and Fall River – Beaverbank
reported declines of 3.2, 2.9 and
0.2 per cent, respectively.
Despite the decline in sales in 2009,
the average price of an existing
home increased by 3.2 per cent
from $229,899 to $237,214, due in
large part to the mix of homes sold.
In other words, higher priced homes
captured a larger percentage share of
the market in 2009 and put upward
pressure on the average price
All submarkets in HRM, with
the exception of Halifax County
Southwest and Halifax County East,
recorded positive price growth
in 2009. The highest price growth
of 3.9 per cent was reported in
Dartmouth City with Bedford-
Hammond Plains (3.5 per cent)
and Halifax City (2.9 per cent)
experiencing the second and third
highest price growth. Sackville and Fall
River- Beaverbank reported modest
growth of 0.7 and 0.3 per cent,
respectively. Halifax County
Southwest experienced a decline in
prices of 0.5 per cent to $222,935,
while Halifax County East reported a
decline of two per cent to $182,395.
Average days on market for an
existing home in HRM increased
eight days to 95 days in 2009.
All submarkets in HRM, with the
exception of Halifax County East
recorded an increase in days on
market, with the largest increase
of 20 days reported in Fall River-
Beaverbank. Halifax County Southwest
reported an increase of eight days to
93 days, while Halifax City reported
a similar increase of nine days to 106
days on market.
Canada Mortgage and Housing Corporation 3
4. N Halifax CMA
Number of Starts (Singles)
MA
IN January - December 2009
ST
14
WAY
HIG H
W
2
AT
10
E R
AY
ST
HW
G
HI
Inset
14
WAY
HI
G
H
HW
HIG
AY
1
DR
CH
TE
RO
AE
Fall River-
Beaverbank
Sackville
Halifax County
HIG
R
H
D
East
WA
AL
Bedford-
NI
Y1
N
7
E
18 AY
NT
Hammonds Plains W
CE
H
G
BI
HA MM ON HI
DS PL AI
NS RD
RO
SS
RD
Dartmouth
City
Halifax
D
City K ER
DY
03
AY 1
Halifax County
HW
HIG
Southwest
33
Y3
H WA
HIG
OLD SAMBRO RD
Legend
89 - 115 starts
116 - 142 starts
143 - 169 starts
0 2 4 8 12 Not surveyed
Km
Canada Mortgage and Housing Corporation
Housing Now - Halifax CMA - Date Released - January 2010
4
5. Housing Now - Halifax CMA - Date Released - January 2010
HOUSING NOW REPORT TABLES
Available in ALL reports:
1 Housing Activity Summary of CMA
2 Starts by Submarket and by Dwelling Type – Current Month or Quarter
2.1 Starts by Submarket and by Dwelling Type – Year-to-Date
3 Completions by Submarket and by Dwelling Type – Current Month or Quarter
3.1 Completions by Submarket and by Dwelling Type – Year-to-Date
4 Absorbed Single-Detached Units by Price Range
5 MLS® Residential Activity
6 Economic Indicators
Available in SELECTED Reports:
1.1 Housing Activity Summary by Submarket
1.2 History of Housing Activity (once a year)
2.2 Starts by Submarket, by Dwelling Type and by Intended Market – Current Month or Quarter
2.3 Starts by Submarket, by Dwelling Type and by Intended Market – Year-to-Date
2.4 Starts by Submarket and by Intended Market – Current Month or Quarter
2.5 Starts by Submarket and by Intended Market – Year-to-Date
3.2 Completions by Submarket, by Dwelling Type and by Intended Market – Current Month or Quarter
3.3 Completions by Submarket, by Dwelling Type and by Intended Market – Year-to-Date
3.4 Completions by Submarket and by Intended Market – Current Month or Quarter
3.5 Completions by Submarket and by Intended Market – Year-to-Date
4.1 Average Price ($) of Absorbed Single-Detached Units
SYMBOLS
n/a Not applicable
* Totals may not add up due to co-operatives and unknown market types
** Percent change > 200%
- Nil
-- Amount too small to be expressed
SA Monthly figures are adjusted to remove normal seasonal variation
Canada Mortgage and Housing Corporation 5
13. Housing Now - Halifax CMA - Date Released - January 2010
Table 5: MLS® Residential Activity by Submarket
December 2009 December 2008 % Change
Submarket Average Average Average Average Average Average
Active Active Active
Sales Sale Price Days on Sales Sale Price Days on Sales Sale Days on
Listings Listings Listings
($) Market ($) Market Price Market
Halifax City 74 288,889 148 610 38 286,043 151 782 94.7 1.0 -2.0 -22.0
Dartmouth City 71 206,492 96 522 43 203,467 112 614 65.1 1.5 -14.3 -15.0
Bedford-Hammonds Plains 35 297,258 103 295 32 349,704 179 373 9.4 -15.0 -42.5 -20.9
Sackville 15 184,760 65 168 14 171,486 77 153 7.1 7.7 -15.6 9.8
Halifax County Southwest 27 234,048 116 231 22 221,538 106 340 22.7 5.6 9.4 -32.1
Halifax County East 17 176,747 117 217 22 205,050 110 213 -22.7 -13.8 6.4 1.9
Outside Halifax-Dartmouth Board 24 189,385 132 279 19 144,917 109 326 26.3 30.7 21.1 -14.4
Fall River-Beaver Bank 20 242,726 76 239 19 217,695 103 285 5.3 11.5 -26.2 -16.1
Halifax CMA 283 240,063 114 2561 209 236,768 125 3086 35.4 1.4 -9.1 -17.0
Year-to-date 2009 Year-to-date 2008 % Change
Submarket Average Average Average Average Average Average
Sales Sale Price Days on Sales Sale Price Days on Sales Sale Days on
($) Market ($) Market Price Market
Halifax City 1,476 281,373 106 1520 273,539 97 -2.9 2.9 9.3
Dartmouth City 1,438 214,382 81 1668 206,321 77 -13.8 3.9 5.2
Bedford-Hammonds Plains 719 303,810 102 710 293,601 95 1.3 3.5 7.4
Sackville 456 181,402 69 471 180,102 68 -3.2 0.7 1.5
Halifax County Southwest 523 222,935 93 515 224,066 85 1.6 -0.5 9.4
Halifax County East 336 182,395 99 346 186,109 101 -2.9 -2.0 -2.0
Outside Halifax-Dartmouth Board 493 166,016 99 558 158,922 87 -11.6 4.5 13.8
Fall River-Beaver Bank 421 251,964 109 422 251,184 89 -0.2 0.3 22.5
Halifax CMA 5,862 237,214 95 6210 229,899 87 -5.6 3.2 8.7
MLS® is a registered trademark of the Canadian Real Estate Association (CREA).
Source: Nova Scotia Association of REALTORS®
Canada Mortgage and Housing Corporation 13
14. Housing Now - Halifax CMA - Date Released - January 2010
Table 6: Economic Indicators
December 2009
Interest Rates Halifax Labour Market
NHPI, Total, CPI,
P&I Mortage Rates (%) Halifax CMA 2002 Average
Employment Unemployment Participation
Per 1997=100 =100 Weekly
1 Yr. 5 Yr. SA (,000) Rate (%) SA Rate (%) SA
$100,000 Earnings ($)
Term Term
2008 January 725 7.35 7.39 146.4 112.9 209 4.6 69.7 690
February 718 7.25 7.29 146.4 113.4 210 4.5 69.7 686
March 712 7.15 7.19 148.2 113.9 209 4.9 69.6 688
April 700 6.95 6.99 148.2 114.8 208 4.9 69.4 693
May 679 6.15 6.65 148.8 116.2 208 5.1 69.2 695
June 710 6.95 7.15 149.4 116.9 208 5.4 69.4 699
July 710 6.95 7.15 149.8 116.9 208 5.5 69.4 703
August 691 6.65 6.85 149.8 116.9 207 5.6 69.1 715
September 691 6.65 6.85 150.0 116.8 208 5.3 69.1 725
October 713 6.35 7.20 150.1 115.8 209 5.4 69.6 734
November 713 6.35 7.20 150.1 114.5 213 5.3 70.5 738
December 685 5.60 6.75 150.3 113.0 213 5.3 70.7 741
2009 January 627 5.00 5.79 150.4 113.1 214 5.6 71.2 744
February 627 5.00 5.79 150.5 113.9 215 5.9 71.6 755
March 613 4.50 5.55 150.5 114.1 216 6.0 71.8 758
April 596 3.90 5.25 150.5 114.7 216 5.9 71.6 759
May 596 3.90 5.25 150.5 115.3 216 5.8 71.7 749
June 631 3.75 5.85 150.5 116.0 217 5.9 71.8 748
July 631 3.75 5.85 150.5 116.1 218 6.0 72.2 746
August 631 3.75 5.85 150.5 116.2 216 6.4 71.9 754
September 610 3.70 5.49 150.7 116.3 215 6.6 71.6 755
October 630 3.80 5.84 150.7 115.4 214 6.8 71.3 755
November 616 3.60 5.59 151.1 116.5 214 6.9 71.4 749
December 610 3.60 5.49 115.8 215 6.8 71.5 751
"P & I" means Principal and Interest (assumes $100,000 mortgage amortized over 25 years using current 5 year interest rate)
"NHPI" means New Housing Price Index
"CPI" means Consumer Price Index
"SA" means Seasonally Adjusted
Source: CMHC, adapted from Statistics Canada (CANSIM), Statistics Canada (CANSIM)
Canada Mortgage and Housing Corporation 14
15. Housing Now - Halifax CMA - Date Released - January 2010
Methodology
Starts & Completions Survey Methodology
The Starts and Completions Survey is conducted by way of site visits which are used to confirm that new units have reached set stages
in the construction process. Since most municipalities in the country issue building permits, these are used as an
indication of where construction is likely to take place. In areas where there are no permits, reliance has to be placed either on local
sources or searching procedures.
The Starts and Completions Survey is carried out monthly in urban areas with population in excess of 50,000, as defined by the 2006
Census. In urban areas with populations of 10,000 to 49,999, all Starts are enumerated in the last month of the quarter (i.e. four
times a year, in March, June, September and December). In these centres with quarterly enumeration, Completion activity is modelled
based on historical patterns. Monthly Starts and Completions activity in these quarterly locations are statistically estimated at a provincial
level for single and multi categories. Centres with populations below 10,000 are enumerated on a sample basis, also in the last month of
each quarter (i.e. four times a year, in March, June, September and December).
The Starts and Completions Survey enumerates dwelling units in new structures only, designed for non-transient and year-round
occupancy.
Mobile homes are included in the surveys. A mobile home is a type of manufactured house that is completely assembled in a factory
and then moved to a foundation before it is occupied.
Trailers or any other movable dwelling (the larger often referred to as a mobile home) with no permanent foundation are excluded from
the survey.
Conversions and/or alterations within an existing structure are excluded from the surveys as are seasonal dwellings, such as: summer
cottages, hunting and ski cabins, trailers and boat houses; and hostel accommodations, such as: hospitals, nursing homes, penal
institutions, convents, monasteries, military and industrial camps, and collective types of accommodation such as: hotels, clubs, and lodging
homes.
Market Absorption Survey Methodology
The Market Absorption Survey is carried out in conjunction with the Starts and Completions Survey in urban areas with populations in
excess of 50,000. When a structure is recorded as completed, an update is also made as units are sold or rented. The dwellings are
then enumerated each month until such time as full absorption occurs.
STARTS AND COMPLETIONS SURVEY AND MARKET
ABSORPTION SURVEY DEFINITIONS
A “dwelling unit”, for purposes of the Starts and Completions Survey, is defined as a structurally separate set of self-contained living premises with a
private entrance from outside the building or from a common hall, lobby, or stairway inside the building. Such an entrance must be one that can be
used without passing through another separate dwelling unit.
A “start”, for purposes of the Starts and Completions Survey, is defined as the beginning of construction work on a building, usually when the concrete
has been poured for the whole of the footing around the structure, or an equivalent stage where a basement will not be part of the structure.
The number of units “under construction” as at the end of the period shown, takes into account certain adjustments which are necessary for
various reasons. For example, after a start on a dwelling has commenced construction may cease, or a structure, when completed, may contain more
or fewer dwelling units than were reported at start.
A “completion”, for purposes of the Starts and Completions Survey, is defined as the stage at which all the proposed construction work on a dwelling
unit has been performed, although under some circumstances a dwelling may be counted as completed where up to 10 per cent of the proposed work
remains to be done.
The term “absorbed” means that a housing unit is no longer on the market (i.e. has been sold or rented). This usually happens when a binding
contract is secured by a non-refundable deposit and has been signed by a qualified purchaser. The purpose of the Market Absorption Survey is to
measure the rate at which units are sold or rented after they are completed, as well as collect prices.
Canada Mortgage and Housing Corporation 15
16. Housing Now - Halifax CMA - Date Released - January 2010
DWELLING TYPES:
A “Single-Detached” dwelling (also referred to as “Single”) is a building containing only one dwelling unit, which is completely
separated on all sides from any other dwelling or structure. Includes link homes, where two units may share a common
basement wall but are separated above grade. Also includes cluster-single developments.
A “Semi-Detached (Double)” dwelling (also referred to as “Semi”) is one of two dwellings located side-by-side in a building,
adjoining no other structure and separated by a common or party wall extending from ground to roof.
A “Row (Townhouse)” dwelling is a one family dwelling unit in a row of three or more attached dwellings separated by a
common or party wall extending from ground to roof.
The term “Apartment and other” includes all dwellings other than those described above, including structures commonly
known as stacked townhouses, duplexes, triplexes, double duplexes and row duplexes.
Intended market:
The “intended market” is the tenure in which the unit is being marketed. This includes the following categories:
Freehold: A residence where the owner owns the dwelling and lot outright.
Condominium (including Strata-Titled): An individual dwelling which is privately owned, but where the building and/or
the land are collectively owned by all dwelling unit owners. A condominium is a form of ownership rather than a type of house.
Rental: Dwelling constructed for rental purposes regardless of who finances the structure.
Geographical terms:
A census metropolitan area (CMA) or a census agglomeration (CA) is formed by one or more adjacent municipalities centred
on a large urban area (known as the urban core). The census population count of the urban core is at least 10,000 to form a
census agglomeration and at least 100,000 to form a census metropolitan area. To be included in the CMA or CA, other
adjacent municipalities must have a high degree on integration with the central urban area, as measured by commuting
flows derived from census place of work data. CMAs and CAs contain whole municipalities or Census Subdivisions.
A “Rural” area, for the purposes of this publication, is a centre with a population less than 10,000.
All data presented in this publication is based on Statistics Canada’s 2006 Census area definitions, except the Economic
Indicators data (Table 6) which is based on Statistics Canada’s 2001 Census area definitions.
Canada Mortgage and Housing Corporation 16
18. Housing market
intelligence
you can count on
FREE REPORTS AVAILABLE ON-LINE CMHC’s Market Analysis
n Canadian Housing Statistics Centre e-reports provide
a wealth of detailed local,
n Housing Information Monthly
provincial, regional and national
n Housing Market Outlook, Canada market information.
n Housing Market Outlook, Highlight Reports – Canada and Regional
Forecasts and Analysis –
n Housing Market Outlook, Major Centres Future-oriented information
n Housing Market Tables: Selected South Central Ontario Centres about local, regional and
n Housing Now, Canada national housing trends.
n Housing Now, Major Centres Statistics and Data –
n Housing Now, Regional Information on current
housing market activities —
n Monthly Housing Statistics
starts, rents, vacancy rates
n Northern Housing Outlook Report
and much more.
n Preliminary Housing Start Data
n Renovation and Home Purchase Report
n Rental Market Provincial Highlight Reports Now semi-annual!
n Rental Market Reports, Major Centres
n Rental Market Statistics Now semi-annual!
n Residential Construction Digest, Prairie Centres
n Seniors’ Housing Reports
n Seniors’ Housing Reports - Supplementary Tables, Regional
Get the market intelligence you need today!
Click www.cmhc.ca/housingmarketinformation
to view, download or subscribe.
64155_2010_M01
Discover Affordable Housing Solutions
CMHC’s Affordable Housing Centre works with the private sector and industry professionals
to develop affordable housing solutions in communities across Canada. Learn more about our
programs, successful projects, or contact an expert.