Apidays Singapore 2024 - Scalable LLM APIs for AI and Generative AI Applicati...
Mapping toolbox
1. Mapping Toolbox 3.2
Analyze and visualize geographic information
Mapping Toolbox™ provides tools and utilities for analyzing geographic data and creating map displays. You can
import vector and raster data from shapefile, GeoTIFF, SDTS DEM, or other file formats, as well as Web-based
data from Web Map Service (WMS) servers. The toolbox lets you customize the imported data by subsetting,
trimming, intersecting, adjusting spatial resolution, and applying other methods. With features for fields such as
geodesy, navigation, and digital terrain analysis, the toolbox enables you to develop geospatial analyses and
illustrate the results. Geographic data can be combined with base map layers from multiple sources in a single map
display.
Mapping Toolbox and MATLAB® enable you to develop customized solutions to geospatial problems such as
predicting weather patterns, modeling the movement of glacial land masses, or finding optimal locations for wind
turbines. With function-level access to all key features in the toolbox and the high-level MATLAB language, you
can develop innovative algorithms and automate your workflow for repetitive tasks.
Key Features
▪ Vector and raster data import and export from standard formats and specific data products
▪ Data retrieval from Web Map Service (WMS) servers for customized geographic data sets and related
metadata
▪ 2D and 3D map display, customization, and interaction
▪ Digital terrain and elevation model analysis functions, including profile, gradient, line-of-sight, and viewshed
calculations
▪ Geometric geodesy, including distance and area calculations, 3D coordinate transformations, and more than
65 map projections
▪ Utilities for converting units, adjusting spatial resolution, wrapping longitudes, and managing spatially
referenced images and raster data
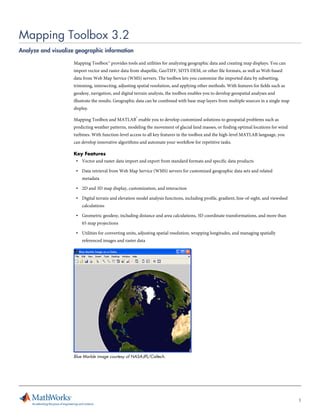
Blue Marble image courtesy of NASA-JPL/Caltech.
1
2. Import and Export Geographic Data
Mapping Toolbox imports a wide range of GIS and geospatial file formats, enabling you to read both vector and
raster data into the MATLAB environment. The toolbox helps you reduce access time and improve memory usage
by providing functionality for specific file types to read a portion of a file and downsample data prior to use. The
toolbox supports georeferenced imagery and other raster data grids, including orthoimagery, satellite swath data,
digital terrain elevation models, and various global data grids.
Mapping Toolbox also exports data to a number of file formats, enabling you to share data with applications such
as Google Earth™ and ArcGIS. Using the toolbox with MATLAB or Image Processing Toolbox™ provides access to
additional file formats.
File formats and data products supported by Mapping Toolbox include:
▪ Raster file formats, such as GeoTIFF, USGS DEM, DEM, DTED, Arc ASCII Grid, GTOPO30, ETOPO, and
worldfile
▪ Vector file formats, such as ESRI shapefiles, KML, VMAP0, DCW, and GSHHS
▪ Selected data products, such as AVHRR and EGM96
File formats supported by MATLAB include:
▪ Image file formats, such as TIFF, JPEG, PNG, and JPEG2000
▪ Scientific data formats, such as NetCDF, HDF5, HDF4, HDF-EOS, and multiband files (BIP, BIL, BSQ)
File formats supported by Image Processing Toolbox include:
▪ Image file formats, such as NITF and HDR
Access Web Map Service (WMS) Servers
With Mapping Toolbox, you can find and download raster data from WMS servers. Many government and
commercial organizations, such as NASA, ESA, USGS, NOAA, ESRI, and Microsoft, adhere to the WMS protocol
for rendering, reprojecting, and serving georeferenced data sets over the Internet. Mapping Toolbox enables you
to access elevation, oceanography, weather, satellite imagery, and many other raster data sets in MATLAB.
To assist with identifying WMS data layers that are appropriate to your application, the toolbox provides a
prequalified database of WMS servers and layers that enables you to search for an appropriate data set by layer
name, server name, location, and other terms. To request and retrieve a map with appropriate characteristics, such
as spatial resolution and geographic limits, the toolbox provides functions and classes that enable you to define a
custom map request, submit it to the server, and retrieve a map into a file or directly into MATLAB for
processing.
2
3. Collapse of the Larsen Ice Shelf, Antarctica, over a 3-month period. Original coastline segmented using Image
Processing Toolbox. Images courtesy of NASA/Goddard Space Flight Center Scientific Visualization Studio.
A composite map of San Francisco created with functions in Mapping Toolbox. Data courtesy of U.S. Geological
Survey and retrieved via Microsoft TerraServer.
Create 2D and 3D Map Displays
Mapping Toolbox provides a broad set of visualization functions to combine vector and raster data and produce
customized 2D and 3D map displays. The map displays can be simple or sophisticated, and can be tuned to your
application. You can readily combine data sets of different scales and modalities in the same display. For example,
you can display images and data grids in their correct positions—regardless of cell size, pixel size, or area
covered—and then overlay vector map features.
Function-level access to map display capabilities in the toolbox enables automatic creation of frequently used map
displays. For example, you can use batch mode processing to examine a geospatial time-series data set and create
an animated display that shows how the data changes over time. Functionality in MATLAB enables you to save
animated map figures to a movie or GIF file.
With the visualization functions in the toolbox, you can:
3
4. ▪ Create scatter, line, polygon, quiver, comet, and stem plots
▪ Annotate your map with a scale ruler, north arrow, contour labels, and legends
▪ Customize map markers, colors, and line styles
▪ Vary transparency for polygons and raster data sets
▪ Control latitude-longitude grid and meridian and parallel labels
▪ Apply special colormaps for contour maps, terrain, bathymetry grids, and political maps
▪ Control lighting, shading, and perspective
Map display of eastern Massachusetts town borders and hydrology with a scale ruler, north arrow, and an inset map
of the Northeast United States. Image courtesy of Office of Geographic and Environmental Information (MassGIS).
Overlay of raster and vector data layers for Concord, Massachusetts. Data courtesy of Office of Geographic and
Environmental Information (MassGIS).
Analyze Digital Terrain and Elevation Models
Mapping Toolbox supports the visualization and analysis of 3D data, such as digital terrain, bathymetry, and other
gridded-data products. It provides functions to visualize terrain data and add annotations such as contour lines.
You can control lighting, shading, colormaps, and other aspects of the display. The MATLAB graphics
environment enables you to reposition the figure camera interactively and programmatically to view your data
from different perspectives.
4
5. The toolbox also provides functions to calculate gradient, slope, aspect, line-of-sight visibility, and viewshed. You
can use these functions in applications such as the placement of communication towers, where you need to
calculate the direct line-of-sight from many vantage points to determine the optimal location.
You can also use Mapping Toolbox with Simulink 3D Animation™ to create a virtual reality world from elevation
data; you can then couple the terrain data with analysis provided by other products. For example, you can use
Aerospace Blockset™ with your virtual world to perform tasks such as visualizing flight paths over geographic data
sets.
Digital terrain visualization of the Grand Canyon image with contour data. DEM data courtesy of NASA-JPL/Caltech.
Topographic data courtesy U.S. Geological Survey and retrieved via Microsoft TerraServer.
Apply Geometric Geodesy, Map Projections, and Utilities
Geometric Geodesy
With Mapping Toolbox, your calculations can account for the curvature of Earth and other planetary bodies. You
can find the surface area of arbitrary polygons or quadrangles on spheres and ellipsoids, calculate the intersections
of geometric objects, compute the distance between points on a sphere or ellipsoid, and find the overlapping area
between polygons. Navigation functionality enables you to perform tasks such as calculating and correcting for
wind and current vectors based on heading and air or ground speed.
The toolbox also provides 3D coordinate transformations between geodetic and geocentric coordinate systems.
These provide key functionality when implementing Helmert transformations and 3D datum transformations that
you would need, for example, to combine data referenced to WGS84 with legacy maps based on older datums.
5
6. Weather data on top of satellite imagery for the continental United States. Image Processing Toolbox is used to
segment the primary storm from national weather data, and geodetic calculations are made using Mapping Toolbox to
find the area of the storm. Data courtesy of NOAA, as retrieved via the Iowa Environmental Mesonet WMS Server,
and NASA-JPL/Caltech.
Map Projections
Mapping Toolbox contains more than 65 of the most popular and important map projections for displaying the
curved surface of planetary bodies on a 2D map display. They include equal-area, equidistant, conformal, and
compromise projections in the cylindrical, conic, and azimuthal classes. The toolbox also supports projections in
the PROJ.4 library and the UTM/UPS systems. Many projections support both spherical and ellipsoidal models of
Earth and other bodies.
With the toolbox, you can apply forward and inverse transformations of positions and direction angles or
azimuths, enabling the reprojection of vector data into alternative systems. Raster and image data displays can be
projected in map visualizations to match the coordinate systems of other data sets. You can also explore the
properties of your projection by trimming the data to a particular latitude-longitude extent, calculating distortion
parameters at a point, or visualizing map distortions as Tissot Indicatrices or scale-distortion contours.
Mercator, Mollweide, and sinusoidal projections (clockwise from top). Images courtesy NASA-JPL/Caltech.
6