
Recommandé
Recommandé
Contenu connexe
Similaire à 104774013 mb0040-mb0040-–-statistics-for-management-november-2012
Similaire à 104774013 mb0040-mb0040-–-statistics-for-management-november-2012 (20)
Dernier
Dernier (20)
104774013 mb0040-mb0040-–-statistics-for-management-november-2012
- 1. May 2012 Master of Business Administration- MBA Semester 1 MB0040 – Statistics for Management - 4 Credits (Book ID: B1129) Assignment Set - 1 (60 Marks) Note: Each question carries 10 Marks. Answer all the questions. Q1. Define “Statistics”. What are the functions of Statistics? Distinguish between Primary data and Secondary data. An : Statistics is a mathematical science pertaining to the collection, analysis, interpretation or explanation, and presentation of data. It also provides tools for prediction and forecasting based on data. It is applicable to a wide variety of academic disciplines, from the natural and social sciences to the humanities, government and business. Statistical methods can be used to summarize or describe a collection of data; this is called descriptive statistics. In addition, patterns in the data may be modeled in a way that accounts for randomness and uncertainty in the observations, and are then used to draw inferences about the process or population being studied; this is called inferential statistics. Descriptive, predictive, and inferential statistics comprise applied statistics. There is also a discipline called mathematical statistics, which is concerned with the theoretical basis of the subject. Moreover, there is a branch of statistics called exact statistics that is based on exact probability statements. The word statistics can either be singular or plural. In its singular form, statistics refers to the mathematical science discussed in this article. In its plural form, statistics is the plural of the word statistic, which refers to a quantity (such as a mean) calculated from a set of data. Management
- 2. in all business and organizational activities is the act of getting people together to accomplish desired goals andobjectivesusing available resources efficiently and effectively. Management comprisesplanning,organizing,staffing,leadingor directing, andcontrollinganorganization(a group of one or more people or entities) or effort for the purpose of accomplishing a goal.Resourcingencompasses the deployment and manipulation of human resources,financialresources,technologicalresources, and natural resources. Since organizations can be viewed assystems,management can also be defined as human action, including design, to facilitate the production of useful outcomes from a system. This view opens the opportunity to 'manage' oneself, a pre-requisite to attempting to manage others. Management operates through various functions, often classified as planning, organizing, staffing, leading/directing, controlling/monitoring and motivation. Planning: Deciding what needs to happen in the future (today, next week, next month, next year, over the next five years, etc.) and generating plans for action. Organizing : (Implementation) making optimum use of the resources required to enable the successful carrying out of plans. Staffing: Job analysis, recruitment, and hiring for appropriate jobs. Leading/directing : Determining what needs to be done in a situation and getting people to dot. Controlling/monitoring: Checking progress against plans. Motivation: Motivation is also a kind of basic function of management, because without motivation, employees cannot work effectively. If motivation does not take place in an
- 3. organization, then employees may not contribute to the other functions (which are usually set by top-level management). Basic roles Interpersonal: roles that involve coordination and interaction with employees. Difference between primary and secondary data : Primary Data 1. Primary data are always original as it is collected by the investigator. 2. Suitability of the primary data will be positive because it has been systematically collected. 3. Primary data are expensive and time consuming. 4. Extra precautions are not required. 5. Primary data are in the shape of raw material. 6. Possibility of personal prejudice. Secondary Data
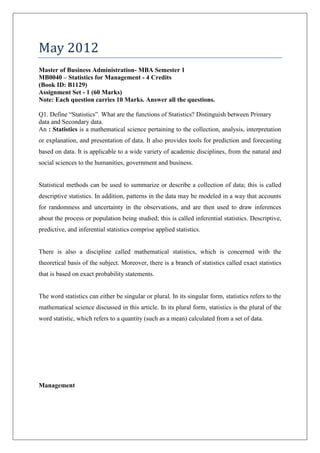
- 4. 1. Secondary data lacks originality. The investigator makes use of the data collected by other agencies. 2. Secondary data may or may not suit the objects of enquiry. 3. Secondary data are relatively cheaper. 4. It is used with great care and caution. 5. Secondary data are usually in the shape of readymade products. 6. Possibility of lesser degree of personal prejudice. Q2. Draw a histogram for the following distribution: Age Age 0-10 10-20 20-30 30-40 40-50 No. Of 2 5 10 8 4 People Age No of People 0-10 2 10-20 5 20-30 10 30-40 8 40-50 4
- 5. histogram diagram 12 10 8 people 6 4 2 0 10 20 30 40 50 Q3. Find the (i) arithmetic mean and (ii) the Age median value of the following set of values: 40, 32, 24, 36, 42, 18, 10. x =Σ fixi/ Σfi (40+32+24+36+42+18+10)/7=28.85 Median value 10,18,24,32,36,40,42 N=7 Median =(N+1)/2 th =(7+1)/2 =4 M=32 Q4. Calculate the standard deviation of the following data: Marks 78-80 80-82 82-84 84-86 86-88 88-90 No. Of 3 15 26 23 9 4 Students
- 6. Class interval Mead valueX Frequency „f‟ d=X-83/2 fd fd² 78-80 79 3 -2 -6 12 80-82 81 15 -1 -15 15 82-84 83 26 0 0 0 84-86 85 23 1 23 23 86-88 87 9 2 18 36 88-90 89 4 3 12 36 80 32 122 σ²=[Σfd²/n-[Σfd/Σf]²]x(C.I)² σ²=[122/80-[32/80]²]x4=5.46 standard deviation=σ=2.336 Q5. Explain the following terms with respect to Statistics: (i) Sample, (ii) Variable, (iii) Population. Instatistics,a sample is asubsetof apopulation.Typically, the population is verylarge, making acensusor a completeenumerationof all the values in the population impracticalor impossible. The sample represents a subset of manageable size. Samples are collected andstatistics are calculated from the samples so that one can makeinferencesorextrapolationsfromthe sample to the population. This process of collecting information from a sample is referred toassampling. A complete sample is a set of objects from a parent population that includes ALL such objectsthat satisfy a set of well-defined selection criteria. For example, a complete sample of Australianmen taller than 2m would consist of a list of every Australian male taller than 2m. But it wouldn'tinclude German males, or tall Australian females, or people shorter than 2m. So to compile sucha complete sample requires a complete list of the parent population, including data on height,gender, and nationality for each member of that parent population. In the case of humanpopulations, such a complete list is unlikely to exist, but such complete samples are oftenavailable in other disciplines, such as complete magnitude-limited samples of astronomicalobjects.An unbiased sample is a set of objects chosen from a complete sample using a selection processthat does not depend on the properties of the objects. For example, an unbiased sample of Australian men taller than 2m might consist of a randomly sampled subset of 1% of Australianmales taller than 2m. But one chosen from the electoral register might not be unbiased since, forexample, males aged under 18 will not be on the electoral register. In an astronomical context, anunbiased sample might consist of that fraction of a complete sample for which data are available,provided the data availability is not biased by individual source properties.The best way to avoid a biased or unrepresentative sample is to select arandom sample,alsoknown as a probability sample. A random sample is defined as a sample where each individualmember of the population has a known, non- zero chance of being selected as part of the sample.
- 7. MB0040-STATISTICS FOR MANAGEMENT MB0040 Page 13 Several types of random samples aresimple random samples, systematic samples, stratifiedrandom samples,andcluster random samples. (ii) Variable A variable is a characteristic that may assume more than one set of values to which anumerical measure can be assigned.Height, age, amount of income, province or country of birth, grades obtained at school and typeof housing are all examples of variables. Variables may be classified into various categories,some of which are outlined in this section. Categorical variables: A categorical variable (also called qualitative variable) is one for whicheach response can be put into a specific category. These categories must be mutually exclusiveand exhaustive. Mutually exclusive means that each possible survey response should belong toonly one category, whereas, exhaustive requires that the categories should cover the entire set of possibilities. Categorical variables can be either nominal or ordinal. Nominal variables: Anominal variableis one that describes a name or category. Contrary toordinal variables, there is no 'natural ordering' of the set of possible names or categories.Ordinal variables: Anordinal variableis a categorical variable for which the possible categoriescan be placed in a specific order or in some 'natural' way.Numeric variables: Anumeric variable,also known as a quantitative variable, is one that canassume a number of real values — such as age or number of people in a household. However, notall variables described by numbers are considered numeric. For example, when you are asked toassign a value from 1 to 5 to express your level of satisfaction, you use numbers, but the variable(satisfaction) is really an ordinal variable. Numeric variables may be either continuous ordiscrete.Continuous variables: A variable is said to be continuous if it can assume an infinite number of real values. Examples of acontinuous variabl e are distance, age and temperature.The measurement of a continuous variable is restricted by the methods used, or by the accuracyof the measuring instruments. For example, the height of a student is a continuous variablebecause a student may be 1.6321748755... metres tall.Discrete variables: As opposed to a continuous variable, adiscrete variable can only take a finitenumber of real values. An example of a discrete variable would be the score given by a judge toa gymnast in competition: the range is 0 to 10 and the score is always given to one decimal (e.g.,a Population A statistical population is a set of entities concerning whichstatistical inferencesare tobe drawn, often based on arandom sampletaken from the population. For example, if wewere interested in generalizations aboutcrows,then we would describe the set of crowsthat is of interest. Notice that if we choose a population like all crows, we will be limitedto observing crows that ulatixist now or will exist in the future. Probably,geographywillalso constitute a limitation in that our resources for studying crows are also limited.Population is also used to refer to a set of potentialmeasurementsor values, including notonly cases actually observed but those that are potentiallyobservable.Suppose, forexample, we are interested in the set of all adult crows now alive in the county of Cambridge shire,and we want to know the mean weight of these birds. For each bird inthe population of crows there is a weight, and the set of these weights is called thepopulation of weights. Asubsetof a population is called a subpopulation. If different subpopulations havedifferent properties, the properties and response of the overall population can often bebetter understood if it is first separated into distinct subpopulations.
- 8. For instance, a particular medicine may have different effects on differentsubpopulations, and these effects may be obscured or dismissed if such specialsubpopulations are not identified and examined in isolation. Similarly, one can often estimate parameters more accurately if one separates outsubpopulations: distribution of heights among people is better modeled by consideringmen and women as separate subpopulations, for instance. Populations consisting of subpopulations can be modeled bymixture models,whichcombine the distributions within subpopulations into an overall population distribution. 6) An unbiased coin is tossed six times. What is the probability that the tosses will result in: (i) at least four heads, and (ii) exactly two heads Let „A‟ be the event of getting head. Given that: (iI) The probability that the tosses will result in exactly two heads is given by: herefore, the probability that the tosses will result in exactly two heads is 15/64. (I)probability of at least four heads P(X>=4) =P(X=4)+P(X=5)+P(X=6) = 22/64=11/32 May 2012 Master of Business Administration- MBA Semester 1 MB0040 – Statistics for Management - 4 Credits (Book ID: B1129) Assignment Set - 2 (60 Marks) Note: Each question carries 10 Marks. Answer all the questions. Q1. Find Karl Pearson‟s correlation co-efficient for the data given in the below table: X 18 16 12 8 4
- 9. Y 22 14 12 10 8 X Y X² Y² XY 18 22 324 484 396 16 14 256 196 224 12 12 144 144 144 8 10 64 100 80 4 8 16 64 32 ΣX=58 ΣY=66 ΣX²=804 ΣY²=988 ΣXY=876 R=NΣXY- ΣX ΣY/(N ΣX²-( ΣX)²)½X(N ΣY²-(ΣY)²)½ R= 0.89 Q2. Find the (i) arithmetic mean (ii) range and (iii) median of the following data: 15, 17, 22, 21, 19, 26, 20. (I) Arithmatic mean We have n=7 X=Σxi/n X=(15+17+22+21+19+26+20)/7 =140/7 =20 (II)range R=H-L =26-15 =11 (iii) median 15,17,19,20,21,22,26 M=(n+1)/2 =8/2th =4th Q3. What is the importance of classification of data? What are the types of classification of data? Classification of Data perform many function 1) It condenses the bulk data 2) It simplifies data and makes the datamore comprehensible 3) It faciliates comparison of charactristic
- 10. 4) It renderthe dataready for any statistical analysis. Types of classification. 1) Geo graphical classification 2) Charonological classification 3) Conditional classification 4) Qualatative 5) Quantative classificaation 6) Statstical series Q4. The data given in the below table shows the production in three shifts and the number of defective goods that turned out in three weeks. Test at 5% level of significance whether the weeks and shifts are independent. Shift 1st Week 2nd Week 3rd Week Total I 15 5 20 40 II 20 10 20 50 III 25 15 20 60 Total 60 30 60 150 Q5. What is sampling? Explain briefly the types of sampling The sampling techniques may be broadly classified into 1. Probability sampling 2. Non-probability sampling Probability Sampling: Probability sampling provides a scientific technique of drawing samples from the population. The technique of drawing samples is according to the law in which each unit has a probability of being included in the sample. Simple random sampling Under this technique, sample units are drawn in such a way each and every unit in the population has an equal and independent chance of being included in the sample. If a sample unit is replaced before drawing the next unit, then it is known as simple Random Sampling with Replacement. If the sample unit is not replaced before drawing the next unit, then it is case, probability of drawing a unit is 1/N, where N is the population size. In the case probability of drawing a unit is 1/Nn. Stratified random sampling This sampling design is most appropriate if the population is heterogeneous with respect to characteristic under study or the population distribution is highly skewed. Table: Merits and demerits of stratified random sampling Merits Demerits 1. Sample is more representative 1. Many times the stratification is not effective 2. Provides more efficient estimate 2. Appropriate sample sizes are not drawn from each of the stratum 3. Administratively more convenient 4. Can be applied in situation where different degrees of accuracy is desired for different segments of population Systematic sampling This design is recommended if we have a complete list of sampling units arranged in some systematic order such as geographical, chronological or alphabetical order.
- 11. Table: Merits and demerits of systematic sampling Merits Demerits 1. Very easy to operate and easy to check. 1. Many case we do not get up-to-date list. 2. It saves time and labour. 2. It gives biased results if periodic feature exist in the data. 3. More efficient than simple random sampling if we have up-to-date frame. Cluster sampling The total population is divided into recognizable sub-divisions, known as clusters such that within each cluster they are homogenous. The units are selected from each cluster by suitable sampling techniques. Multi-stage sampling The total population is divided into several stages. The sampling process is carried out through several stages Non-probability sampling: Depending upon the object of inquiry and other considerations a predetermined number of sampling units is selected purposely so that they represent the true characteristics of the population. Judgment sampling The choice of sampling items depends exclusively on the judgment of the investigator. The investigator‟s experience and knowledge about the population will help to select the sample units. It is the most suitable method if the population size is less. Table: Merits and demerits of judgment sampling Merits Demerits 1. Most useful for small population 1. It is not a scientific method. 2. Most useful to study some unknown traits of a population some of whose characteristics are known. 2. It has a risk of investigator‟s bias being introduced. 3. Helpful in solving day-to-day problems. Convenience sampling The sampling units are selected according to convenience of the investigator. It is also called “chunk” which refer to the fraction of the population being investigated which is selected neither by probability nor by judgment. Quota sampling It is a type of judgment sampling. Under this design, quotas are set up according to some specified characteristic such as age groups or income groups. From each group a specified number of units are sampled according to the quota allotted to the group. Within the group the selection of sampling units depends on personal judgment. It has a risk of personal prejudice and bias entering the process. This method is often used in public opinion studies. Q6. Suppose two houses in a thousand catch fire in a year and there are 2000 houses in a village. What is the probability that: (i) none of the houses catch fire and (ii) At least one house catch fire? An : Given the probability of a house catching fire is P=2/1000=0.002 and n=2000 .‟.m=nap=2000*0.002=4 Therefore the required probabilities are calculated as follows.‟ 1) The probabilities that none catches fire is given by P(x=0)=
- 12. 2)the proababilities that at least one catches fire is given by P(x>=1)=1-(x=0)=1-0.01832=0.98168