Is the Fed blowing bubbles to cover up growing inequality.... again?
1. Macro Commodities Forex Rates Equity Credit Derivatives
Please see important disclaimer and disclosures at the end of the document
27 September 2013
Global Strategy
Alternative view
www.sgresearch.com
Global Strategy Weekly
Is the Fed blowing bubbles to cover up growing inequality…again?
Albert Edwards
(44) 20 7762 5890
albert.edwards@sgcib.com
Global asset allocation
% Index
Index
neutral
SG
Weight
Equities 30-80 60 30
Bonds 20-50 35 50
Cash 0-30 5 20
Source: SG Cross Asset Research
Global Strategy Team
Albert Edwards
(44) 20 7762 5890
albert.edwards@sgcib.com
They’re at it again! US inequality is surging and the Fed has created another house price
boom. Does this matter? Well I think so. But who cares what I think. Warren Buffet, Bill Gross
and Stanley Druckenmiller think it matters. Clients marvel at how the US profits’ share of GDP
remains so high and that labour remains so weak. Marc Faber said recently that in postponing
the QE taper, we have merely climbed to a higher diving board. I go further. I see growing
inequality draining the swimming pool dry. The crunch, when it comes, will be ugly.
We know Quantitative Easing has mainly helped the rich. The Bank of England admitted
as much a year ago. Specifically it said that its QE programme had boosted the value of
stocks and bonds by 25%, or about $970 billion. It then calculated that about 40 percent of
those gains went to the richest 5 percent of British households – link.
Profits and capital have benefited from QE at the expense of labour. Dividends and share
buybacks have benefited at the expense of wages. Andrew Lapthorne describes a
mechanism where QE washes through the system and ends up enriching management via
share buybacks. Unsurprisingly, inequality has continued to grow - link.
I was starting to update some charts on the US house price boom. The Case-Shiller 20
Cities Index rose a frothy 12½% in the year to July, led by fizzing San Francisco prices
which rose 25% yoy. Then I remembered I had meant to highlight to readers the updated
measures of US inequality which have reached new grotesque heights (see chart below).
The correlation between another US house price surge and still soaring inequality took me
back to thinking about my original note on the topic “Theft! Were the US & UK central banks
complicit in robbing the middle classes?”- link. I wanted to update my thoughts.
Does this level of extreme inequality matter and, if so, can anything be done? Yes and
yes. I believe the 99% who have missed out on the fruits of recovery will demand change
and will not be bought off with another housing bubble designed, as before, to divert their
attention from the continued appropriation of the fruits of their labour by the 1%. I expect
that ultimately, US capital gains (and dividend) tax rates will be brought into line with income
tax. And the 99% will hail former UK Chancellor, Nigel Lawson, for the visionary he was.
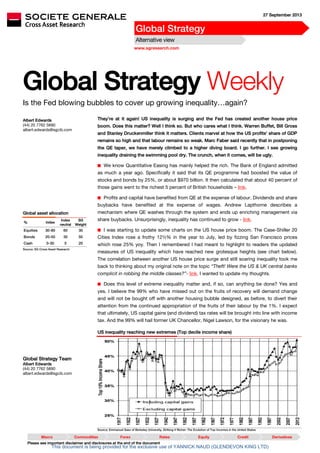
US inequality reaching new extremes (Top decile income share)
Source: Emmanuel Saez of Berkeley University, Striking it Richer: The Evolution of Top Incomes in the United States
This document is being provided for the exclusive use of YANNICK NAUD (GLENDEVON KING LTD)
2. Global Strategy Weekly
27 September 20132
When I saw the latest US Case-Shiller data showing house prices surging at a double-digit
national pace, I recalled one of the key reasons we had previously identified for why the US
Fed may have been so keen to get a house price bubble inflating.
US S&P Case-Shiller house prices (Level, seasonally adj, Jan 2000=100)
Source: Datastream
We noted back in early 2010 that the Fed was in some economic sense ‘required’ to offset the
impact of rising inequality on the economy by generating a house price boom.
We wrote: “Our US economists make the very interesting point that peaks of income
skewness – 1929 and 2007 – tell us there is something fundamentally unsustainable about
excessively uneven income distribution. With a relatively low marginal propensity to consume
among the rich, when they receive the vast bulk of income growth, as they have, then the
country will face an under-consumption problem. (Marc Faber also cites John Hobson’s work
on this same topic from the 1930s).”
Hence, while governments preside over economic policies that make the very rich even
richer, national consumption needs to be boosted in some way to avoid under-
consumption ending in outright deflation. In addition, the middle classes also need to be
thrown a sop to disguise the fact they are not benefiting at all from economic growth. This is
where central banks have played their pernicious part.
I recall seeing an article from John Plender on this topic back in April 2008. His explanation for
why there had been so little backlash from the stagnation of ordinary people’s income at a
time when the rich did so well was simple: “Rising asset prices, especially in the housing
market, created a sense of increasing wealth regardless of income. Remortgaging homes over
a long period of declining interest rates provided a convenient source of funds via equity
withdrawal to finance increased consumption” – link.
Now some argue that central banks had no choice in the face of under-consumption, while
conspiracy theorists might even conclude there has been some sort of unspoken collusion
among policymakers to ‘rob’ the middle classes of their rightful share of income growth by
throwing them illusionary spending power based on asset price inflation. We will never know.
But now it all makes more sense!
Let’s look at what has happened since the Great Recession in more detail. Emmanuel Saez of
Berkeley University has just updated his analysis and we show his key chart of how the top
income tiers have done (see front cover chart). “Based on IRS data, incomes of the top 1%
grew by 31.4% while bottom 99% incomes grew only by 0.4% from 2009 to 2012. Hence,
the top 1% captured 95% of the income gains in the first three years of the recovery.
97 98 99 00 01 02 03 04 05 06 07 08 09 10 11 12 13
60
80
100
120
140
160
180
200
220
240
60
80
100
120
140
160
180
200
220
240
NY
20 cities
San Francisco
This document is being provided for the exclusive use of YANNICK NAUD (GLENDEVON KING LTD)
3. Global Strategy Weekly
27 September 2013 3
Overall, these results suggest that the Great Recession only depressed top income shares
temporarily and will not undo any of the dramatic increase in top income shares seen since
the 1970s. Indeed, the top decile income share in 2012 is equal to 50.4%, the highest
since 1917 when the series start (see front cover chart). Saez considers some of the surge,
including capital gains, may be due to retiming of income due to impending 2013 tax changes,
but he thinks that tax re-timing is unlikely to explain the surge in income inequality once
capital gains are excluded – see link).
Saez looks ahead and concludes; “based on the US historical record, falls in income
concentration due to economic downturns are temporary unless drastic regulation and tax
policy changes are implemented and prevent income concentration from bouncing back. Such
policy changes took place after the Great Depression during the New Deal and permanently
reduced income concentration until the 1970s. In contrast, recent downturns, such as the
2001 and 2008 recession, led to only very temporary drops in income concentration." So, what
does this mean?
In an excellent article entitled Income Inequality Sheds Its Taboo Status, Chrystia Freeland of
Reuters notes that while it has long been almost taboo to talk about inequality in the US, there
have been some high quality discussions recently. In the article she discusses a recent
Brookings panel she attended, discussing income inequality, including the research collected
in a new book published by Brookings titled “Inequality in America.” - link.
The panel “offered three important takeaways about the causes and consequences of rising
income inequality. One was that government matters. Like most students of the subject, the
assembled economists agreed that rising inequality was driven partly by economic forces like
the technology revolution and globalization."
But the state can choose to mute the impact of the invisible hand. Paradoxically, in much of
the Western world, and particularly in the United States, even as the power of these economic
shifts has become more profound, government efforts to mitigate them have become weaker.
As Mr. Buffett pointed out, the effective tax rate paid by the 400 top earners in 1992 was 26.4
percent. By 2009, it had fallen to 19.9 percent — even as the pretax gap between the
plutocrats and everyone else had widened. (I will return to the theme of taxation policy later.)
A second theme of the Brookings discussion helps to explain why the top earners’ tax rate
has fallen — effectively the economy has gone global, but nation-states have not. Higher
taxes on the rich may be a logical response to rising income inequality, but actually levying
those taxes is getting harder in an age of global capital flows. Mr. Buffett said it was
“sickening” that rich people and companies use the Cayman Islands to lower their tax bills,
but moral outrage is a weak weapon against international tax arbitrage.
If you are still not convinced that all this matters, consider the third, and most striking,
possibility raised at the Brookings panel. Set aside any moral or political concerns you may
have about rising income inequality — worries about poverty, justice, undue political influence
or even social mobility. According to Mr. Dervis, co-author of the book, the research collected
in “Inequality in America,” shows that a growing number of economists suspect that once
inequality passes a certain point it may jeopardize economic stability and economic
growth. As the book argues, “rebalancing of the distribution of income may play a role in
unlocking the U.S. economy’s growth potential in a sustainable way.”
That is exactly the point Warren Buffet, Bill Gross and Stanley Druckenmiller make. You don’t
have to be a communist to conclude that high levels of inequality not only adversely
affects long-term growth, but also increases the economy’s vulnerability to recession.
This document is being provided for the exclusive use of YANNICK NAUD (GLENDEVON KING LTD)
4. Global Strategy Weekly
27 September 20134
Joseph Stiglitz makes the most simple point in a NY Times op-ed “Our skyrocketing inequality
— so contrary to our meritocratic ideal of America as a place where anyone with hard work
and talent can make it — means that those who are born to parents of limited means are
likely never to live up to their potential. Children in other rich countries like Canada, France,
Germany and Sweden have a better chance of doing better than their parents did than
American kids have.” He is right. There is growing body of evidence that the largest
determinant of your income is increasingly your starting point.
When I was studying economics I think this was part of the lecture on the Edgeworth box:
how well you do depends on your initial endowments and how far you move along the
contract curve. Or to put it another way, it is economically inefficient for Tim (nice but-dim)’s
parents to buy education at his private school while the highly intelligent Tracy sinks like a
stone at a local sink school (no disrespect to any Tim’s or Tracy’s out there). It’s not about
equality of outcomes, it’s about equality of opportunity. I think all of us, especially
economists, can identify with that…until it comes to our own children, that is.
On that topic it is shocking that the reading scores for the US high school graduation class of
2012 reveal a four-decade low, The Washington Post reports one explanation may be a sharp
increase in students of low-income backgrounds: “There are many factors that can affect how
well a student rates on the SAT scores, but few correlate as strongly as family income” –link.
Average SAT reading/verbal scores for US High School Graduates hits a 40 year low
Source: Zero Hedge
So let’s quickly run through some of the excellent charts that we should keep in mind given
the disturbing news that inequality in the US is still surging (front cover chart). I will then give
my view on one way this might play out. Now we all know that income inequality in the US is
among the worst in the OECD and the most unequal in the developed world (see chart below).
Source: OECD, (S90/S10 is top deciles income share relative to the bottom decile)
This document is being provided for the exclusive use of YANNICK NAUD (GLENDEVON KING LTD)
5. Global Strategy Weekly
27 September 2013 5
But much more controversial is measuring the impact, if any, of high levels of US inequality on
economic and social outcomes. A paper published earlier this year by the World Bank entitled
“Inequality of Opportunity, Income Inequality and Economic Mobility: Some International
Comparisons” goes to the heart of these matters and tries to strip away much of the party
political dogma associated with each side of this controversial debate.
One key subject the authors tackle is whether there is any observable relationship between
inequality of opportunity and income inequality. It all gets a bit technical as these things do,
but they say that “it is not obvious that there should be any mechanical reason to expect a
correlation between income inequality levels and the relative extent of inequality of opportunity
(IOR). (Yet) the figure below shows the clear association (I’ve circled the US in red as it gets a
bit lost underneath Spain – ‘ESP’).
Inequality of opportunity and income inequality
Source: World Bank, Inequality of Opportunity, Income Inequality and Economic Mobility: Some International Comparisons
Having established an international link between income inequality and inequality of
opportunity (IOR), they then go on to draw a further association with intergenerational mobility.
The authors show that their measure of inequality of opportunity (IOR) is strongly positively
correlated with two different measures of intergenerational persistence (the converse of
mobility): the intergenerational elasticity of income, and shown below, the correlation
coefficient of parental and child schooling attainment.
Inequality of opportunity and intergenerational mobility – i.e. the American dream
Source: World Bank, Inequality of Opportunity, Income Inequality and Economic Mobility: Some International Comparisons
This document is being provided for the exclusive use of YANNICK NAUD (GLENDEVON KING LTD)
6. Global Strategy Weekly
27 September 20136
The authors conclude that “inequality of opportunity (IOR) is the missing link between the
concepts of income inequality and social mobility: if higher inequality makes
intergenerational mobility more difficult, it is likely because opportunities for economic
advancement are more unequally distributed among children. Conversely, the way lower
mobility may contribute to the persistence of income inequality is through making opportunity
sets very different among the children of the rich and the children of the poor.”
To me that is all complicated academic speak for explaining why Tim (nice but dim) does so
well in terms of eventual earnings power compare to Tracy. But I am doing this excellent piece
of research an injustice and invite you to peruse it yourselves at your leisure - link.
Let’s now quickly view some other charts on inequality and social outcomes I found pretty
compelling. The first thing that surprised me was to find income inequality was more extreme
in Singapore than in the US (see left-hand chart below). But certainly Singapore’s income
distribution does not seem to be affecting key social measures such as infant mortality,
whereas it clearly does in the US and elsewhere (see chart below).
I was surprised to see Singapore topped OECD inequality… ..and also surprised that the US infant mortality was so bad
Source: The Equality Trust, citing U.N. Development Program Human Development Indicators, 2003-6.and OECD data
Even more compelling is when we put these two variables on one chart (see below).
Spurious correlation? Ignoring Singapore (!) it does seem pretty compelling
Source: The Institute of Policy Studies and The Equality Trust
This document is being provided for the exclusive use of YANNICK NAUD (GLENDEVON KING LTD)
7. Global Strategy Weekly
27 September 2013 7
The Institute of Policy Studies in their excellent paper (link) push this correlation between
income inequality and social wellbeing even further by building a composite measure of Health
and Social Problems comprising:
Life expectancy
Maths proficiency and literacy
Infant mortality
Homicides
Imprisonment
Teenage births
Trust
Obesity
Mental illness, including drug and alcohol addiction
Social mobility
And then we get the chart below which is even more compelling (although Singapore has now
disappeared). The US is clearly in a world of its own!
Spurious correlation? I don’t think so personally. But what about causality?
Source: The Institute of Policy Studies and The Equality Trust
The Institute of Policy Studies go on to cite some work done here in the UK “A 2009 study in
the British Medical Journal attempted to quantify the number of deaths that could be
attributed to economic inequality among the 30 rich countries that make up the OECD - link.
The researchers found an association between greater inequality and a higher overall death
rate in countries where inequality runs “relatively high”.
What constitutes “relatively high” inequality? To answer this question, the researchers ranked
the 30 OECD countries in order of their ‘Gini index’, a standard metric that economists use to
describe the level of inequality in a population. The United States ranks as the fourth-most
unequal country, with a Gini of 0.357. The median Gini among OECD nations, 0.3, became the
reference point against which researchers compared countries and their death rates.
The British Medical Council study concluded that almost 884,000 excess deaths per year
in the United States could be attributed to the high level of income inequality. In other
words, if the Gini in the United States were 0.3 instead of 0.357, we would see nearly
884,000 fewer deaths per year.
Wow! But what can be done quickly NOW to help arrest this trend towards ever increasing
inequality and social and economic problems in the US? Nigel Lawson is our man.
This document is being provided for the exclusive use of YANNICK NAUD (GLENDEVON KING LTD)
8. Global Strategy Weekly
27 September 20138
Now being a bear of very little brain I thought I needed to remind myself how things worked in
the US tax system for income, dividends and capital gains - investopedia.com.
The situation for dividends before 2013 was this: “The U.S. tax code gives similar treatment to
dividends and capital gains. Ordinary dividends and short-term capital gains are subject to the
same rate as one's income tax rate.” But this higher rate is easily avoided.
‘Qualified’ dividends and long-term capital gains benefit from a lower rate. Qualified dividends
are those paid by domestic or qualifying foreign companies that have been held for at least 61
days out of 121 days. “Long-term” for US capital gains tax purposes is over a year. Neither of
these seem a particular long holding period to me to qualify for favourable tax relief!
Prior to this year, with qualified dividends and long-term capital gains, individuals in the 25%
or higher tax bracket paid a 15% tax, whereas those in lower brackets were exempt from any
tax (i.e. way lower than income tax).
What an incredible distortion to the US tax system! No wonder it has been so easy for the 1%
to get richer and richer in the US. While some might explain higher inequality as the inevitable
consequence of technological innovation and globalisation, for me distortions in the tax
system are key to explaining the extreme levels of income inequality in the US.
Now in the murky parts of my brain I seemed to remember that 2013 was going to see a major
reform of the US dividend tax system. Indeed, upon double-checking it had indeed been
planned that from the beginning of this year the preferential treatment given to qualified
dividends was set to disappear completely. It HAD been planned that as of this year
individuals would have to pay the appropriate rate of income tax rate on all dividend income
they receive. That would have been an important victory for the 99% and an important step, in
my humble view, in arresting the inexorable upward march of inequality in the US.
Unfortunately as the tables below show, the Administration had to back down amid howls of
anguish from congress and the 1%. Qualified dividends remain aligned to far lower Capital
Gains tax rates and the only step forward to convergence with income tax was to introduce a
higher 20% rate of capital gains (and qualified dividend tax) for those in the 39.6% income tax
bracket (which, for a single person kicks in at taxable income over a lively $400,000).
Capital Gains tax rates in the US Dividend taxation rate in the US
Source: I’m lazy and copied these out of Wikipedia
Instead of backing off, things should have gone even further in my opinion to arrest the
upward march of US inequality. In my opinion one of the greatest tax distortions and biggest
incentives for tax avoidance would be eliminated by completely aligning all taxes on capital
gains and dividend income with income tax.
This document is being provided for the exclusive use of YANNICK NAUD (GLENDEVON KING LTD)
9. Global Strategy Weekly
27 September 2013 9
I can hear the calls from the economic libertarian bloggers to hang, draw and quarter me
(incidentally I used to drink at a pub of the same name just next to the Tower of London so I
am fully acquainted with the practice). But before I am strung up as a heretic, consider the
words of one of the most tax-reforming, right-wing UK Chancellors of the Exchequer of the
20th century.
Nigel Lawson said in 1988: “In principle there is little economic difference between
income and capital gains, and many people effectively have the option of choosing, to a
significant extent, which they receive. Insofar as there is a difference, it is by no means
clear why one should be taxed more heavily than the other.”
And separately "I have long felt it is highly undesirable that Capital Gains Tax should
have given rise to a substantial tax avoidance industry dedicated solely to converting
income into capital gain, which is taxed very much more lightly."
It was Lawson who in 1988 brought capital gains taxation into line with income taxes to stamp
out any incentives for the rich to even bother trying to use this time-honoured method for to
avoid income tax. And he did what no Labour government had done before him.
We are talking about Nigel Lawson, the former UK Chancellor’s of the Exchequer in Margaret
Thatcher’s extremely ‘conservative’ Conservative administration. Nigel Lawson was no lily-
livered leftie liberal. He was so far right he makes Ron Paul look like a pinko-socialist – ok,
maybe not quite that far right. Yet despite his right wing, free market credentials Nigel Lawson
should be THE pin-up poster boy for the 99% movement.
Unfortunately Lawson’s far-sighted tax reforms were undermined by the subsequent Labour
government with disastrous consequences. In an interview with the BBC in 2010 Nigel
Lawson blamed former Prime Minister Gordon Brown’s cutting of Capital Gains Tax in 1997
for the subsequent boom in buy-to-let housing bubble that proved a major factor in the boom
and bust of the UK economy in the Great Recession – link.
But let us return to the problems in the US here and now. What society needs to grow in an
economically optimal fashion is not equality of outcomes, but equality of opportunity. But with
the grotesque distortions of income now prevailing, one’s lifetime opportunities are so
increasingly dominated by what one’s parents income is that the American dream has
increasingly become just that –a dream, and an increasingly distant one at that. We do not feel
we are alone in our call. Notable investors such as Bill Gross, Warren Buffet and more recently
Stanley Druckenmiller have voiced similar concern about the current grotesque levels of
inequality in the US.
Many investors I meet continue to marvel at US labour’s inability to rebuild its wage share of
GDP and how dominant capital and profits have become. I believe society will ultimately
demand and implement a change. We have already seen a potent grass-roots backlash
against cross-border tax arbitrage and tax-havens, which has forced the politicians to react
here in the UK. Yet inequality in the US continues to grow.
Investors should make no mistake. The anger of the 99% will ultimately not be bought off
by yet another central bank inspired housing bubble, engineered to pacify them and
divert their attention as their real incomes fall and inequality continues to grow.
The current bubble will burst, despite the Fed postponing the event by climbing to ever higher
diving boards. All the time rising inequality is draining the swimming pool dry and the crunch
when it comes will be ugly. Then the long overdue reforms in the tax system discussed above
could be forced by a raging public onto the 1% despite their brays of indignation. And when
dividends and capital gains tax rates are properly aligned with income tax and inequality
begins to decline, let the 99% hold former UK Chancellor Nigel Lawson aloft on their
shoulders and fete him for being well ahead of his time.
This document is being provided for the exclusive use of YANNICK NAUD (GLENDEVON KING LTD)
10. Global Strategy Weekly
27 September 201310
APPENDIX
IMPORTANT DISCLAIMER: The information herein is not intended to be an offer to buy or sell, or a solicitation of an offer to buy or sell, any
securities and has been obtained from, or is based upon, sources believed to be reliable but is not guaranteed as to accuracy or
completeness. Material contained in this report satisfies the regulatory provisions concerning independent investment research as defined in
MiFID. SG does, from time to time, deal, trade in, profit from, hold, act as market-makers or advisers, brokers or bankers in relation to the
securities, or derivatives thereof, of persons, firms or entities mentioned in this document and may be represented on the board of such
persons, firms or entities. SG does, from time to time, act as a principal trader in equities or debt securities that may be referred to in this
report and may hold equity or debt securities positions. Employees of SG, or individuals connected to them, may from time to time have a
position in or hold any of the investments or related investments mentioned in this document. SG is under no obligation to disclose or take
account of this document when advising or dealing with or on behalf of customers. The views of SG reflected in this document may change
without notice. In addition, SG may issue other reports that are inconsistent with, and reach different conclusions from, the information
presented in this report and is under no obligation to ensure that such other reports are brought to the attention of any recipient of this report.
To the maximum extent possible at law, SG does not accept any liability whatsoever arising from the use of the material or information
contained herein. This research document is not intended for use by or targeted to retail customers. Should a retail customer obtain a copy of
this report he/she should not base his/her investment decisions solely on the basis of this document and must seek independent financial
advice.
The financial instrument discussed in this report may not be suitable for all investors and investors must make their own informed decisions
and seek their own advice regarding the appropriateness of investing in financial instruments or implementing strategies discussed herein.
The value of securities and financial instruments is subject to currency exchange rate fluctuation that may have a positive or negative effect on
the price of such securities or financial instruments, and investors in securities such as ADRs effectively assume this risk. SG does not provide
any tax advice. Past performance is not necessarily a guide to future performance. Estimates of future performance are based on
assumptions that may not be realized. Investments in general, and derivatives in particular, involve numerous risks, including, among others,
market, counterparty default and liquidity risk. Trading in options involves additional risks and is not suitable for all investors. An option may
become worthless by its expiration date, as it is a depreciating asset. Option ownership could result in significant loss or gain, especially for
options of unhedged positions. Prior to buying or selling an option, investors must review the "Characteristics and Risks of Standardized
Options" at http://www.optionsclearing.com/publications/risks/riskchap.1.jsp.
Notice to French Investors: This publication is issued in France by or through Société Générale ("SG") which is authorised and supervised
by the Autorité de Contrôle Prudentiel and regulated by the Autorite des Marches Financiers.
Notice to U.K. Investors: This publication is issued in the United Kingdom by or through Société Générale ("SG"), London Branch . Société
Générale is a French credit institution (bank) authorised and supervised by the Autorité de Contrôle Prudentiel (the French Prudential Control
Authority). Société Générale is subject to limited regulation by the Financial Services Authority (“FSA”) in the U.K. Details of the extent of SG's
regulation by the FSA are available from SG on request. The information and any advice contained herein is directed only at, and made
available only to, professional clients and eligible counterparties (as defined in the FSA rules) and should not be relied upon by any other
person or party.
Notice to Polish Investors: this document has been issued in Poland by Societe Generale S.A. Oddzial w Polsce (“the Branch”) with its
registered office in Warsaw (Poland) at 111 Marszałkowska St. The Branch is supervised by the Polish Financial Supervision Authority and the
French ”Autorité de Contrôle Prudentiel”. This report is addressed to financial institutions only, as defined in the Act on trading in financial
instruments. The Branch certifies that this document has been elaborated with due dilligence and care.
Notice to U.S. Investors: For purposes of SEC Rule 15a-6, SG Americas Securities LLC (“SGAS”) takes responsibility for this research report.
This report is intended for institutional investors only. Any U.S. person wishing to discuss this report or effect transactions in any security
discussed herein should do so with or through SGAS, a broker-dealer registered with the SEC and a member of FINRA, with its registered
address at 1221 Avenue of the Americas, New York, NY 10020. (212)-278-6000.
Notice to Canadian Investors: This document is for information purposes only and is intended for use by Permitted Clients, as defined under
National Instrument 31-103, Accredited Investors, as defined under National Instrument 45-106, Accredited Counterparties as defined under
the Derivatives Act (Québec) and "Qualified Parties" as defined under the ASC, BCSC, SFSC and NBSC Orders
Notice to Singapore Investors: This document is provided in Singapore by or through Société Générale ("SG"), Singapore Branch and is
provided only to accredited investors, expert investors and institutional investors, as defined in Section 4A of the Securities and Futures Act,
Cap. 289. Recipients of this document are to contact Société Générale, Singapore Branch in respect of any matters arising from, or in
connection with, the document. If you are an accredited investor or expert investor, please be informed that in SG's dealings with you, SG is
relying on the following exemptions to the Financial Advisers Act, Cap. 110 (“FAA”): (1) the exemption in Regulation 33 of the Financial
Advisers Regulations (“FAR”), which exempts SG from complying with Section 25 of the FAA on disclosure of product information to clients;
(2) the exemption set out in Regulation 34 of the FAR, which exempts SG from complying with Section 27 of the FAA on recommendations;
and (3) the exemption set out in Regulation 35 of the FAR, which exempts SG from complying with Section 36 of the FAA on disclosure of
certain interests in securities.
Notice to Hong Kong Investors: This report is distributed in Hong Kong by Société Générale, Hong Kong Branch which is licensed by the
Securities and Futures Commission of Hong Kong under the Securities and Futures Ordinance (Chapter 571 of the Laws of Hong Kong)
("SFO"). This document does not constitute a solicitation or an offer of securities or an invitation to the public within the meaning of the SFO.
This report is to be circulated only to "professional investors" as defined in the SFO.
Notice to Japanese Investors: This publication is distributed in Japan by Societe Generale Securities (North Pacific) Ltd., Tokyo Branch,
which is regulated by the Financial Services Agency of Japan. This document is intended only for the Specified Investors, as defined by the
Financial Instruments and Exchange Law in Japan and only for those people to whom it is sent directly by Societe Generale Securities (North
Pacific) Ltd., Tokyo Branch, and under no circumstances should it be forwarded to any third party. The products mentioned in this report may
not be eligible for sale in Japan and they may not be suitable for all types of investors.
Notice to Australian Investors: Societe Generale is exempt from the requirement to hold an Australian financial services licence (AFSL) under
the Corporations Act 2001 (Cth) in respect of financial services, in reliance on ASIC Class Order 03/8240, a copy of which may be obtained at
the web site of the Australian Securities and Investments Commission, http://www.asic.gov.au. The class order exempts financial services
providers with a limited connection to Australia from the requirement to hold an AFSL where they provide financial services only to wholesale
clients in Australia on certain conditions. Financial services provided by Societe Generale may be regulated under foreign laws and regulatory
requirements, which are different from the laws applying in Australia.
http://www.sgcib.com. Copyright: The Société Générale Group 2013. All rights reserved.
This publication may not be reproduced or redistributed in whole in part without the prior consent of SG or its affiliates.
This document is being provided for the exclusive use of YANNICK NAUD (GLENDEVON KING LTD)