08448380779 Call Girls In Friends Colony Women Seeking Men
3311
1. August 29, 2011
ACTION
Buy
Silitech Technology (3311.TW)
Return Potential: 28% Equity Research
Solid 2nd growth driver to offset keypad concerns; upgrade to Buy
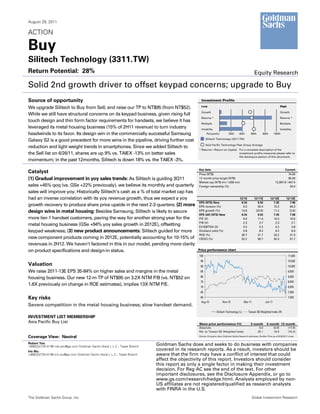
Source of opportunity Investment Profile
Low High
We upgrade Silitech to Buy from Sell, and raise our TP to NT$95 (from NT$52).
Growth Growth
While we still have structural concerns on its keypad business, given rising full
Returns * Returns *
touch design and thin form factor requirements for handsets, we believe it has
Multiple Multiple
leveraged its metal housing business (15% of 2H11 revenue) to turn industry Volatility Volatility
headwinds to its favor. Its design win in the commercially successful Samsung Percentile 20th 40th 60th 80th 100th
Silitech Technology (3311.TW)
Galaxy S2 is a good precedent for more wins in the pipeline, driving further cost
Asia Pacific Technology Peer Group Average
reduction and light weight trends in smartphones. Since we added Silitech to
* Returns = Return on Capital For a complete description of the
the Sell list on 6/26/11, shares are up 9% vs. TAIEX -13% on better sales investment profile measures please refer to
the disclosure section of this document.
momentum; in the past 12months, Silitech is down 18% vs. the TAIEX -3%.
Key data Current
Catalyst Price (NT$) 74.00
(1) Gradual improvement in yoy sales trends: As Silitech is guiding 3Q11 12 month price target (NT$) 95.00
Market cap (NT$ mn / US$ mn) 12,997.8 / 447.5
sales +45% qoq (vs. GSe +22% previously), we believe its monthly and quarterly Foreign ownership (%) 20.4
sales will improve yoy. Historically Silitech’s cash as a % of total market cap has
had an inverse correlation with its yoy revenue growth, thus we expect a yoy 12/10 12/11E 12/12E 12/13E
EPS (NT$) New 8.24 6.52 7.25 7.06
growth recovery to produce share price upside in the next 2-3 quarters; (2) more EPS revision (%) 0.0 35.4 72.2 84.3
design wins in metal housing: Besides Samsung, Silitech is likely to secure EPS growth (%) 14.6 (20.9) 11.2 (2.6)
EPS (dil) (NT$) New 8.24 6.52 7.25 7.06
more tier-1 handset customers, paving the way for another strong year for the P/E (X) 9.0 11.4 10.2 10.5
P/B (X) 2.3 2.7 2.3 2.1
metal housing business (GSe +94% yoy sales growth in 2012E), offsetting EV/EBITDA (X) 5.5 5.2 4.2 3.8
keypad weakness; (3) new product announcements: Silitech guided for more Dividend yield (%) 5.8 8.2 6.2 6.9
ROE (%) 26.7 21.7 24.2 21.0
new component products coming in 2012E, potentially accounting for 10-15% of CROCI (%) 52.2 56.7 55.3 51.7
revenues in 2H12. We haven’t factored in this in our model, pending more clarity
on product specifications and design-in status. Price performance chart
100 11,000
95 10,500
Valuation 90 10,000
We raise 2011-13E EPS 35-84% on higher sales and margins in the metal 85 9,500
housing business. Our new 12-m TP of NT$95 on 3.2X NTM P/B (vs. NT$52 on 80 9,000
75 8,500
1.6X previously on change in ROE estimates), implies 13X NTM P/E. 70 8,000
65 7,500
Key risks 60 7,000
Aug-10 Nov-10 Mar-11 Jun-11
Severe competition in the metal housing business; slow handset demand.
Silitech Technology (L) Taiwan SE Weighted Index (R)
INVESTMENT LIST MEMBERSHIP
Asia Pacific Buy List Share price performance (%) 3 month 6 month 12 month
Absolute 6.0 (0.9) (17.9)
Rel. to Taiwan SE Weighted Index 25.1 14.5 (15.2)
Coverage View: Neutral Source: Company data, Goldman Sachs Research estimates, FactSet. Price as of 8/26/2011 close.
Robert Yen Goldman Sachs does and seeks to do business with companies
+886(2)2730-4196 rob.yen@gs.com Goldman Sachs (Asia) L.L.C., Taipei Branch
Iris Wu
covered in its research reports. As a result, investors should be
+886(2)2730-4186 iris.wu@gs.com Goldman Sachs (Asia) L.L.C., Taipei Branch aware that the firm may have a conflict of interest that could
affect the objectivity of this report. Investors should consider
this report as only a single factor in making their investment
decision. For Reg AC see the end of the text. For other
important disclosures, see the Disclosure Appendix, or go to
www.gs.com/research/hedge.html. Analysts employed by non-
US affiliates are not registered/qualified as research analysts
with FINRA in the U.S.
The Goldman Sachs Group, Inc. Global Investment Research
3. August 29, 2011 Silitech Technology (3311.TW)
Metal housing – potentially changing the industry landscape
The commercial success of the Galaxy S2 smartphone may have
profound implications for the casing industry
Samsung’s fast selling Galaxy S2 smartphone (3 mn units sold in 55 days,
according to Samsung) has been widely regarded as a strong commercial
success. Based on Samsung’s promotion materials, the company is emphasizing
its vivid display and thin-and-light form factor as the main selling points.
Contrary to the growing industry trend of unibody metal casings, Samsung
actually used a plastic casing for its flagship smartphone, but adopted an inner
magnesium-alloy metal housing to improve the solidness and durability of this
phone.
While the unibody metal casing undoubtedly provides consumers with a sense
that the phones have the appearance of a high-quality product that feels solid in
their hands, the strong sales of Galaxy S2 seem to suggest that consumers also
want their smartphones to be super-thin and light weight, in addition to
providing a positive software user experience (Exhibit 1).
Exhibit 1: The slim form factor and lighter weight could also be one of the decision-
making factors in consumers’ purchase of smartphones
HTC Sensation Samsung Galaxy S II
Retail price £402.5 £471.9
Weight 148g 116g
Thickness 11.3mm 8.5mm
Potential shipment in 2011E 4-5 mn units 24-26 mn units
Casing/inner parts cost US$10-15 US$5-10
Casing/inner parts supplier Catcher Silitech
Supplier's GM 40-45% 20-25%
*Retail price - Amazon UK, as of Aug 26
Source: Company data, Goldman Sachs Research estimates.
As smartphones get more complicated in terms of hardware and mechanical
design, embedding more components and functionalities, it’s very critical for
OEMs to look for ways to drive costs down, and simultaneously deliver light
weight and thin form factors, without significant sacrifice of solid build quality.
Thus, the mg-alloy metal housing seems to be emerging as a strong alternative
solution to outer metal casing design. This is the reason Silitech management is
very confident in gaining further design wins from more tier-1 customers in the
pipeline.
Putting the metal housing business in perspective – the major
source of upside
We previously underestimated Silitech’s efforts to ramp up its metal housing
business. We focused too much on its keypad business which is under severe
structural replacement pressure from full touch-screen designs and performance
improvements in virtual keypads.
Goldman Sachs Global Investment Research 3
4. August 29, 2011 Silitech Technology (3311.TW)
We still expect Silitech’s keypad business to trend down yoy in 2011E-2013E, but
we believe its mg-alloy metal housing business is strong enough to provide a 2nd
growth driver for the company. We now expect metal housing sales to account
for 22% of total revenues in 2012E and 29% in 2013E, up from 13% in 2011E
(Exhibit 2).
While we believe it will still be difficult for Silitech to achieve strong earnings
growth in 2012E due to weakness in the core keypad business, we believe its
current valuation has not captured the potential earnings power from the metal
housing business in the next 1-2 years. The inverse correlation between Silitech’s
cash as a % of total mkt cap and its yoy revenue growth suggests there could be
more upside in the share price in the next 2-3 quarters, in our view (Exhibit 3).
Exhibit 2: We believe the significant ramp up of Silitech’s Exhibit 3: Cash as a % of market cap could start to trend
metal housing business could help offset weakness in its down, implying share price upside, in our view
core keypad business Silitech’s cash as % of market cap vs. quarterly sales yoy
Silitech’s revenues breakdown by product
Silitech estimated product mix Silitech's cash as % of market cap Silitech's quarterly sales yoy
60%
Light metal casing/inner parts Office appliance parts
Automotive parts Handset keypads
50%
100% 1% 3%
3% 2%
6% 13%
90% 7% 22% 40%
2% 29%
80% 7%
2% 30%
7%
70% 1%
8%
20%
60%
50% 10%
89% 87%
40% 79%
69% 0%
30% 61%
2007/03
2007/05
2007/07
2007/09
2008/03
2008/05
2008/07
2008/09
2009/03
2009/05
2009/07
2009/09
2010/01
2012/03
2012/05
2012/07
2012/09
2007/01
2008/01
2009/01
2012/01
2007/11
2008/11
2009/11
2010/03
2010/05
2010/07
2010/09
2011/03
2011/05
2011/07
2011/09
2012/11
2010/11
2011/01
2011/11
20% -10%
10%
-20%
0%
2009 2010 2011E 2012E 2013E -30%
Source: Company data, Goldman Sachs Research estimates. Source: Company data, Datastream, Goldman Sachs Research estimates.
The addition of such a strong second growth driver suggests to us that the worst
is over for Silitech’s share price (as long as the global consumer demand outlook
doesn’t worsen from here). Thus, we are raising 2011/12/13E EPS by
35%/72%/84% mainly to reflect higher sales and GM assumptions for Silitech’s
metal housing business.
Silitech is currently trading at 2.3X NTM P/B on 22-24% ROE. Valuation looks
undemanding vs. the historical average P/B of 3.5X on 30% ROE. We expect the
gradual yoy recovery of sales momentum to act as a share price driver.
Our new 12-m TP of NT$95 is based on 3.2X NTM P/B derived from Silitech’s
historical PB-ROE valuation matrix (previously NT$52, 1.6X on change of our ROE
estimates), implying c.13X NTM P/E.
Goldman Sachs Global Investment Research 4
6. August 29, 2011 Silitech Technology (3311.TW)
Exhibit 7: Silitech’s quarterly financials (NT$mn; consolidated)
Summary P&L (GAAP) 1Q2011 2Q2011 3Q2011E 4Q2011E 1Q2012E 2Q2012E 3Q2012E 4Q2012E 2009 2010 2011E 2012E 2013E
Net sales 3,152 2,525 3,652 3,626 3,093 3,602 3,912 3,721 10,821 13,835 12,955 14,328 14,607
Cost of good sold (COGS) (2,512) (2,050) (2,916) (2,847) (2,453) (2,880) (3,097) (2,913) (8,301) (10,740) (10,325) (11,343) (11,603)
Gross profits 640 475 736 779 641 722 815 808 2,520 3,096 2,630 2,986 3,004
Operating expenses (312) (266) (331) (338) (323) (346) (361) (350) (1,062) (1,221) (1,246) (1,380) (1,443)
SG&A (228) (191) (240) (244) (233) (252) (261) (247) (750) (880) (902) (993) (1,051)
R&D (84) (74) (91) (94) (90) (95) (100) (103) (312) (341) (344) (388) (392)
Operating profits 328 209 406 441 318 376 454 458 1,458 1,875 1,384 1,606 1,560
Non-operating income/(loss) 29 51 15 15 14 17 18 18 113 88 109 66 78
Earnings before tax (EBT) 357 260 421 456 332 392 472 476 1,571 1,963 1,493 1,672 1,639
Income tax credit/(expense) (85) (41) (95) (103) (81) (70) (109) (110) (293) (486) (324) (370) (370)
Extraordinary gain/(loss) - - - - - - - - - - - - -
Minority Interests 1 2 1 1 0 1 1 1 (14) (10) 3 2 2
Earnings after tax (EAT) 272 221 326 353 252 323 364 366 1,263 1,468 1,172 1,304 1,270
EPS (NT$) 1.51 1.23 1.81 1.97 1.40 1.79 2.02 2.04 7.19 8.24 6.52 7.25 7.06
EPS (NT$, fully diluted) 1.51 1.23 1.81 1.97 1.40 1.79 2.02 2.04 7.19 8.24 6.52 7.25 7.06
Ratio analysis and assumptions
As % of sales
Gross margin 20.3% 18.8% 20.2% 21.5% 20.7% 20.0% 20.8% 21.7% 23.3% 22.4% 20.3% 20.8% 20.6%
Operating expense ratio -9.9% -10.5% -9.1% -9.3% -10.4% -9.6% -9.2% -9.4% -9.8% -8.8% -9.6% -9.6% -9.9%
Operating margin 10.4% 8.3% 11.1% 12.2% 10.3% 10.4% 11.6% 12.3% 13.5% 13.6% 10.7% 11.2% 10.7%
Pre-tax margin 11.3% 10.3% 11.5% 12.6% 10.7% 10.9% 12.1% 12.8% 14.5% 14.2% 11.5% 11.7% 11.2%
Tax rate (as % of EBT) 23.9% 15.6% 22.6% 22.6% 24.4% 17.9% 23.1% 23.1% 18.7% 24.7% 21.7% 22.1% 22.6%
Net margin 8.6% 8.8% 8.9% 9.7% 8.1% 9.0% 9.3% 9.8% 11.7% 10.6% 9.1% 9.1% 8.7%
QoQ growth (%)
Sales -18.2% -19.9% 44.7% -0.7% -14.7% 16.4% 8.6% -4.9%
Gross profits -19.4% -25.8% 55.1% 5.8% -17.8% 12.7% 12.9% -0.8%
Operating profits -20.8% -36.3% 94.0% 8.8% -27.9% 18.1% 20.9% 0.9%
Non-operating profits 47.2% 78.2% -70.1% -2.7% -5.8% 21.2% 7.0% -2.3%
Pre-tax profits -17.7% -27.1% 61.9% 8.4% -27.2% 18.2% 20.3% 0.8%
Net profits -21.6% -18.7% 47.5% 8.4% -28.8% 28.3% 12.7% 0.8%
EPS (weighted averaged) -22.4% -18.7% 47.5% 8.4% -28.8% 28.3% 12.7% 0.8%
Yoy growth (%)
Sales 10.1% -20.5% -7.5% -5.8% -1.8% 42.7% 7.1% 2.6% 18.8% 27.9% -6.4% 10.6% 1.9%
Gross profits -4.4% -34.3% -19.1% -1.9% 0.1% 52.1% 10.7% 3.8% 20.5% 22.9% -15.1% 13.5% 0.6%
Operating profits -21.7% -54.0% -31.0% 6.5% -3.1% 79.7% 11.9% 3.8% 33.5% 28.6% -26.2% 16.0% -2.8%
Non-operating profits 3500.0% 345.7% -73.3% -23.7% -51.2% -66.8% 18.9% 19.3% -52.6% -21.8% 23.6% -39.2% 17.9%
Pre-tax profits -15.0% -44.2% -34.7% 5.2% -6.9% 51.0% 12.2% 4.3% 18.1% 25.0% -23.9% 12.0% -2.0%
Net profits -5.4% -36.8% -32.5% 1.9% -7.5% 45.9% 11.5% 3.7% 13.0% 16.2% -20.1% 11.2% -2.6%
EPS (weighted averaged) -6.4% -37.4% -33.2% 0.9% -7.5% 45.9% 11.5% 3.7% 10.5% 14.6% -20.9% 11.2% -2.6%
Dividend policies
Cash dividends (NT$ per share) 2.75 4.30 6.06 4.56 5.08
Payout ratio (%) 43.2% 60.6% 74.2% 70.0% 70.0%
Source: Company data, Goldman Sachs Research estimates.
Key risks: Samsung Galaxy S2 patent issue; intensified
competitive landscape
Samsung Galaxy smartphone patent issue
On Aug 23rd the Netherlands court in the Hague issued a preliminary injunction
on Samsung’s three smartphones, Galaxy S, Galaxy S2, and Ace, for infringing
Apple’s patent on photo management.
While our Samsung Electronics analyst Michael Bang believes the impact to
Samsung’s mobile business is limited, given that it’s easy for Samsung to rework
the design in question before the injunction deadline, we believe in the worst
case scenario Silitech could still be negatively impacted by such an injunction,
since Silitech is currently the second source of metal housings for various
Samsung smartphones, including the Galaxy S2.
At this moment Silitech management is not seeing any material impact from this
injunction, and believes the gradual ramp-up of its other metal housing
customers could lower its reliance on Samsung.
Goldman Sachs Global Investment Research 6
7. August 29, 2011 Silitech Technology (3311.TW)
Intensified competitive landscape in metal housing
While Silitech is one of the major players in the emerging mg-alloy metal
housing business, this industry is still not seeing major competitive pressure, as
the tier-1 mg-alloy casing companies (such as Catcher and Foxconn Tech) are
mostly focusing on the outer casing business which represents a much higher
addressable market and entry barrier than inner parts.
However, we can’t rule out the possibility that if the metal casing industry is
facing an oversupply in capacity or a sudden trend shift in casing materials
(which could make Catcher or Foxconn’s current equipment underutilised), the
tier-1 casing companies could be eyeing this inner metal housing market. This
could significantly intensify pricing competition.
Also, there are many inner metal housing companies in the industry, but most of
them are focusing on aluminum housing which is even cheaper than mg-alloy
housing but provides less rigidness of the whole frame. If there is a major
breakthrough in the material technology and manufacturing in mg-alloy housing,
the whole industry could also face severe pricing competition and eroding profit
margins.
Exhibit 8: Share price performance vs. peer group
Closing prices as of Aug 26, 2011
Price as of Price as of Price performance 3 month price 6 month price 12 month price
Company Ticker Primary analyst
08/26/11 06/26/11 since 06/26/11 performance performance performance
Asia Pacific Technology Peer Group
Silitech Technology 3311.TW Robert Yen 74.00 67.82 9.1% 6.0% -0.9% -17.9%
AAC Technologies 2018.HK Robert Yen 14.18 17.38 -18.4% -24.1% -26.8% 5.8%
Acer 2353.TW Henry King 28.85 47.95 -39.8% -48.4% -59.8% -61.5%
Advanced Semiconductor Engineering 2311.TW Edward Yen 25.00 28.70 -12.9% -15.0% -16.3% 20.1%
Advanced Semiconductor Engineering (ADR) ASX Edward Yen 4.24 4.91 -13.7% -16.2% -18.2% 28.5%
AsiaInfo-Linkage ASIA Donald Lu, Ph.D 9.48 14.61 -35.1% -42.7% -52.3% -53.8%
ASM Pacific Technology 0522.HK Donald Lu, Ph.D 75.60 106.80 -29.2% -27.7% -27.3% 20.4%
ASUSTeK Computer 2357.TW Henry King 244.00 229.92 6.1% 8.2% 10.7% 36.6%
AU Optronics 2409.TW Liang-chun Lin 12.25 19.75 -38.0% -47.3% -54.5% -55.7%
Baidu.com, Inc. BIDU Catherine Leung 133.09 128.68 3.4% 2.7% 10.4% 70.0%
BYD Electronic 0285.HK Robert Yen 2.25 3.31 -32.0% -42.9% -53.2% -44.6%
Catcher Technology 2474.TW Henry King 218.00 184.50 18.2% 19.1% 75.8% 202.4%
Changyou.com CYOU Catherine Leung 35.34 40.05 -11.8% -11.9% -6.0% 32.6%
Cheng Uei Precision (Foxlink) 2392.TW Henry King 77.20 72.18 7.0% 17.8% 37.3% 39.5%
Compal Communications 8078.TW Robert Yen 29.30 29.10 0.7% 6.7% 3.7% 15.8%
Compal Electronics 2324.TW Henry King 27.05 33.80 -20.0% -19.9% -22.2% -25.2%
Ctrip.com International CTRP Catherine Leung 38.50 39.31 -2.1% -10.1% -3.2% -1.0%
Delta Electronics 2308.TW Robert Yen 80.10 100.00 -19.9% -27.2% -35.1% -28.8%
Foxconn International Holdings 2038.HK Robert Yen 3.43 3.34 2.7% -17.3% -38.2% -39.3%
Foxconn Technology 2354.TW Henry King 89.70 112.86 -20.5% -28.4% -11.1% -4.9%
HCL Technologies Ltd. HCLT.BO Balaji V. Prasad 362.30 493.00 -26.5% -27.3% -18.7% -12.0%
Hon Hai Precision 2317.TW Henry King 64.20 88.73 -27.6% -30.4% -35.2% -40.7%
HTC Corp. 2498.TW Robert Yen 767.00 1,009.52 -24.0% -32.6% -24.4% 28.0%
Hynix Semiconductor 000660.KS Marcus Shin 17,950.00 27,900.00 -35.7% -42.3% -35.9% -20.6%
Infosys Ltd. INFY.BO Balaji V. Prasad 2,204.55 2,862.10 -23.0% -20.7% -26.7% -20.2%
Infosys Ltd. (ADR) INFY Balaji V. Prasad 47.66 62.36 -23.6% -22.7% -29.2% -18.8%
Chimei Innolux 3481.TW Liang-chun Lin 11.40 22.20 -48.6% -58.8% -63.9% -66.5%
Largan Precision 3008.TW Robert Yen 774.00 898.00 -13.8% -14.0% -4.6% 29.4%
Lenovo Group 0992.HK Henry King 5.00 4.35 14.9% 15.5% 5.7% 11.6%
LG Display 034220.KS Michael Bang 20,000.00 30,200.00 -33.8% -45.9% -45.1% -41.7%
LG Electronics 066570.KS Michael Bang 57,500.00 82,600.00 -30.4% -41.1% -50.9% -40.6%
Longtop Financial Technologies LFT 0.87 18.93 -95.4% -95.4% -97.1% -97.5%
Mediatek 2454.TW Donald Lu, Ph.D 292.50 311.00 -5.9% -4.9% -12.4% -33.2%
Mphasis MBFL.BO Balaji V. Prasad 347.80 437.85 -20.6% -22.6% -22.4% -44.2%
NCsoft 036570.KS Seung Shin 325,000.00 275,000.00 18.2% 23.3% 39.5% 47.7%
NHN 035420.KS Seung Shin 193,000.00 193,000.00 0.0% 2.1% 3.8% -0.5%
E Ink Holdings Inc 8069.TWO Robert Yen 62.00 54.30 14.2% 0.0% 19.2% 33.3%
Quanta Computer 2382.TW Henry King 56.20 65.50 -14.2% -7.1% -3.3% 12.5%
Samsung Electronics 005930.KS Michael Bang 726,000.00 852,000.00 -14.8% -17.4% -21.6% -6.1%
Shanda Games Limited GAME Catherine Leung 5.37 6.11 -12.1% -21.8% -11.7% -10.2%
Shanda Interactive Entertainment SNDA Catherine Leung 32.92 37.14 -11.4% -22.0% -22.6% -19.7%
Siliconware Precision Industries 2325.TW Edward Yen 24.90 35.70 -30.3% -30.8% -39.1% -18.0%
Siliconware Precision Industries (ADR) SPIL Edward Yen 4.14 6.08 -31.9% -33.2% -38.3% -11.7%
SINA Corporation SINA Catherine Leung 93.23 89.35 4.3% -16.8% 14.4% 126.1%
Sohu.com SOHU Catherine Leung 73.04 68.47 6.7% -9.2% -11.4% 54.6%
Tata Consultancy Services Ltd. TCS.BO Balaji V. Prasad 949.15 1,136.20 -16.5% -16.2% -14.6% 8.6%
Tencent Holdings 0700.HK Catherine Leung 175.40 209.80 -16.4% -19.5% -12.1% 24.8%
TPV Technology 0903.HK Liang-chun Lin 3.24 3.77 -14.1% -27.0% -28.9% -29.7%
TSMC 2330.TW Donald Lu, Ph.D 67.90 72.90 -6.9% -8.5% -3.7% 15.5%
TSMC (ADR) TSM Donald Lu, Ph.D 11.35 12.40 -8.5% -13.8% -7.6% 19.9%
UFIDA Software Co. 600588.SS Evan Xu 23.90 20.41 17.1% 21.0% 11.1% 5.8%
United Microelectronics Corp. 2303.TW Donald Lu, Ph.D 10.80 14.05 -23.1% -25.8% -29.9% -18.5%
United Microelectronics Corp. (ADR) UMC Donald Lu, Ph.D 1.87 2.46 -24.0% -27.2% -34.6% -29.4%
Wipro Ltd. WIPR.BO Balaji V. Prasad 319.25 423.45 -24.6% -26.5% -26.3% -20.2%
Wipro Ltd. (ADR) WIT Balaji V. Prasad 9.53 12.87 -26.0% -30.7% -28.2% -26.4%
Wistron 3231.TW Henry King 31.55 46.62 -32.3% -34.7% -37.4% -33.1%
WNS (Holdings) Ltd. WNS Vincent Lin, CFA 10.01 8.98 11.5% 7.4% -1.3% 11.3%
ZTE Corporation (A) 000063.SZ Donald Lu, Ph.D 18.93 22.45 -15.7% -10.9% -26.0% -1.1%
ZTE Corporation (H) 0763.HK Donald Lu, Ph.D 19.88 27.05 -26.5% -25.1% -29.6% -13.7%
Taiwan SE Weighted Index 7,445 8,533 -12.7% -15.3% -13.4% -3.2%
Source: FactSet, Quantum Database.
Goldman Sachs Global Investment Research 7
8. August 29, 2011 Silitech Technology (3311.TW)
Financial advisory disclosure
Goldman Sachs is acting as financial adviser to Samsung Electronics in an announced
strategic transaction.
Goldman Sachs Global Investment Research 8
9. August 29, 2011 Silitech Technology (3311.TW)
Reg AC
I, Robert Yen, hereby certify that all of the views expressed in this report accurately reflect my personal views about the subject company or
companies and its or their securities. I also certify that no part of my compensation was, is or will be, directly or indirectly, related to the specific
recommendations or views expressed in this report.
Investment Profile
The Goldman Sachs Investment Profile provides investment context for a security by comparing key attributes of that security to its peer group and
market. The four key attributes depicted are: growth, returns, multiple and volatility. Growth, returns and multiple are indexed based on composites
of several methodologies to determine the stocks percentile ranking within the region's coverage universe.
The precise calculation of each metric may vary depending on the fiscal year, industry and region but the standard approach is as follows:
Growth is a composite of next year's estimate over current year's estimate, e.g. EPS, EBITDA, Revenue. Return is a year one prospective aggregate
of various return on capital measures, e.g. CROCI, ROACE, and ROE. Multiple is a composite of one-year forward valuation ratios, e.g. P/E, dividend
yield, EV/FCF, EV/EBITDA, EV/DACF, Price/Book. Volatility is measured as trailing twelve-month volatility adjusted for dividends.
Quantum
Quantum is Goldman Sachs' proprietary database providing access to detailed financial statement histories, forecasts and ratios. It can be used for
in-depth analysis of a single company, or to make comparisons between companies in different sectors and markets.
GS SUSTAIN
GS SUSTAIN is a global investment strategy aimed at long-term, long-only performance with a low turnover of ideas. The GS SUSTAIN focus list
includes leaders our analysis shows to be well positioned to deliver long term outperformance through sustained competitive advantage and
superior returns on capital relative to their global industry peers. Leaders are identified based on quantifiable analysis of three aspects of corporate
performance: cash return on cash invested, industry positioning and management quality (the effectiveness of companies' management of the
environmental, social and governance issues facing their industry).
Disclosure Appendix
Coverage group(s) of stocks by primary analyst(s)
Robert Yen: Asia Pacific Technology.
Asia Pacific Technology: AAC Technologies, Acer, Advanced Semiconductor, Advanced Semiconductor (ADR), ASUSTeK Computer, AU Optronics,
BYD Electronic, Catcher Technology, Cheng Uei Precision (Foxlink), Chimei Innolux, China Wireless Technologies, Chipbond Technology Corp.,
Compal Communications, Compal Electronics, Coretronic, Delta Electronics, E Ink Holdings Inc, Epistar, Everlight Electronics, Foxconn Int'l Holdings,
Foxconn Technology, Hon Hai Precision, HTC Corp., Kinsus Interconnect Technology, Largan Precision, Lenovo Group, Lite-On Technology, Nan Ya
PCB, Novatek Microelectronics, Pegatron, Powertech Technology, Quanta Computer, Radiant Opto-Electronics, Siliconware Precision, Siliconware
Precision (ADR), Silitech Technology, SK C&C, TCL Communication, TPK Holding, TPV Technology, Tripod Technology, Unimicron, Wintek, Wistron,
Young Fast Optoelectronics.
Company-specific regulatory disclosures
The following disclosures relate to relationships between The Goldman Sachs Group, Inc. (with its affiliates, "Goldman Sachs") and companies
covered by the Global Investment Research Division of Goldman Sachs and referred to in this research.
There are no company-specific disclosures for: Silitech Technology (NT$74.00)
Distribution of ratings/investment banking relationships
Goldman Sachs Investment Research global coverage universe
Rating Distribution Investment Banking Relationships
Buy Hold Sell Buy Hold Sell
Global 32% 54% 14% 52% 41% 37%
As of July 1, 2011, Goldman Sachs Global Investment Research had investment ratings on 3,167 equity securities. Goldman Sachs assigns stocks as
Buys and Sells on various regional Investment Lists; stocks not so assigned are deemed Neutral. Such assignments equate to Buy, Hold and Sell for
the purposes of the above disclosure required by NASD/NYSE rules. See 'Ratings, Coverage groups and views and related definitions' below.
Goldman Sachs Global Investment Research 9
10. August 29, 2011 Silitech Technology (3311.TW)
Price target and rating history chart(s)
Silite ch Technology (3311.TW) Stock Price Currency : Taiw an Dollar
Goldman Sachs rating and stock price target history
10,000
140 63.72 104 70 53
58.02 107.92
120 70.58 101 9,000
73.52 28.43
100 8,000
57.84
80 7,000
60 100.99 100 80 6,000
40 81.19
20 111.88 5,000
109.9
0 4,000
Aug 12 Apr 26
Stock Price
Index Price
S N
A S O N D J F MA MJ J A S O N D J F MA M J J A S O N D J F MA M J
2008 2009 2010 2011
Source: Goldman Sachs Investment Research for ratings and price targets; FactSet closing prices as of 6/30/2011.
Rating Covered by Robert Yen,
Jul 1, 2008 NA
Jun 26, 2011 to S f rom N Price target as of Aug 12, 2008
Price target at removal Not covered by current analyst
Taiw an SE Weighted
Index
The price targets show n should be considered in the context of all prior published Goldman Sachs research, w hich may or
may not have included price targets, as w ell as developments relating to the company, its industry and f inancial markets.
Regulatory disclosures
Disclosures required by United States laws and regulations
See company-specific regulatory disclosures above for any of the following disclosures required as to companies referred to in this report: manager
or co-manager in a pending transaction; 1% or other ownership; compensation for certain services; types of client relationships; managed/co-
managed public offerings in prior periods; directorships; for equity securities, market making and/or specialist role. Goldman Sachs usually makes a
market in fixed income securities of issuers discussed in this report and usually deals as a principal in these securities.
The following are additional required disclosures: Ownership and material conflicts of interest: Goldman Sachs policy prohibits its analysts,
professionals reporting to analysts and members of their households from owning securities of any company in the analyst's area of coverage.
Analyst compensation: Analysts are paid in part based on the profitability of Goldman Sachs, which includes investment banking revenues.
Analyst as officer or director: Goldman Sachs policy prohibits its analysts, persons reporting to analysts or members of their households from
serving as an officer, director, advisory board member or employee of any company in the analyst's area of coverage. Non-U.S. Analysts: Non-U.S.
analysts may not be associated persons of Goldman Sachs & Co. and therefore may not be subject to NASD Rule 2711/NYSE Rules 472 restrictions
on communications with subject company, public appearances and trading securities held by the analysts.
Distribution of ratings: See the distribution of ratings disclosure above. Price chart: See the price chart, with changes of ratings and price targets
in prior periods, above, or, if electronic format or if with respect to multiple companies which are the subject of this report, on the Goldman Sachs
website at http://www.gs.com/research/hedge.html.
Additional disclosures required under the laws and regulations of jurisdictions other than the United
States
The following disclosures are those required by the jurisdiction indicated, except to the extent already made above pursuant to United States laws
and regulations. Australia: This research, and any access to it, is intended only for "wholesale clients" within the meaning of the Australian
Corporations Act. Brazil: Disclosure information in relation to CVM Instruction 483 is available at http://www.gs.com/worldwide/brazil/gir/index.html.
Where applicable, the Brazil-registered analyst primarily responsible for the content of this research report, as defined in Article 16 of CVM
Instruction 483, is the first author named at the beginning of this report, unless indicated otherwise at the end of the text. Canada: Goldman Sachs
& Co. has approved of, and agreed to take responsibility for, this research in Canada if and to the extent it relates to equity securities of Canadian
issuers. Analysts may conduct site visits but are prohibited from accepting payment or reimbursement by the company of travel expenses for such
visits. Hong Kong: Further information on the securities of covered companies referred to in this research may be obtained on request from
Goldman Sachs (Asia) L.L.C. India: Further information on the subject company or companies referred to in this research may be obtained from
Goldman Sachs (India) Securities Private Limited; Japan: See below. Korea: Further information on the subject company or companies referred to
in this research may be obtained from Goldman Sachs (Asia) L.L.C., Seoul Branch. Russia: Research reports distributed in the Russian Federation
are not advertising as defined in the Russian legislation, but are information and analysis not having product promotion as their main purpose and
do not provide appraisal within the meaning of the Russian legislation on appraisal activity. Singapore: Further information on the covered
companies referred to in this research may be obtained from Goldman Sachs (Singapore) Pte. (Company Number: 198602165W). Taiwan: This
material is for reference only and must not be reprinted without permission. Investors should carefully consider their own investment risk.
Investment results are the responsibility of the individual investor. United Kingdom: Persons who would be categorized as retail clients in the
United Kingdom, as such term is defined in the rules of the Financial Services Authority, should read this research in conjunction with prior
Goldman Sachs research on the covered companies referred to herein and should refer to the risk warnings that have been sent to them by
Goldman Sachs International. A copy of these risks warnings, and a glossary of certain financial terms used in this report, are available from
Goldman Sachs International on request.
European Union: Disclosure information in relation to Article 4 (1) (d) and Article 6 (2) of the European Commission Directive 2003/126/EC is
available at http://www.gs.com/client_services/global_investment_research/europeanpolicy.html which states the European Policy for Managing
Conflicts of Interest in Connection with Investment Research.
Japan: Goldman Sachs Japan Co., Ltd. is a Financial Instrument Dealer under the Financial Instrument and Exchange Law, registered with the
Kanto Financial Bureau (Registration No. 69), and is a member of Japan Securities Dealers Association (JSDA) and Financial Futures Association of
Japan (FFAJ). Sales and purchase of equities are subject to commission pre-determined with clients plus consumption tax. See company-specific
disclosures as to any applicable disclosures required by Japanese stock exchanges, the Japanese Securities Dealers Association or the Japanese
Securities Finance Company.
Ratings, coverage groups and views and related definitions
Buy (B), Neutral (N), Sell (S) -Analysts recommend stocks as Buys or Sells for inclusion on various regional Investment Lists. Being assigned a Buy
or Sell on an Investment List is determined by a stock's return potential relative to its coverage group as described below. Any stock not assigned
as a Buy or a Sell on an Investment List is deemed Neutral. Each regional Investment Review Committee manages various regional Investment
Lists to a global guideline of 25%-35% of stocks as Buy and 10%-15% of stocks as Sell; however, the distribution of Buys and Sells in any particular
Goldman Sachs Global Investment Research 10
11. August 29, 2011 Silitech Technology (3311.TW)
coverage group may vary as determined by the regional Investment Review Committee. Regional Conviction Buy and Sell lists represent
investment recommendations focused on either the size of the potential return or the likelihood of the realization of the return.
Return potential represents the price differential between the current share price and the price target expected during the time horizon associated
with the price target. Price targets are required for all covered stocks. The return potential, price target and associated time horizon are stated in
each report adding or reiterating an Investment List membership.
Coverage groups and views: A list of all stocks in each coverage group is available by primary analyst, stock and coverage group at
http://www.gs.com/research/hedge.html. The analyst assigns one of the following coverage views which represents the analyst's investment
outlook on the coverage group relative to the group's historical fundamentals and/or valuation. Attractive (A). The investment outlook over the
following 12 months is favorable relative to the coverage group's historical fundamentals and/or valuation. Neutral (N). The investment outlook
over the following 12 months is neutral relative to the coverage group's historical fundamentals and/or valuation. Cautious (C). The investment
outlook over the following 12 months is unfavorable relative to the coverage group's historical fundamentals and/or valuation.
Not Rated (NR). The investment rating and target price have been removed pursuant to Goldman Sachs policy when Goldman Sachs is acting in
an advisory capacity in a merger or strategic transaction involving this company and in certain other circumstances. Rating Suspended (RS).
Goldman Sachs Research has suspended the investment rating and price target for this stock, because there is not a sufficient fundamental basis
for determining, or there are legal, regulatory or policy constraints around publishing, an investment rating or target. The previous investment
rating and price target, if any, are no longer in effect for this stock and should not be relied upon. Coverage Suspended (CS). Goldman Sachs has
suspended coverage of this company. Not Covered (NC). Goldman Sachs does not cover this company. Not Available or Not Applicable (NA).
The information is not available for display or is not applicable. Not Meaningful (NM). The information is not meaningful and is therefore excluded.
Global product; distributing entities
The Global Investment Research Division of Goldman Sachs produces and distributes research products for clients of Goldman Sachs, and
pursuant to certain contractual arrangements, on a global basis. Analysts based in Goldman Sachs offices around the world produce equity
research on industries and companies, and research on macroeconomics, currencies, commodities and portfolio strategy. This research is
disseminated in Australia by Goldman Sachs & Partners Australia Pty Ltd (ABN 21 006 797 897) on behalf of Goldman Sachs; in Brazil by Goldman
Sachs do Brasil Banco Múltiplo S.A.; in Canada by Goldman Sachs & Co. regarding Canadian equities and by Goldman Sachs & Co. (all other
research); in Hong Kong by Goldman Sachs (Asia) L.L.C.; in India by Goldman Sachs (India) Securities Private Ltd.; in Japan by Goldman Sachs
Japan Co., Ltd.; in the Republic of Korea by Goldman Sachs (Asia) L.L.C., Seoul Branch; in New Zealand by Goldman Sachs & Partners New
Zealand Limited on behalf of Goldman Sachs; in Russia by OOO Goldman Sachs; in Singapore by Goldman Sachs (Singapore) Pte. (Company
Number: 198602165W); and in the United States of America by Goldman Sachs & Co. Goldman Sachs International has approved this research in
connection with its distribution in the United Kingdom and European Union.
European Union: Goldman Sachs International, authorized and regulated by the Financial Services Authority, has approved this research in
connection with its distribution in the European Union and United Kingdom; Goldman Sachs & Co. oHG, regulated by the Bundesanstalt für
Finanzdienstleistungsaufsicht, may also distribute research in Germany.
General disclosures
This research is for our clients only. Other than disclosures relating to Goldman Sachs, this research is based on current public information that we
consider reliable, but we do not represent it is accurate or complete, and it should not be relied on as such. We seek to update our research as
appropriate, but various regulations may prevent us from doing so. Other than certain industry reports published on a periodic basis, the large
majority of reports are published at irregular intervals as appropriate in the analyst's judgment.
Goldman Sachs conducts a global full-service, integrated investment banking, investment management, and brokerage business. We have
investment banking and other business relationships with a substantial percentage of the companies covered by our Global Investment Research
Division. Goldman Sachs & Co., the United States broker dealer, is a member of SIPC (http://www.sipc.org).
Our salespeople, traders, and other professionals may provide oral or written market commentary or trading strategies to our clients and our
proprietary trading desks that reflect opinions that are contrary to the opinions expressed in this research. Our asset management area, our
proprietary trading desks and investing businesses may make investment decisions that are inconsistent with the recommendations or views
expressed in this research.
We and our affiliates, officers, directors, and employees, excluding equity and credit analysts, will from time to time have long or short positions in,
act as principal in, and buy or sell, the securities or derivatives, if any, referred to in this research.
This research is not an offer to sell or the solicitation of an offer to buy any security in any jurisdiction where such an offer or solicitation would be
illegal. It does not constitute a personal recommendation or take into account the particular investment objectives, financial situations, or needs of
individual clients. Clients should consider whether any advice or recommendation in this research is suitable for their particular circumstances and,
if appropriate, seek professional advice, including tax advice. The price and value of investments referred to in this research and the income from
them may fluctuate. Past performance is not a guide to future performance, future returns are not guaranteed, and a loss of original capital may
occur. Fluctuations in exchange rates could have adverse effects on the value or price of, or income derived from, certain investments.
Certain transactions, including those involving futures, options, and other derivatives, give rise to substantial risk and are not suitable for all
investors. Investors should review current options disclosure documents which are available from Goldman Sachs sales representatives or at
http://www.theocc.com/about/publications/character-risks.jsp. Transactions cost may be significant in option strategies calling for multiple purchase
and sales of options such as spreads. Supporting documentation will be supplied upon request.
All research reports are disseminated and available to all clients simultaneously through electronic publication to our internal client websites. Not
all research content is redistributed to our clients or available to third-party aggregators, nor is Goldman Sachs responsible for the redistribution of
our research by third party aggregators. For all research available on a particular stock, please contact your sales representative or go to
http://360.gs.com.
Disclosure information is also available at http://www.gs.com/research/hedge.html or from Research Compliance, 200 West Street, New York, NY
10282.
Copyright 2011 Goldman Sachs.
No part of this material may be (i) copied, photocopied or duplicated in any form by any means or (ii) redistributed without the
prior written consent of The Goldman Sachs Group, Inc.
Goldman Sachs Global Investment Research 11