1. Statistical Sampling and Regression: Convariance and
Correlation
Covariance and correlation describe how two variables are related.
• Variables are positively related if they move in the same direction.
• Variables are inversely related if they move in opposite directions.
Both covariance and correlation indicate whether variables are positively or
inversely related. Correlation also tells you the degree to which the variables tend
to move together.
You are probably already familiar with statements about covariance and
correlation that appear in the news almost daily. For example, you might hear
that as economic growth increases, stock market returns tend to increase as well.
These variables are said to be positively related because they move in the same
direction. You may also hear that as world oil production increases, gasoline
prices fall. These variables are said to be negatively, or inversely, related because
they move in opposite directions.
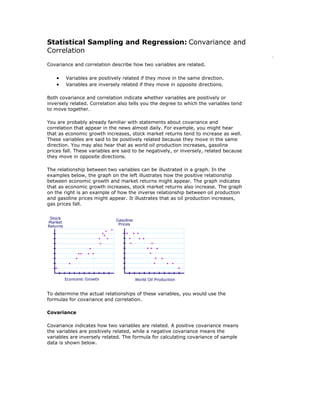
The relationship between two variables can be illustrated in a graph. In the
examples below, the graph on the left illustrates how the positive relationship
between economic growth and market returns might appear. The graph indicates
that as economic growth increases, stock market returns also increase. The graph
on the right is an example of how the inverse relationship between oil production
and gasoline prices might appear. It illustrates that as oil production increases,
gas prices fall.
To determine the actual relationships of these variables, you would use the
formulas for covariance and correlation.
Covariance
Covariance indicates how two variables are related. A positive covariance means
the variables are positively related, while a negative covariance means the
variables are inversely related. The formula for calculating covariance of sample
data is shown below.
2. x = the independent variable
y = the dependent variable
n = number of data points in the sample
= the mean of the independent variable x
= the mean of the dependent variable y
To understand how covariance is used, consider the table below, which describes
the rate of economic growth (xi) and the rate of return on the S&P 500 (yi).
Using the covariance formula, you can determine whether economic growth and
S&P 500 returns have a positive or inverse relationship. Before you compute the
covariance, calculate the mean of x and y. (The Summary Measures topic of the
Discrete Probability Distributions section explains the mean formula in detail.)
3. Now you can identify the variables for the covariance formula as follows.
x = 2.1, 2.5, 4.0, and 3.6 (economic growth)
y = 8, 12, 14, and 10 (S&P 500 returns)
= 3.1
= 11
Substitute these values into the covariance formula to determine the relationship
between economic growth and S&P 500 returns.
4. The covariance between the returns of the S&P 500 and economic growth is 1.53.
Since the covariance is positive, the variables are positively related—they move
together in the same direction.
Correlation
Correlation is another way to determine how two variables are related. In addition
to telling you whether variables are positively or inversely related, correlation also
tells you the degree to which the variables tend to move together.
As stated above, covariance measures variables that have different units of
measurement. Using covariance, you could determine whether units were
increasing or decreasing, but it was impossible to measure the degree to which
the variables moved together because covariance does not use one standard unit
of measurement. To measure the degree to which variables move together, you
must use correlation.
Correlation standardizes the measure of interdependence between two variables
and, consequently, tells you how closely the two variables move. The correlation
measurement, called a correlation coefficient, will always take on a value between
1 and – 1:
• If the correlation coefficient is one, the variables have a perfect positive
correlation. This means that if one variable moves a given amount, the
second moves proportionally in the same direction. A positive correlation
coefficient less than one indicates a less than perfect positive correlation,
with the strength of the correlation growing as the number approaches
one.
• If correlation coefficient is zero, no relationship exists between the
variables. If one variable moves, you can make no predictions about the
movement of the other variable; they are uncorrelated.
• If correlation coefficient is –1, the variables are perfectly negatively
correlated (or inversely correlated) and move in opposition to each other.
If one variable increases, the other variable decreases proportionally. A
negative correlation coefficient greater than –1 indicates a less than
perfect negative correlation, with the strength of the correlation growing
as the number approaches –1.
Test your understanding of how correlations might look graphically. In the box
below, choose one of the three sets of purple points and drag it to the correlation
coefficient it illustrates: 1, –1, or 0. If your choice is correct, an explanation of the
correlation will appear. Remember to close the Instructions box before you begin.
5. This interactive tool illustrates the theoretical extremes of the idea of correlation
coefficients between two variables: 1, –1, or 0. These figures serve only to
provide an idea of the boundaries on correlations. In practice, most variables will
not be perfectly correlated, but they will instead take on a fractional correlation
coefficient between 1 and –1.
To calculate the correlation coefficient for two variables, you would use the
correlation formula, shown below.
r(x,y) = correlation of the variables x and y
COV(x, y) = covariance of the variables x and y
sx = sample standard deviation of the random variable x
sy = sample standard deviation of the random variable y
Earlier in this discussion, you saw how the covariance of S&P 500 returns and
economic growth was calculated using data from the following table. Now consider
how their correlation is measured.
6. To calculate correlation, you must know the covariance for the two variables and
the standard deviations of each variable. From the earlier example, you know that
the covariance of S&P 500 returns and economic growth was calculated to be
1.53. Now you need to determine the standard deviation of each of the variables.
You would calculate the standard deviation of the S&P 500 returns and the
economic growth from the above example as follows. (For a more detailed
explanation of calculating standard deviation, refer to the Summary Measures
topic of the Discrete Probability Distributions section of the course.)
7. Using the information from above, you know that
COV(x,y) = 1.53
sx = 0.90
sy = 2.58
Now you can calculate the correlation coefficient by substituting the numbers
above into the correlation formula, as shown below.
8. A correlation coefficient of .66 tells you two important things:
• Because the correlation coefficient is a positive number, returns on the
S&P 500 and economic growth are postively related.
• Because .66 is relatively far from indicating no correlation, the strength of
the correlation between returns on the S&P 500 and economic growth is
strong.
Both covariance and correlation identified that the variables are positively related.
By standardizing measures, correlation is also able to measure the degree to
which the variables tend to move together.
In business, covariance and correlation are used frequently to analyze market
returns for anything from an individual stock to a market composite. In addition,
marketing executives use covariance and correlation to understand the
interdependence between consumer behavior and the consumption of their
products.
1. If there is a positive relationship between the scores of job incumbents on a job
knowledge test and actual job performance, which of the following graphs would
most likely be an accurate representation of this situation?
9. Solution 1
2. In each of the graphs, are job performance and test performance shown to be
positively related, inversely related, or unrelated?
Solution 2
3. Given the following return information, what is the covariance between the
return of Stock A and the return of the market index?
Solution 3
4. Using the table and your calculations from above, calculate the correlation of