SlideShare a Scribd company logo
1 of 4
Download to read offline
OCTOBER/NOVEMBER 2012                                                                                                                Robb Fleischer
                                                                                                                                     American Marketing Systems, Inc.
                    Inside This Issue
                                                                                                                                     2800 Van Ness Avenue
      > LOCAL MARKET TRENDS ..................... 1                                                                                  San Francisco, CA 94109
      > MORTGAGE RATE OUTLOOK ............... 2                                                                                      (415) 447-2009
                                                                                                                                     rfleischer@amsiemail.com
      > HOME STATISTICS .............................. 2
                                                                                                                                     http://www.amsires.com/staff/robb
      > FORECLOSURE STATS ........................ 3                                                                                 DRE #01403882
      > CONDO STATISTICS ............................ 3
      > MOMENTUM CHARTS .......................... 4


The Real Estate Report
 local market trends                                                                                                                       Trends at a Glance
                                                                                                                                           (Single-family Homes)
                                                                                                                                                  Sep 12     Aug 12         Sep 11
                                                                                 SAN FRANCISCO                                      Home Sales:       241        229           192
                                                                                                                                   Median Price: $670,000     $ 768,000    $672,500
Price Surge in the Making?                                                                                                        Av erage Price: $844,479    $1,001,306   $883,112
                                                                                                                            Sale/List Price Ratio:   104.5%      104.3%      100.3%
Followers of the market report know inventory in                    With the economy as strong as it is here, think
                                                                                                                                Day s on Market:         50           47         62
San Francisco has been at or near record lows for                   Silicon Valley North setting up shop south of
                                                                                                                                            (Lofts/Tow nhomes/TIC)
the past year.                                                      Market, demand for homes is strong.
                                                                                                                                                     Sep 12      Aug 12     Sep 11
Inventory, or lack thereof, will be the determining                 With only a two months supply of properties on the             Condo Sales:         248         298        183
factor in appreciation.                                             market, where will new inventory come from?
                                                                                                                                   Median Price: $705,000     $ 730,000    $598,199
     San Francisco Price Differences                                There is no “massive shadow inventory”. Banks                 Av erage Price: $828,376    $ 813,011    $686,094
       from January & Peak & Trough                                 only own about one months worth of inventory.           Sale/List Price Ratio:   101.0%      101.1%       98.1%
 Hom es: detached                                                                                                               Day s on Market:         50           54         83
           YTD Peak % Trough % Peak Trough                          The only other explanation for low inventory is
  3-month       17%         -21%             20% Jun-07    Feb-12   homeowners who are underwater. Yet, underwater        The median price for homes dipped 0.4% year-
                                                                    homeowners account for less than 10% of all           over-year. There are two times a year when prices
 12-month         4%        -20%               5% Apr-08   Mar-12
                                                                    homes with mortgages in the city.                     historically dip, in good markets or bad. The first is
 Hom es: attached
  3-month       15%          -9%             15% Jul-08    Jan-12   And, as you know, there is very little land for       in January. The second is in August/September.
                                                                    development in the city.
 12-month         7%        -10%               7% Aug-08   Jan-12                                                         SALES MOMENTUM…
This has had a salubrious effect on prices. The                     Unless there’s a massive surge of retirees moving     for homes rose one point to +9.3. For condos,
median price for single-family, re-sale homes is up                 to Palm Springs, low inventory is here to stay.       sales momentum gained 2.4 points to +14.3.
17% year-to-date, while the median price for                        SEPTEMBER MARKET STATISTICS                           PRICING MOMENTUM…
condos/townhomes is up 15%.                                         Sales of single-family, re-sale homes rose 5.2%       continued moving upward in September, rising 0.4
You can see in the table of price differences that                  from August, and were up 25.5% year-over-year.        of a point to +1.9. The number for condos rose 1.7
San Francisco prices did not drop anywhere near                                                                           points to +4.5.
                                                                    Sales are being impacted by the lack of inventory.
as much as in other counties in the Bay Area. In
fact, market lows weren’t reached until the
                                                                    There are only 537 homes for sale in the city.        WE CALCULATE…
                                                                    That’s only two and a half months of supply!          momentum by using a 12-month moving average
beginning of this year!
                                                                                                                                   to eliminate seasonality. By comparing
                                                                                                                                   this year’s 12-month moving average
  San Francisco Homes: Year-Over-Year Median Sales Price Change
                                                                                                                                   to last year’s, we get a percentage
 30.0%                                                                                                                             showing market momentum.
 20.0%                                                                                                                                   CONDO STATISTICS…
 10.0%                                                                                                                                   The median price for condos gained
                                                                                                                                         17.9% year-over-year. Sales were up
  0.0%                                                                                                                                   35.5% from last September. There are
       0 FMAMJ JA SOND0 FMAMJ JA SOND0 FMAMJ JA SOND1 FMAMJ JA SOND1 FMAMJ JA SOND1 FMAMJ JA S
-10.0% 7              8              9              0              1              2
                                                                                                                                         462 condos/lofts for sale, less than two
                                                                                                                                         months supply.
-20.0%
                                                                                                                                         This is an tough market for buyers. Be
-30.0%
                                                                                                                                         calm and realistic. If you don’t know
-40.0%                                                                                                                                   where to begin, give me a call.
                                                                                                                © 2012 rereport.com


                                                  Robb Fleischer | rfleischer@amsiemail.com | (415) 447-2009
The Real Estate Report


                                                  Mortgage Rate Outlook
30-Year Fixed Mortgage Rates                      Oct 5, 2012 -- Even though some of the economic news         climate... which in turn might temper growth. What to
                                                  was a little warmer this week, mortgage rates contin-        cheer for? Broad-based economic gains which take
07-12
                                                  ued their downward drive. However, the decline this          the Fed out of the picture, letting markets again dis-
04-12                                             week was more muted than last week's, and with the           cover the true price of mortgages? Or to root for in-
01-12                                             cumulative benefit of the Fed's "QEternity" program          terest rates to remain at artificially low levels, so that
10-11                                             of purchasing Mortgage-Backed Securities closing in          more homeowners can profitably refinance, or to see
07-11
04-11                                             on a quarter-percentage point, we may not have all           home prices reflated though the inducement of af-
01-11                                             that much room for rates yet to fall at the moment.          fordability-driven sales?
10-10
07-10                                             HSH.com's broad-market mortgage tracker found the            At some point, and for some time thereafter, we are
04-10                                             overall average rate for 30-year fixed-rate mortgages        likely to see both. How long such conditions -- a ris-
01-10
10-09                                             declined by just two basis points (0.02%) to 3.68%, a        ing economy with rock-bottom rates -- might last is
07-09                                             new record low, while the FRMI's 15-year companion           anyone's guess at this point. The Fed has pledged to
04-09                                             shed three basis points to land at a new record low of       keep its foot on the gas even after the economy gets
01-09
10-08
                                                  an even 3%. FHA-backed 30-year FRMs downshifted              more fully underway, but that strikes us as a nervous
07-08                                             by just a single basis basis point, as the most viable       time in the markets, indeed.
04-08                                             option for credit- or equity-impaired borrowers trickled
01-08                                                                                                          It would appear that the decline in rates has sof-
                                                  to a new low of 3.28%. Finally, the overall average
10-07                                                                                                          tened, at least for the moment. When the Fed an-
07-07                                             rate for 5/1 Hybrid ARMs held fast at 2.70% for a
                                                                                                               nounced its program, we reckoned it might have a
04-07                                             third consecutive week, remaining at a record low.
01-07                                                                                                          value of a quarter-percentage point on rates given
10-06                                             The Fed's program of manipulating mortgage prices            current conditions, and we'll stand by that assess-
07-06                                             is a two-edged sword, or at least a Catch-22. The            ment for at least the moment. That being the case,
04-06
01-06                                             Fed wants to see more economic growth, so it push-           and since much of that expected decline is now in
     3.0%   4.0%   5.0%   6.0%   7.0%   8.0%      es mortgage rates down to help foster growth. If the         place, we'll call for rates to be about unchanged next
                                                  economy is improving or does start to improve, the           week.
                                                  Fed will need to do less to achieve its goals, and
                                                  mortgage rates would tend to rise with the improving

                                         San Francisco Homes: Sold Prices & Unit Sales
The chart above shows the Na-                         (3-month moving average — $000's)
tional monthly average for 30-
year fixed rate mortgages as             $1,500                                                                                                                      300
compiled by HSH.com. The av-             $1,300                                                                                                                      250
erage includes mortgages of all
sizes, including conforming,             $1,100                                                                                                                      200
"expanded conforming," and                 $900                                                                                                                      150
jumbo.
                                           $700                                                                                                                      100
                                           $500                                                                                                                      50
                                           $300                                                                                                                      0
                                                   0 FMAMJ JASOND0 FMAMJ JASOND0 FMAMJ JASOND1 FMAMJ JASOND1 FMAMJ JASOND1 FMAMJ JAS
                                                   7             8             9             0             1             2
                                                Ave          Med         Units                                                                 © 2012 rereport.com

                                                                                              September Sales Statistics
                                                                                                 (Single-family Homes)
                                                                         Prices                Unit                Change from last yearChange from last m onth
                                                                 Median   Average Sales DOM SP/LP Median Average Sales Median Average Sales
                                                 San Francisco $ 670,000 $ 844,479  241   50 104.5% -0.4%   -4.4% 25.5% -12.8%  -15.7% 5.2%
                                                  D1: Northw est $1,165,000      $1,386,682      11   42 102.9%     19.5%      10.5% -31.3%     8.4%       -0.6% -35.3%
                                               D2: Central West $ 855,000        $ 851,011       19   35 105.8%     24.8%      25.1% -48.6%    14.2%        7.4% -48.6%
                                                 D3: Southw est $ 635,000        $ 622,325       15   33 108.6%     33.7%      14.7% 15.4%     22.6%        7.7% -21.1%
                                               D4: Tw in Peaks $ 870,000         $1,035,659      22   29 107.4%      1.8%      3.3%    0.0%    -20.5%     -11.8% -15.4%
                                                      D5: Central $1,390,000     $1,444,638      24   26 110.5%      3.0%      2.0%    4.3%     -1.8%     -17.2% -29.4%
                                               D6: Central North $1,827,500      $1,827,500       2   52   93.8%       n/a       n/a     n/a   31.0%      32.1% -33.3%
                                                       D7: North $2,550,000      $3,958,333       3   11 121.9%      4.1%      21.0% -40.0%    -40.8%      -6.4% -25.0%
                                                  D8: Northeast $1,765,000       $2,274,267       3   83   74.7%    -49.4%    -34.8% 50.0%     87.6%     141.7% 200.0%
                                               D9: Central East $ 829,000        $ 876,000       15   43 104.7%     21.9%      11.5% -21.1%     5.6%      10.2% -50.0%
Page 2                                          D10: Southeast $ 490,000         $ 496,613       55   61 105.3%      8.6%      12.1%   0.0%     -5.0%      -2.3%   -3.5%
San Francisco Condos/Lofts: Year-Over-Year Median Sales Price Change
30.0%

20.0%

10.0%

 0.0%
       0 FMAMJ JA SOND0 FMAMJ JA SOND0 FMAMJ JA SOND1 FMAMJ JA SOND1 FMAMJ JA SOND1 FMAMJ JA S
-10.0% 7              8              9              0              1              2

-20.0%

-30.0%
                                                                                                        © 2011 rereport.com
FORECLOSURE STATISTICS
In San Francisco, notices of default, the first step in the       investor, bids more than the bank's opening bid, the
foreclosure process, plunged 71% in August from the               property will be sold to the third party; if not, it will go
year before. They were down 50% from July.                        back to the bank and become part of that bank's REO
                                                                  inventory.
Notices of sale, which set the date and time of an auc-
tion, and serve as the homeowner's final notice before            In August, cancellations were off 10.1% from July.
sale, also took a nose-dive in August: down 76% year-             Year-over-year, cancellations were down 16.8%.
over-year, and off 61.1% from July.
                                                                  Properties going back-to-bank jumped 21.1% from July,
After the filing of a Notice of Trustee Sale, there are           but were down 57.4% year-over-year.
only three possible outcomes. First, the sale can be
                                                                  The total number of properties that have had a notice of
cancelled for reasons that include a successful loan
                                                                  default filed decreased by 54.2% compared to last year.
modification or short sale, a filing error, or a legal re-
                                                                  They were also down 24.2% from July.
quirement to re-file the notice after extended postpone-
ments, like bankruptcy.                                           The total number of properties scheduled for sale de-
                                                                  clined by 30.8% year-over-year. Properties scheduled
Alternatively, if the property is taken to sale, the bank
                                                                                                            (Continued on page 4)
will place the opening bid. If a third party, typically an

San Francisco Condos: Sold Prices & Unit Sales
            (3-month moving average — $000's)

 $1,000                                                                                                                          350
                                                                                                                                           Table Definitions
  $900                                                                                                                           300       _______________
  $800                                                                                                                           250
  $700                                                                                                                           200           Median Price
                                                                                                                                       The price at which 50% of pric-
  $600                                                                                                                           150
                                                                                                                                        es were higher and 50%were
  $500                                                                                                                           100                lower.
  $400                                                                                                                           50
  $300                                                                                                                           0            Average Price
           0 FMAMJ JASOND0 FMAMJ JASOND0 FMAMJ JASOND1 FMAMJ JASOND1 FMAMJ JASOND1 FMAMJ JAS                                           Add all prices and divide by the
           7             8             9             0             1             2                                                             number of sales.
         Ave       Med          Units                                                                   © 2012 rereport.com
                                                                                                                                                   SP/LP
                                             September Sales Statistics                                                                Sales price to list price ratio or
                                                                                                                                       the price paid for the property
                                              (Condos/TICs/Co-ops/Lofts)                                                                divided by the asking price.
                          Prices              Unit                    Change from last yearChange from last m onth
                  Median   Average Sales DOM SP/LP Median Average Sales Median Average Sales                                                         DOI
  San Francisco $ 705,000 $ 828,376  248   50 101.0% 17.9%  20.7% 35.5%  -3.4%    1.9% -16.8%                                          Days of Inventory, or how many
                                                                                                                                       days it would take to sell all the
   D1: Northw est $ 697,000     $ 764,750        10    82 101.4%       30.3%     29.4% 11.1%      -10.4%       -2.3% -16.7%
                                                                                                                                       property for sale at the current
 D2: Central West $ 783,000     $ 959,333        3     67     99.0%    37.4%     68.3% 200.0%       5.8%      32.6%     0.0%                    rate of sales.
  D3: Southw est $ 325,000      $ 322,000        4     96 108.1%       18.6%     15.6% -33.3%       3.0%       1.7% -33.3%
 D4: Tw in Peaks $ 299,000      $ 299,000        1     85 100.0%        8.0%      8.0% -50.0%     -34.9%      -43.3% -75.0%                         Pend
                                                                                                                                       Property under contract to sell
      D5: Central $ 959,000     $ 985,614        35    41 103.2%       31.4%     37.4%     9.4%    12.2%       8.4% -10.3%
                                                                                                                                         that hasn’t closed escrow.
D6: Central North $ 621,500     $ 624,958        30    48 105.9%        -3.6%     -1.0% 57.9%     -22.6%      -20.6% -11.8%
         D7: North $1,310,000   $1,268,733       15    23 105.1%       54.5%     37.8% 36.4%       62.7%      39.0% -42.3%                          Inven
   D8: Northeast $ 684,000      $1,038,727       33    51     99.8%    12.1%     30.8% -10.8%       9.4%      30.1% -52.9%              Number of properties actively
 D9: Central East $ 732,500     $ 895,651        85    48     98.0%    26.8%     34.5% 32.8%        1.7%       3.8% -10.5%             for sale as of the last day of the
                                                                                                                                                    month.
  D10: Southeast $ 347,500      $ 342,167        6     91 106.4%       77.3%     74.6% 200.0%      16.2%      16.9% -25.0%
THE REAL ESTATE REPORT
                          San Francisco

                 Robb Fleischer
                 American Marketing Systems, Inc.
                 2800 Van Ness Avenue
                 San Francisco, CA 94109


Go online to see the full report
with the district by district breakdown:
HTTP://WWW.AMSIRES.COM/STAFF/ROBB


                                           San Francisco Homes: Sales Momentum
(Continued from page 3)
                                             25.0
for sale dropped 15.5% month-over-           20.0
month.                                       15.0
                                             10.0
The number of properties owned by the         5.0
banks fell 21.2% year-over-year. Banks        0.0
now own about 520 properties in San          -5.0 0 FMAMJ JASOND0 FMAMJ JASOND0 FMAMJ JASOND1 FMAMJ JASOND1 FMAMJ JASOND1 FMAMJ JAS
Francisco. At the current rate of sales,    -10.0
                                                  7              8            9             0             1              2
this is about a four weeks supply. Five     -15.0
to six months supply of total inventory     -20.0
signals a balanced market.                  -25.0
                                                  Sales       Pricing                                                © 2012 rereport.com
Data supplied by
http://foreclosureradar.com.

                                           San Francisco Condos/Lofts: Sales Momentum
                                             40.0
                                             30.0
                                             20.0
                                             10.0
                                              0.0
                                                    0 FMAMJ JASOND0 FMAMJ JASOND0 FMAMJ JASOND1 FMAMJ JASOND1 FMAMJ JASOND1 FMAMJ JAS
                                            -10.0
                                                    7             8             9             0             1             2
                                            -20.0
                                            -30.0
                                            -40.0
                                            -50.0
                                                    Sales         Pricing                                                     © 2012 rereport.com


                                  The Real Estate Market Trends Report is published and copyrighted by http://rereport.com.

More Related Content

What's hot

SAR Monthly Statistics Released for June 2011
SAR Monthly Statistics Released for June 2011SAR Monthly Statistics Released for June 2011
SAR Monthly Statistics Released for June 2011Sarasota Real Estate
 
This Month In Real Estate for Canada July 2009
This Month In Real Estate for Canada July 2009This Month In Real Estate for Canada July 2009
This Month In Real Estate for Canada July 2009Keller Williams Careers
 
C Mousing Harket Cnformation Halifax 2010
C  Mousing  Harket  Cnformation  Halifax 2010C  Mousing  Harket  Cnformation  Halifax 2010
C Mousing Harket Cnformation Halifax 2010whildreth
 
Pasadena Homes April09 Sales Report
Pasadena Homes April09 Sales ReportPasadena Homes April09 Sales Report
Pasadena Homes April09 Sales ReportDoug Willis
 
Daily livestock report dec 21 2012
Daily livestock report dec 21 2012Daily livestock report dec 21 2012
Daily livestock report dec 21 2012joseleorcasita
 
Sarasota Market Statistics May 2012
Sarasota Market Statistics May 2012Sarasota Market Statistics May 2012
Sarasota Market Statistics May 2012Sarasota Real Estate
 
Wal Mart Store FinancialOctober 11/08/07
Wal Mart Store FinancialOctober 	11/08/07Wal Mart Store FinancialOctober 	11/08/07
Wal Mart Store FinancialOctober 11/08/07finance1
 
Market watch february 2011
Market watch february 2011Market watch february 2011
Market watch february 2011Jennifer Backus
 

What's hot (13)

June 2014 Report
June 2014 ReportJune 2014 Report
June 2014 Report
 
July 2015 Market Report
July 2015 Market ReportJuly 2015 Market Report
July 2015 Market Report
 
La00001 single family_lafayette
La00001 single family_lafayetteLa00001 single family_lafayette
La00001 single family_lafayette
 
SAR Monthly Statistics Released for June 2011
SAR Monthly Statistics Released for June 2011SAR Monthly Statistics Released for June 2011
SAR Monthly Statistics Released for June 2011
 
Toronto rental market
Toronto rental marketToronto rental market
Toronto rental market
 
This Month In Real Estate for Canada July 2009
This Month In Real Estate for Canada July 2009This Month In Real Estate for Canada July 2009
This Month In Real Estate for Canada July 2009
 
C Mousing Harket Cnformation Halifax 2010
C  Mousing  Harket  Cnformation  Halifax 2010C  Mousing  Harket  Cnformation  Halifax 2010
C Mousing Harket Cnformation Halifax 2010
 
Pasadena Homes April09 Sales Report
Pasadena Homes April09 Sales ReportPasadena Homes April09 Sales Report
Pasadena Homes April09 Sales Report
 
Daily livestock report dec 21 2012
Daily livestock report dec 21 2012Daily livestock report dec 21 2012
Daily livestock report dec 21 2012
 
Sarasota Market Statistics May 2012
Sarasota Market Statistics May 2012Sarasota Market Statistics May 2012
Sarasota Market Statistics May 2012
 
HB Anthology 2011
HB Anthology 2011HB Anthology 2011
HB Anthology 2011
 
Wal Mart Store FinancialOctober 11/08/07
Wal Mart Store FinancialOctober 	11/08/07Wal Mart Store FinancialOctober 	11/08/07
Wal Mart Store FinancialOctober 11/08/07
 
Market watch february 2011
Market watch february 2011Market watch february 2011
Market watch february 2011
 

Viewers also liked

Median Price for Homes at Record High - The Real Estate Report March/April
Median Price for Homes at Record High - The Real Estate Report March/AprilMedian Price for Homes at Record High - The Real Estate Report March/April
Median Price for Homes at Record High - The Real Estate Report March/AprilAMSI, San Francisco
 
Inventory Dominates Market - The Real Estate Report April/Mai
Inventory Dominates Market -  The Real Estate Report April/MaiInventory Dominates Market -  The Real Estate Report April/Mai
Inventory Dominates Market - The Real Estate Report April/MaiAMSI, San Francisco
 
C.A.R’s 2014 Housing Forecast - The Real Estate Report December/January
C.A.R’s 2014 Housing Forecast - The Real Estate Report December/JanuaryC.A.R’s 2014 Housing Forecast - The Real Estate Report December/January
C.A.R’s 2014 Housing Forecast - The Real Estate Report December/JanuaryAMSI, San Francisco
 
Jumbo Loans Cheaper Than Conforming Loans - The Real Estate Report September/...
Jumbo Loans Cheaper Than Conforming Loans - The Real Estate Report September/...Jumbo Loans Cheaper Than Conforming Loans - The Real Estate Report September/...
Jumbo Loans Cheaper Than Conforming Loans - The Real Estate Report September/...AMSI, San Francisco
 
San Francisco Home Sales and Prices Up in 2012 - The Real Estate Report Janua...
San Francisco Home Sales and Prices Up in 2012 - The Real Estate Report Janua...San Francisco Home Sales and Prices Up in 2012 - The Real Estate Report Janua...
San Francisco Home Sales and Prices Up in 2012 - The Real Estate Report Janua...AMSI, San Francisco
 
Prices Up, Home Sales Down - The Real Estate Report February/March
Prices Up, Home Sales Down - The Real Estate Report February/MarchPrices Up, Home Sales Down - The Real Estate Report February/March
Prices Up, Home Sales Down - The Real Estate Report February/MarchAMSI, San Francisco
 
Real Estate Report December/January
Real Estate Report December/JanuaryReal Estate Report December/January
Real Estate Report December/JanuaryAMSI, San Francisco
 
Obtaining a Mortgage to Get More Difficult - The Real Estate Report November/...
Obtaining a Mortgage to Get More Difficult - The Real Estate Report November/...Obtaining a Mortgage to Get More Difficult - The Real Estate Report November/...
Obtaining a Mortgage to Get More Difficult - The Real Estate Report November/...AMSI, San Francisco
 
Quantitative Easing and Mortgage Rates - Real Estate Report November/December
Quantitative Easing and Mortgage Rates - Real Estate Report November/DecemberQuantitative Easing and Mortgage Rates - Real Estate Report November/December
Quantitative Easing and Mortgage Rates - Real Estate Report November/DecemberAMSI, San Francisco
 
Market Takes a Breather - Real Estate Report September/October
Market Takes a Breather - Real Estate Report September/OctoberMarket Takes a Breather - Real Estate Report September/October
Market Takes a Breather - Real Estate Report September/OctoberAMSI, San Francisco
 
Lack of Inventory Plagues Market - Real Estate Report August/September
Lack of Inventory Plagues Market - Real Estate Report August/SeptemberLack of Inventory Plagues Market - Real Estate Report August/September
Lack of Inventory Plagues Market - Real Estate Report August/SeptemberAMSI, San Francisco
 
Spring Surge Continues - The Real Estate Report May/June
Spring Surge Continues - The Real Estate Report May/JuneSpring Surge Continues - The Real Estate Report May/June
Spring Surge Continues - The Real Estate Report May/JuneAMSI, San Francisco
 
Buyers' Fatigue? - The Real Estate Report June/July
Buyers' Fatigue? - The Real Estate Report June/JulyBuyers' Fatigue? - The Real Estate Report June/July
Buyers' Fatigue? - The Real Estate Report June/JulyAMSI, San Francisco
 
Prices Reach All-Time Highs, Again - Real Estate Report July/August
Prices Reach All-Time Highs, Again - Real Estate Report July/AugustPrices Reach All-Time Highs, Again - Real Estate Report July/August
Prices Reach All-Time Highs, Again - Real Estate Report July/AugustAMSI, San Francisco
 
Fotosintesis.ppt
Fotosintesis.pptFotosintesis.ppt
Fotosintesis.pptdwicantik
 

Viewers also liked (15)

Median Price for Homes at Record High - The Real Estate Report March/April
Median Price for Homes at Record High - The Real Estate Report March/AprilMedian Price for Homes at Record High - The Real Estate Report March/April
Median Price for Homes at Record High - The Real Estate Report March/April
 
Inventory Dominates Market - The Real Estate Report April/Mai
Inventory Dominates Market -  The Real Estate Report April/MaiInventory Dominates Market -  The Real Estate Report April/Mai
Inventory Dominates Market - The Real Estate Report April/Mai
 
C.A.R’s 2014 Housing Forecast - The Real Estate Report December/January
C.A.R’s 2014 Housing Forecast - The Real Estate Report December/JanuaryC.A.R’s 2014 Housing Forecast - The Real Estate Report December/January
C.A.R’s 2014 Housing Forecast - The Real Estate Report December/January
 
Jumbo Loans Cheaper Than Conforming Loans - The Real Estate Report September/...
Jumbo Loans Cheaper Than Conforming Loans - The Real Estate Report September/...Jumbo Loans Cheaper Than Conforming Loans - The Real Estate Report September/...
Jumbo Loans Cheaper Than Conforming Loans - The Real Estate Report September/...
 
San Francisco Home Sales and Prices Up in 2012 - The Real Estate Report Janua...
San Francisco Home Sales and Prices Up in 2012 - The Real Estate Report Janua...San Francisco Home Sales and Prices Up in 2012 - The Real Estate Report Janua...
San Francisco Home Sales and Prices Up in 2012 - The Real Estate Report Janua...
 
Prices Up, Home Sales Down - The Real Estate Report February/March
Prices Up, Home Sales Down - The Real Estate Report February/MarchPrices Up, Home Sales Down - The Real Estate Report February/March
Prices Up, Home Sales Down - The Real Estate Report February/March
 
Real Estate Report December/January
Real Estate Report December/JanuaryReal Estate Report December/January
Real Estate Report December/January
 
Obtaining a Mortgage to Get More Difficult - The Real Estate Report November/...
Obtaining a Mortgage to Get More Difficult - The Real Estate Report November/...Obtaining a Mortgage to Get More Difficult - The Real Estate Report November/...
Obtaining a Mortgage to Get More Difficult - The Real Estate Report November/...
 
Quantitative Easing and Mortgage Rates - Real Estate Report November/December
Quantitative Easing and Mortgage Rates - Real Estate Report November/DecemberQuantitative Easing and Mortgage Rates - Real Estate Report November/December
Quantitative Easing and Mortgage Rates - Real Estate Report November/December
 
Market Takes a Breather - Real Estate Report September/October
Market Takes a Breather - Real Estate Report September/OctoberMarket Takes a Breather - Real Estate Report September/October
Market Takes a Breather - Real Estate Report September/October
 
Lack of Inventory Plagues Market - Real Estate Report August/September
Lack of Inventory Plagues Market - Real Estate Report August/SeptemberLack of Inventory Plagues Market - Real Estate Report August/September
Lack of Inventory Plagues Market - Real Estate Report August/September
 
Spring Surge Continues - The Real Estate Report May/June
Spring Surge Continues - The Real Estate Report May/JuneSpring Surge Continues - The Real Estate Report May/June
Spring Surge Continues - The Real Estate Report May/June
 
Buyers' Fatigue? - The Real Estate Report June/July
Buyers' Fatigue? - The Real Estate Report June/JulyBuyers' Fatigue? - The Real Estate Report June/July
Buyers' Fatigue? - The Real Estate Report June/July
 
Prices Reach All-Time Highs, Again - Real Estate Report July/August
Prices Reach All-Time Highs, Again - Real Estate Report July/AugustPrices Reach All-Time Highs, Again - Real Estate Report July/August
Prices Reach All-Time Highs, Again - Real Estate Report July/August
 
Fotosintesis.ppt
Fotosintesis.pptFotosintesis.ppt
Fotosintesis.ppt
 

Similar to Price Surge in the Making? and Mortgage Rate Outlook - The Real Estate Report October/November

October_2009_San_Diego_Housing_Research[1]
October_2009_San_Diego_Housing_Research[1]October_2009_San_Diego_Housing_Research[1]
October_2009_San_Diego_Housing_Research[1]Schahrzad Berkland
 
Uncw 2012 economic conference final draft
Uncw 2012 economic conference   final draftUncw 2012 economic conference   final draft
Uncw 2012 economic conference final draftintracoastal
 
Greater Boston Real Estate Market Data, September 2012
Greater Boston Real Estate Market Data, September 2012Greater Boston Real Estate Market Data, September 2012
Greater Boston Real Estate Market Data, September 2012Unit Realty Group
 
Jan - June 2012 Newsletter
Jan - June 2012 NewsletterJan - June 2012 Newsletter
Jan - June 2012 NewsletterJohn D Parce
 
Sales climb in February 2012; pending sales rise to 11-month high
Sales climb in February 2012; pending sales rise to 11-month highSales climb in February 2012; pending sales rise to 11-month high
Sales climb in February 2012; pending sales rise to 11-month highSarasota Real Estate
 
Annie Williams Market Trends July-Aug 2014
Annie Williams Market Trends July-Aug 2014Annie Williams Market Trends July-Aug 2014
Annie Williams Market Trends July-Aug 2014Jon Weaver
 
Annie Williams Real Estate Report - Jan 2016
Annie Williams Real Estate Report - Jan 2016Annie Williams Real Estate Report - Jan 2016
Annie Williams Real Estate Report - Jan 2016Jon Weaver
 

Similar to Price Surge in the Making? and Mortgage Rate Outlook - The Real Estate Report October/November (20)

May 2014 Realtor Report
May 2014 Realtor ReportMay 2014 Realtor Report
May 2014 Realtor Report
 
San Mateo County Real Estate Price Report
San Mateo County Real Estate Price ReportSan Mateo County Real Estate Price Report
San Mateo County Real Estate Price Report
 
San Mateo County Real Estate Price Report
San Mateo County Real Estate Price ReportSan Mateo County Real Estate Price Report
San Mateo County Real Estate Price Report
 
March 2015 Realtor Report
March 2015 Realtor ReportMarch 2015 Realtor Report
March 2015 Realtor Report
 
October_2009_San_Diego_Housing_Research[1]
October_2009_San_Diego_Housing_Research[1]October_2009_San_Diego_Housing_Research[1]
October_2009_San_Diego_Housing_Research[1]
 
September 2018 Realtor Report
September 2018 Realtor ReportSeptember 2018 Realtor Report
September 2018 Realtor Report
 
Uncw 2012 economic conference final draft
Uncw 2012 economic conference   final draftUncw 2012 economic conference   final draft
Uncw 2012 economic conference final draft
 
Sarasota Market Stats feb2012
Sarasota Market Stats feb2012Sarasota Market Stats feb2012
Sarasota Market Stats feb2012
 
Greater Boston Real Estate Market Data, September 2012
Greater Boston Real Estate Market Data, September 2012Greater Boston Real Estate Market Data, September 2012
Greater Boston Real Estate Market Data, September 2012
 
Southwest California Realtor Report for September 2019
Southwest California Realtor Report for September 2019Southwest California Realtor Report for September 2019
Southwest California Realtor Report for September 2019
 
Sarasota Market Stats December
Sarasota Market Stats DecemberSarasota Market Stats December
Sarasota Market Stats December
 
Jan - June 2012 Newsletter
Jan - June 2012 NewsletterJan - June 2012 Newsletter
Jan - June 2012 Newsletter
 
Sales climb in February 2012; pending sales rise to 11-month high
Sales climb in February 2012; pending sales rise to 11-month highSales climb in February 2012; pending sales rise to 11-month high
Sales climb in February 2012; pending sales rise to 11-month high
 
Sarasota Market stats for March
Sarasota Market stats for MarchSarasota Market stats for March
Sarasota Market stats for March
 
Sr march2012 stats12041822817_2_3
Sr march2012 stats12041822817_2_3Sr march2012 stats12041822817_2_3
Sr march2012 stats12041822817_2_3
 
acecourseinvestorsession1
acecourseinvestorsession1acecourseinvestorsession1
acecourseinvestorsession1
 
June2012 stats.3 8
June2012 stats.3 8June2012 stats.3 8
June2012 stats.3 8
 
Annie Williams Market Trends July-Aug 2014
Annie Williams Market Trends July-Aug 2014Annie Williams Market Trends July-Aug 2014
Annie Williams Market Trends July-Aug 2014
 
Realtor Report for July 2020
Realtor Report for July 2020Realtor Report for July 2020
Realtor Report for July 2020
 
Annie Williams Real Estate Report - Jan 2016
Annie Williams Real Estate Report - Jan 2016Annie Williams Real Estate Report - Jan 2016
Annie Williams Real Estate Report - Jan 2016
 

Recently uploaded

Provident Botanico Whitefield E- Brochure.pdf
Provident Botanico Whitefield E- Brochure.pdfProvident Botanico Whitefield E- Brochure.pdf
Provident Botanico Whitefield E- Brochure.pdffaheemali990101
 
Future Trends The Outlook for Redevelopment Builders in Pune (PPT).pdf
Future Trends The Outlook for Redevelopment Builders in Pune (PPT).pdfFuture Trends The Outlook for Redevelopment Builders in Pune (PPT).pdf
Future Trends The Outlook for Redevelopment Builders in Pune (PPT).pdfAditiAlishetty
 
Seller Seminar Presentation With A Realtor
Seller Seminar  Presentation With A RealtorSeller Seminar  Presentation With A Realtor
Seller Seminar Presentation With A Realtorcarlsbadheather
 
Triaa Housing Lohegaon Pune E-Brochure.pdf
Triaa Housing Lohegaon Pune  E-Brochure.pdfTriaa Housing Lohegaon Pune  E-Brochure.pdf
Triaa Housing Lohegaon Pune E-Brochure.pdfManishSaxena95
 
Listing Turkey - Nefes Koru Gokturk IStanbul
Listing Turkey - Nefes Koru Gokturk IStanbulListing Turkey - Nefes Koru Gokturk IStanbul
Listing Turkey - Nefes Koru Gokturk IStanbulListing Turkey
 
Tribeca The Ark Voyage NIBM, Pune E-Brochure.pdf
Tribeca The Ark Voyage NIBM, Pune  E-Brochure.pdfTribeca The Ark Voyage NIBM, Pune  E-Brochure.pdf
Tribeca The Ark Voyage NIBM, Pune E-Brochure.pdfManishSaxena95
 
Listing Turkey - Resim Modern Catalog Istanbul
Listing Turkey - Resim Modern Catalog IstanbulListing Turkey - Resim Modern Catalog Istanbul
Listing Turkey - Resim Modern Catalog IstanbulListing Turkey
 
LCAR Unit 20 - Appraising Real Estate - 14th Edition Revised
LCAR Unit 20 - Appraising Real Estate - 14th Edition RevisedLCAR Unit 20 - Appraising Real Estate - 14th Edition Revised
LCAR Unit 20 - Appraising Real Estate - 14th Edition RevisedTom Blefko
 
Shapoorji Pallonji Parkwest Sequoia Tower Binnypet, Central Bangalore E - Bro...
Shapoorji Pallonji Parkwest Sequoia Tower Binnypet, Central Bangalore E - Bro...Shapoorji Pallonji Parkwest Sequoia Tower Binnypet, Central Bangalore E - Bro...
Shapoorji Pallonji Parkwest Sequoia Tower Binnypet, Central Bangalore E - Bro...faheemali990101
 
What is Affordable Housing? Bristol Civic Society April 2024
What is Affordable Housing? Bristol Civic Society April 2024What is Affordable Housing? Bristol Civic Society April 2024
What is Affordable Housing? Bristol Civic Society April 2024Paul Smith
 
NIDO by Wanson Group Floor Plan Set 2024
NIDO by Wanson Group Floor Plan Set 2024NIDO by Wanson Group Floor Plan Set 2024
NIDO by Wanson Group Floor Plan Set 2024VickyAulakh1
 
LCAR Unit 21 - Closing the Real Estate Transaction - 14th Edition Revised
LCAR Unit 21 - Closing the Real Estate Transaction - 14th Edition RevisedLCAR Unit 21 - Closing the Real Estate Transaction - 14th Edition Revised
LCAR Unit 21 - Closing the Real Estate Transaction - 14th Edition RevisedTom Blefko
 
Managing Uncertainty: Newman George Leech's Real Estate Finance Strategy
Managing Uncertainty: Newman George Leech's Real Estate Finance StrategyManaging Uncertainty: Newman George Leech's Real Estate Finance Strategy
Managing Uncertainty: Newman George Leech's Real Estate Finance StrategyNewman George Leech
 
SVN Live 4.8.24 Weekly Property Broadcast
SVN Live 4.8.24 Weekly Property BroadcastSVN Live 4.8.24 Weekly Property Broadcast
SVN Live 4.8.24 Weekly Property BroadcastSVN International Corp.
 
LCAR RE Practice - Real Estate Math Concepts
LCAR RE Practice - Real Estate Math ConceptsLCAR RE Practice - Real Estate Math Concepts
LCAR RE Practice - Real Estate Math ConceptsTom Blefko
 
K Raheja Amaltis Sion Mumbai Brochure.pdf
K Raheja Amaltis Sion Mumbai  Brochure.pdfK Raheja Amaltis Sion Mumbai  Brochure.pdf
K Raheja Amaltis Sion Mumbai Brochure.pdfBabyrudram
 
Dubai Real Estate vs Other Global Markets-a-Comparative-Analysis
Dubai Real Estate vs Other Global Markets-a-Comparative-AnalysisDubai Real Estate vs Other Global Markets-a-Comparative-Analysis
Dubai Real Estate vs Other Global Markets-a-Comparative-AnalysisHomeStation1
 
Goyal Ganga One Boat Club Pune Brochure.pdf
Goyal Ganga One Boat Club Pune Brochure.pdfGoyal Ganga One Boat Club Pune Brochure.pdf
Goyal Ganga One Boat Club Pune Brochure.pdfabbu831446
 
Maha Mauka Squarefeet Brochure |Maha Mauka Squarefeet PDF Brochure|
Maha Mauka Squarefeet Brochure |Maha Mauka Squarefeet PDF Brochure|Maha Mauka Squarefeet Brochure |Maha Mauka Squarefeet PDF Brochure|
Maha Mauka Squarefeet Brochure |Maha Mauka Squarefeet PDF Brochure|AkshayJoshi575980
 
Honer Richmont Hyderabad E brochure - A Life With A View
Honer Richmont Hyderabad E brochure - A Life With A ViewHoner Richmont Hyderabad E brochure - A Life With A View
Honer Richmont Hyderabad E brochure - A Life With A ViewAhanundefined
 

Recently uploaded (20)

Provident Botanico Whitefield E- Brochure.pdf
Provident Botanico Whitefield E- Brochure.pdfProvident Botanico Whitefield E- Brochure.pdf
Provident Botanico Whitefield E- Brochure.pdf
 
Future Trends The Outlook for Redevelopment Builders in Pune (PPT).pdf
Future Trends The Outlook for Redevelopment Builders in Pune (PPT).pdfFuture Trends The Outlook for Redevelopment Builders in Pune (PPT).pdf
Future Trends The Outlook for Redevelopment Builders in Pune (PPT).pdf
 
Seller Seminar Presentation With A Realtor
Seller Seminar  Presentation With A RealtorSeller Seminar  Presentation With A Realtor
Seller Seminar Presentation With A Realtor
 
Triaa Housing Lohegaon Pune E-Brochure.pdf
Triaa Housing Lohegaon Pune  E-Brochure.pdfTriaa Housing Lohegaon Pune  E-Brochure.pdf
Triaa Housing Lohegaon Pune E-Brochure.pdf
 
Listing Turkey - Nefes Koru Gokturk IStanbul
Listing Turkey - Nefes Koru Gokturk IStanbulListing Turkey - Nefes Koru Gokturk IStanbul
Listing Turkey - Nefes Koru Gokturk IStanbul
 
Tribeca The Ark Voyage NIBM, Pune E-Brochure.pdf
Tribeca The Ark Voyage NIBM, Pune  E-Brochure.pdfTribeca The Ark Voyage NIBM, Pune  E-Brochure.pdf
Tribeca The Ark Voyage NIBM, Pune E-Brochure.pdf
 
Listing Turkey - Resim Modern Catalog Istanbul
Listing Turkey - Resim Modern Catalog IstanbulListing Turkey - Resim Modern Catalog Istanbul
Listing Turkey - Resim Modern Catalog Istanbul
 
LCAR Unit 20 - Appraising Real Estate - 14th Edition Revised
LCAR Unit 20 - Appraising Real Estate - 14th Edition RevisedLCAR Unit 20 - Appraising Real Estate - 14th Edition Revised
LCAR Unit 20 - Appraising Real Estate - 14th Edition Revised
 
Shapoorji Pallonji Parkwest Sequoia Tower Binnypet, Central Bangalore E - Bro...
Shapoorji Pallonji Parkwest Sequoia Tower Binnypet, Central Bangalore E - Bro...Shapoorji Pallonji Parkwest Sequoia Tower Binnypet, Central Bangalore E - Bro...
Shapoorji Pallonji Parkwest Sequoia Tower Binnypet, Central Bangalore E - Bro...
 
What is Affordable Housing? Bristol Civic Society April 2024
What is Affordable Housing? Bristol Civic Society April 2024What is Affordable Housing? Bristol Civic Society April 2024
What is Affordable Housing? Bristol Civic Society April 2024
 
NIDO by Wanson Group Floor Plan Set 2024
NIDO by Wanson Group Floor Plan Set 2024NIDO by Wanson Group Floor Plan Set 2024
NIDO by Wanson Group Floor Plan Set 2024
 
LCAR Unit 21 - Closing the Real Estate Transaction - 14th Edition Revised
LCAR Unit 21 - Closing the Real Estate Transaction - 14th Edition RevisedLCAR Unit 21 - Closing the Real Estate Transaction - 14th Edition Revised
LCAR Unit 21 - Closing the Real Estate Transaction - 14th Edition Revised
 
Managing Uncertainty: Newman George Leech's Real Estate Finance Strategy
Managing Uncertainty: Newman George Leech's Real Estate Finance StrategyManaging Uncertainty: Newman George Leech's Real Estate Finance Strategy
Managing Uncertainty: Newman George Leech's Real Estate Finance Strategy
 
SVN Live 4.8.24 Weekly Property Broadcast
SVN Live 4.8.24 Weekly Property BroadcastSVN Live 4.8.24 Weekly Property Broadcast
SVN Live 4.8.24 Weekly Property Broadcast
 
LCAR RE Practice - Real Estate Math Concepts
LCAR RE Practice - Real Estate Math ConceptsLCAR RE Practice - Real Estate Math Concepts
LCAR RE Practice - Real Estate Math Concepts
 
K Raheja Amaltis Sion Mumbai Brochure.pdf
K Raheja Amaltis Sion Mumbai  Brochure.pdfK Raheja Amaltis Sion Mumbai  Brochure.pdf
K Raheja Amaltis Sion Mumbai Brochure.pdf
 
Dubai Real Estate vs Other Global Markets-a-Comparative-Analysis
Dubai Real Estate vs Other Global Markets-a-Comparative-AnalysisDubai Real Estate vs Other Global Markets-a-Comparative-Analysis
Dubai Real Estate vs Other Global Markets-a-Comparative-Analysis
 
Goyal Ganga One Boat Club Pune Brochure.pdf
Goyal Ganga One Boat Club Pune Brochure.pdfGoyal Ganga One Boat Club Pune Brochure.pdf
Goyal Ganga One Boat Club Pune Brochure.pdf
 
Maha Mauka Squarefeet Brochure |Maha Mauka Squarefeet PDF Brochure|
Maha Mauka Squarefeet Brochure |Maha Mauka Squarefeet PDF Brochure|Maha Mauka Squarefeet Brochure |Maha Mauka Squarefeet PDF Brochure|
Maha Mauka Squarefeet Brochure |Maha Mauka Squarefeet PDF Brochure|
 
Honer Richmont Hyderabad E brochure - A Life With A View
Honer Richmont Hyderabad E brochure - A Life With A ViewHoner Richmont Hyderabad E brochure - A Life With A View
Honer Richmont Hyderabad E brochure - A Life With A View
 

Price Surge in the Making? and Mortgage Rate Outlook - The Real Estate Report October/November

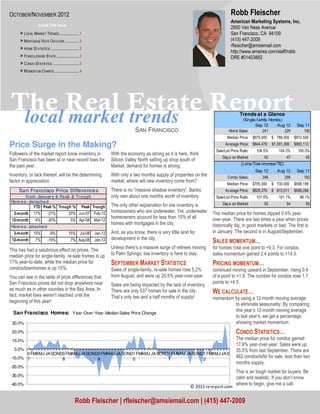
  • 1. OCTOBER/NOVEMBER 2012 Robb Fleischer American Marketing Systems, Inc. Inside This Issue 2800 Van Ness Avenue > LOCAL MARKET TRENDS ..................... 1 San Francisco, CA 94109 > MORTGAGE RATE OUTLOOK ............... 2 (415) 447-2009 rfleischer@amsiemail.com > HOME STATISTICS .............................. 2 http://www.amsires.com/staff/robb > FORECLOSURE STATS ........................ 3 DRE #01403882 > CONDO STATISTICS ............................ 3 > MOMENTUM CHARTS .......................... 4 The Real Estate Report local market trends Trends at a Glance (Single-family Homes) Sep 12 Aug 12 Sep 11 SAN FRANCISCO Home Sales: 241 229 192 Median Price: $670,000 $ 768,000 $672,500 Price Surge in the Making? Av erage Price: $844,479 $1,001,306 $883,112 Sale/List Price Ratio: 104.5% 104.3% 100.3% Followers of the market report know inventory in With the economy as strong as it is here, think Day s on Market: 50 47 62 San Francisco has been at or near record lows for Silicon Valley North setting up shop south of (Lofts/Tow nhomes/TIC) the past year. Market, demand for homes is strong. Sep 12 Aug 12 Sep 11 Inventory, or lack thereof, will be the determining With only a two months supply of properties on the Condo Sales: 248 298 183 factor in appreciation. market, where will new inventory come from? Median Price: $705,000 $ 730,000 $598,199 San Francisco Price Differences There is no “massive shadow inventory”. Banks Av erage Price: $828,376 $ 813,011 $686,094 from January & Peak & Trough only own about one months worth of inventory. Sale/List Price Ratio: 101.0% 101.1% 98.1% Hom es: detached Day s on Market: 50 54 83 YTD Peak % Trough % Peak Trough The only other explanation for low inventory is 3-month 17% -21% 20% Jun-07 Feb-12 homeowners who are underwater. Yet, underwater The median price for homes dipped 0.4% year- homeowners account for less than 10% of all over-year. There are two times a year when prices 12-month 4% -20% 5% Apr-08 Mar-12 homes with mortgages in the city. historically dip, in good markets or bad. The first is Hom es: attached 3-month 15% -9% 15% Jul-08 Jan-12 And, as you know, there is very little land for in January. The second is in August/September. development in the city. 12-month 7% -10% 7% Aug-08 Jan-12 SALES MOMENTUM… This has had a salubrious effect on prices. The Unless there’s a massive surge of retirees moving for homes rose one point to +9.3. For condos, median price for single-family, re-sale homes is up to Palm Springs, low inventory is here to stay. sales momentum gained 2.4 points to +14.3. 17% year-to-date, while the median price for SEPTEMBER MARKET STATISTICS PRICING MOMENTUM… condos/townhomes is up 15%. Sales of single-family, re-sale homes rose 5.2% continued moving upward in September, rising 0.4 You can see in the table of price differences that from August, and were up 25.5% year-over-year. of a point to +1.9. The number for condos rose 1.7 San Francisco prices did not drop anywhere near points to +4.5. Sales are being impacted by the lack of inventory. as much as in other counties in the Bay Area. In fact, market lows weren’t reached until the There are only 537 homes for sale in the city. WE CALCULATE… That’s only two and a half months of supply! momentum by using a 12-month moving average beginning of this year! to eliminate seasonality. By comparing this year’s 12-month moving average San Francisco Homes: Year-Over-Year Median Sales Price Change to last year’s, we get a percentage 30.0% showing market momentum. 20.0% CONDO STATISTICS… 10.0% The median price for condos gained 17.9% year-over-year. Sales were up 0.0% 35.5% from last September. There are 0 FMAMJ JA SOND0 FMAMJ JA SOND0 FMAMJ JA SOND1 FMAMJ JA SOND1 FMAMJ JA SOND1 FMAMJ JA S -10.0% 7 8 9 0 1 2 462 condos/lofts for sale, less than two months supply. -20.0% This is an tough market for buyers. Be -30.0% calm and realistic. If you don’t know -40.0% where to begin, give me a call. © 2012 rereport.com Robb Fleischer | rfleischer@amsiemail.com | (415) 447-2009
  • 2. The Real Estate Report Mortgage Rate Outlook 30-Year Fixed Mortgage Rates Oct 5, 2012 -- Even though some of the economic news climate... which in turn might temper growth. What to was a little warmer this week, mortgage rates contin- cheer for? Broad-based economic gains which take 07-12 ued their downward drive. However, the decline this the Fed out of the picture, letting markets again dis- 04-12 week was more muted than last week's, and with the cover the true price of mortgages? Or to root for in- 01-12 cumulative benefit of the Fed's "QEternity" program terest rates to remain at artificially low levels, so that 10-11 of purchasing Mortgage-Backed Securities closing in more homeowners can profitably refinance, or to see 07-11 04-11 on a quarter-percentage point, we may not have all home prices reflated though the inducement of af- 01-11 that much room for rates yet to fall at the moment. fordability-driven sales? 10-10 07-10 HSH.com's broad-market mortgage tracker found the At some point, and for some time thereafter, we are 04-10 overall average rate for 30-year fixed-rate mortgages likely to see both. How long such conditions -- a ris- 01-10 10-09 declined by just two basis points (0.02%) to 3.68%, a ing economy with rock-bottom rates -- might last is 07-09 new record low, while the FRMI's 15-year companion anyone's guess at this point. The Fed has pledged to 04-09 shed three basis points to land at a new record low of keep its foot on the gas even after the economy gets 01-09 10-08 an even 3%. FHA-backed 30-year FRMs downshifted more fully underway, but that strikes us as a nervous 07-08 by just a single basis basis point, as the most viable time in the markets, indeed. 04-08 option for credit- or equity-impaired borrowers trickled 01-08 It would appear that the decline in rates has sof- to a new low of 3.28%. Finally, the overall average 10-07 tened, at least for the moment. When the Fed an- 07-07 rate for 5/1 Hybrid ARMs held fast at 2.70% for a nounced its program, we reckoned it might have a 04-07 third consecutive week, remaining at a record low. 01-07 value of a quarter-percentage point on rates given 10-06 The Fed's program of manipulating mortgage prices current conditions, and we'll stand by that assess- 07-06 is a two-edged sword, or at least a Catch-22. The ment for at least the moment. That being the case, 04-06 01-06 Fed wants to see more economic growth, so it push- and since much of that expected decline is now in 3.0% 4.0% 5.0% 6.0% 7.0% 8.0% es mortgage rates down to help foster growth. If the place, we'll call for rates to be about unchanged next economy is improving or does start to improve, the week. Fed will need to do less to achieve its goals, and mortgage rates would tend to rise with the improving San Francisco Homes: Sold Prices & Unit Sales The chart above shows the Na- (3-month moving average — $000's) tional monthly average for 30- year fixed rate mortgages as $1,500 300 compiled by HSH.com. The av- $1,300 250 erage includes mortgages of all sizes, including conforming, $1,100 200 "expanded conforming," and $900 150 jumbo. $700 100 $500 50 $300 0 0 FMAMJ JASOND0 FMAMJ JASOND0 FMAMJ JASOND1 FMAMJ JASOND1 FMAMJ JASOND1 FMAMJ JAS 7 8 9 0 1 2 Ave Med Units © 2012 rereport.com September Sales Statistics (Single-family Homes) Prices Unit Change from last yearChange from last m onth Median Average Sales DOM SP/LP Median Average Sales Median Average Sales San Francisco $ 670,000 $ 844,479 241 50 104.5% -0.4% -4.4% 25.5% -12.8% -15.7% 5.2% D1: Northw est $1,165,000 $1,386,682 11 42 102.9% 19.5% 10.5% -31.3% 8.4% -0.6% -35.3% D2: Central West $ 855,000 $ 851,011 19 35 105.8% 24.8% 25.1% -48.6% 14.2% 7.4% -48.6% D3: Southw est $ 635,000 $ 622,325 15 33 108.6% 33.7% 14.7% 15.4% 22.6% 7.7% -21.1% D4: Tw in Peaks $ 870,000 $1,035,659 22 29 107.4% 1.8% 3.3% 0.0% -20.5% -11.8% -15.4% D5: Central $1,390,000 $1,444,638 24 26 110.5% 3.0% 2.0% 4.3% -1.8% -17.2% -29.4% D6: Central North $1,827,500 $1,827,500 2 52 93.8% n/a n/a n/a 31.0% 32.1% -33.3% D7: North $2,550,000 $3,958,333 3 11 121.9% 4.1% 21.0% -40.0% -40.8% -6.4% -25.0% D8: Northeast $1,765,000 $2,274,267 3 83 74.7% -49.4% -34.8% 50.0% 87.6% 141.7% 200.0% D9: Central East $ 829,000 $ 876,000 15 43 104.7% 21.9% 11.5% -21.1% 5.6% 10.2% -50.0% Page 2 D10: Southeast $ 490,000 $ 496,613 55 61 105.3% 8.6% 12.1% 0.0% -5.0% -2.3% -3.5%
  • 3. San Francisco Condos/Lofts: Year-Over-Year Median Sales Price Change 30.0% 20.0% 10.0% 0.0% 0 FMAMJ JA SOND0 FMAMJ JA SOND0 FMAMJ JA SOND1 FMAMJ JA SOND1 FMAMJ JA SOND1 FMAMJ JA S -10.0% 7 8 9 0 1 2 -20.0% -30.0% © 2011 rereport.com FORECLOSURE STATISTICS In San Francisco, notices of default, the first step in the investor, bids more than the bank's opening bid, the foreclosure process, plunged 71% in August from the property will be sold to the third party; if not, it will go year before. They were down 50% from July. back to the bank and become part of that bank's REO inventory. Notices of sale, which set the date and time of an auc- tion, and serve as the homeowner's final notice before In August, cancellations were off 10.1% from July. sale, also took a nose-dive in August: down 76% year- Year-over-year, cancellations were down 16.8%. over-year, and off 61.1% from July. Properties going back-to-bank jumped 21.1% from July, After the filing of a Notice of Trustee Sale, there are but were down 57.4% year-over-year. only three possible outcomes. First, the sale can be The total number of properties that have had a notice of cancelled for reasons that include a successful loan default filed decreased by 54.2% compared to last year. modification or short sale, a filing error, or a legal re- They were also down 24.2% from July. quirement to re-file the notice after extended postpone- ments, like bankruptcy. The total number of properties scheduled for sale de- clined by 30.8% year-over-year. Properties scheduled Alternatively, if the property is taken to sale, the bank (Continued on page 4) will place the opening bid. If a third party, typically an San Francisco Condos: Sold Prices & Unit Sales (3-month moving average — $000's) $1,000 350 Table Definitions $900 300 _______________ $800 250 $700 200 Median Price The price at which 50% of pric- $600 150 es were higher and 50%were $500 100 lower. $400 50 $300 0 Average Price 0 FMAMJ JASOND0 FMAMJ JASOND0 FMAMJ JASOND1 FMAMJ JASOND1 FMAMJ JASOND1 FMAMJ JAS Add all prices and divide by the 7 8 9 0 1 2 number of sales. Ave Med Units © 2012 rereport.com SP/LP September Sales Statistics Sales price to list price ratio or the price paid for the property (Condos/TICs/Co-ops/Lofts) divided by the asking price. Prices Unit Change from last yearChange from last m onth Median Average Sales DOM SP/LP Median Average Sales Median Average Sales DOI San Francisco $ 705,000 $ 828,376 248 50 101.0% 17.9% 20.7% 35.5% -3.4% 1.9% -16.8% Days of Inventory, or how many days it would take to sell all the D1: Northw est $ 697,000 $ 764,750 10 82 101.4% 30.3% 29.4% 11.1% -10.4% -2.3% -16.7% property for sale at the current D2: Central West $ 783,000 $ 959,333 3 67 99.0% 37.4% 68.3% 200.0% 5.8% 32.6% 0.0% rate of sales. D3: Southw est $ 325,000 $ 322,000 4 96 108.1% 18.6% 15.6% -33.3% 3.0% 1.7% -33.3% D4: Tw in Peaks $ 299,000 $ 299,000 1 85 100.0% 8.0% 8.0% -50.0% -34.9% -43.3% -75.0% Pend Property under contract to sell D5: Central $ 959,000 $ 985,614 35 41 103.2% 31.4% 37.4% 9.4% 12.2% 8.4% -10.3% that hasn’t closed escrow. D6: Central North $ 621,500 $ 624,958 30 48 105.9% -3.6% -1.0% 57.9% -22.6% -20.6% -11.8% D7: North $1,310,000 $1,268,733 15 23 105.1% 54.5% 37.8% 36.4% 62.7% 39.0% -42.3% Inven D8: Northeast $ 684,000 $1,038,727 33 51 99.8% 12.1% 30.8% -10.8% 9.4% 30.1% -52.9% Number of properties actively D9: Central East $ 732,500 $ 895,651 85 48 98.0% 26.8% 34.5% 32.8% 1.7% 3.8% -10.5% for sale as of the last day of the month. D10: Southeast $ 347,500 $ 342,167 6 91 106.4% 77.3% 74.6% 200.0% 16.2% 16.9% -25.0%
  • 4. THE REAL ESTATE REPORT San Francisco Robb Fleischer American Marketing Systems, Inc. 2800 Van Ness Avenue San Francisco, CA 94109 Go online to see the full report with the district by district breakdown: HTTP://WWW.AMSIRES.COM/STAFF/ROBB San Francisco Homes: Sales Momentum (Continued from page 3) 25.0 for sale dropped 15.5% month-over- 20.0 month. 15.0 10.0 The number of properties owned by the 5.0 banks fell 21.2% year-over-year. Banks 0.0 now own about 520 properties in San -5.0 0 FMAMJ JASOND0 FMAMJ JASOND0 FMAMJ JASOND1 FMAMJ JASOND1 FMAMJ JASOND1 FMAMJ JAS Francisco. At the current rate of sales, -10.0 7 8 9 0 1 2 this is about a four weeks supply. Five -15.0 to six months supply of total inventory -20.0 signals a balanced market. -25.0 Sales Pricing © 2012 rereport.com Data supplied by http://foreclosureradar.com. San Francisco Condos/Lofts: Sales Momentum 40.0 30.0 20.0 10.0 0.0 0 FMAMJ JASOND0 FMAMJ JASOND0 FMAMJ JASOND1 FMAMJ JASOND1 FMAMJ JASOND1 FMAMJ JAS -10.0 7 8 9 0 1 2 -20.0 -30.0 -40.0 -50.0 Sales Pricing © 2012 rereport.com The Real Estate Market Trends Report is published and copyrighted by http://rereport.com.