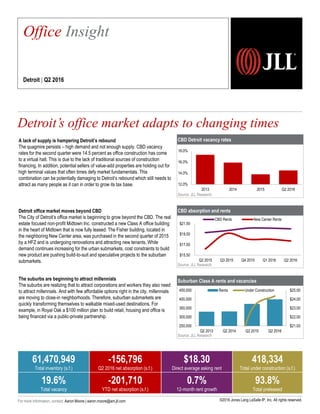
More Related Content Similar to JLL Detroit Office Insight & Statistics – Q2 2016 (17) More from Aaron Moore (9) 1. CBD Detroit vacancy rates
Source: JLL Research
CBD absorption and rents
Source: JLL Research
Suburban Class A rents and vacancies
Source: JLL Research
Detroit’s office market adapts to changing times
2,257
Office Insight
Detroit | Q2 2016
61,470,949
Total inventory (s.f.)
-156,796
Q2 2016 net absorption (s.f.)
$18.30
Direct average asking rent
418,334
Total under construction (s.f.)
19.6%
Total vacancy
-201,710
YTD net absorption (s.f.)
0.7%
12-month rent growth
93.8%
Total preleased
A lack of supply is hampering Detroit’s rebound
The quagmire persists – high demand and not enough supply. CBD vacancy
rates for the second quarter were 14.5 percent as office construction has come
to a virtual halt. This is due to the lack of traditional sources of construction
financing. In addition, potential sellers of value-add properties are holding out for
high terminal values that often times defy market fundamentals. This
combination can be potentially damaging to Detroit’s rebound which still needs to
attract as many people as it can in order to grow its tax base.
Detroit office market moves beyond CBD
The City of Detroit’s office market is beginning to grow beyond the CBD. The real
estate focused non-profit Midtown Inc. constructed a new Class A office building
in the heart of Midtown that is now fully leased. The Fisher building, located in
the neighboring New Center area, was purchased in the second quarter of 2015
by a HFZ and is undergoing renovations and attracting new tenants. While
demand continues increasing for the urban submarkets, cost constraints to build
new product are pushing build-to-suit and speculative projects to the suburban
submarkets.
The suburbs are beginning to attract millennials
The suburbs are realizing that to attract corporations and workers they also need
to attract millennials. And with few affordable options right in the city, millennials
are moving to close-in neighborhoods. Therefore, suburban submarkets are
quickly transforming themselves to walkable mixed-used destinations. For
example, in Royal Oak a $100 million plan to build retail, housing and office is
being financed via a public-private partnership.
12.0%
14.0%
16.0%
18.0%
Q2 2016201520142013
$15.50
$17.50
$19.50
$21.50
Q2 2015 Q3 2015 Q4 2015 Q1 2016 Q2 2016
CBD Rents New Center Rents
$21.00
$22.00
$23.00
$24.00
$25.00
250,000
300,000
350,000
400,000
450,000
Q2 2013 Q2 2014 Q2 2015 Q2 2016
Rents Under Construction
For more information, contact: Aaron Moore | aaron.moore@am.jll.com ©2016 Jones Lang LaSalle IP, Inc. All rights reserved.
2. Current conditions – submarket Historical leasing activity (s.f.)
Source: JLL Research Source: JLL Research
Total net absorption (s.f.)
Source: JLL Research
Total vacancy rate (%)
Source: JLL Research
Direct average asking rent ($ p.s.f.)
Source: JLL Research
-1,304,860
-476,545
-1,953,820
-1,767,490
1,277,568
1,510,536
176,382
1,288,053
872,323
-201,710
-2,500,000
-1,000,000
500,000
2,000,000
2007 2008 2009 2010 2011 2012 2013 2014 2015 YTD 2016
$20.75
$19.73
$19.31
$19.10
$18.56
$18.15
$17.76
$17.99
$18.41 $18.32
$17.00
$18.50
$20.00
$21.50
2007 2008 2009 2010 2011 2012 2013 2014 2015 Q2 2016
25.9% 26.7%
30.0%
32.9%
30.8%
28.3% 28.0%
25.3%
19.0% 19.6%
15.0%
25.0%
35.0%
2007 2008 2009 2010 2011 2012 2013 2014 2015 Q2 2016
Northern I-275,
Washtenaw
Landlordleverage
Tenantleverage
Peaking
market
Falling
market
Bottoming
market
Rising
market
CBD
Downriver,
Dearborn
5,000,000
5,300,000 5,100,000
3,300,000
989,081
0
2,000,000
4,000,000
6,000,000
2012 2013 2014 2015 YTD 2016
Southfield, Troy, Macomb,
Farmington Hills
©2016 Jones Lang LaSalle IP, Inc. All rights reserved.For more information, contact: Aaron Moore | aaron.moore@am.jll.com
Royal Oak
Southern I-275
North Oakland
Birmingham
New Center
3. Office statistics
Detroit | Q2 2016
Class Inventory (s.f.)
Total net
absorption (s.f.)
YTD total net
absorption (s.f.)
YTD total net
absorption (% of
stock)
Direct vacancy
(%)
Total vacancy
(%)
Average direct
asking rent ($
p.s.f.)
YTD completions
(s.f.)
Under
construction (s.f.)
CBD Totals 12,843,492 -90,382 -10,198 -0.1% 14.4% 14.5% $20.61 0 0
New Center Totals 1,117,100 4,348 4,348 0.4% 20.9% 21.2% $18.20 0 0
Urban Totals 13,960,592 -86,034 -5,850 0.0% 14.9% 15.0% $20.34 0 0
Birmingham/Bloomfield Totals 2,858,942 17,486 24,065 0.8% 7.6% 8.0% $23.43 0 34,354
Dearborn Totals 2,547,516 -5,533 -1,713 -0.1% 43.5% 43.5% $15.16 0 0
Downriver Totals 404,475 547 412 0.1% 41.9% 41.9% $12.65 0 0
Farmington/Farmington Hills Totals 4,178,825 -24,686 -32,807 -0.8% 25.9% 26.0% $18.13 0 0
Macomb Totals 945,140 -3,167 -18,337 -1.9% 11.4% 11.4% $17.21 0 0
Northern I-275 Corridor Totals 3,621,671 -402 -70,431 -1.9% 12.7% 13.2% $19.65 0 383,980
North Oakland Totals 2,375,789 -18,269 -38,522 -1.6% 18.3% 8.7% $17.78 0 0
Royal Oak/Southeast Oakland Totals 638,607 -7,400 -6,567 -1.0% 11.1% 11.1% $15.80 0 0
Southern I-275 Corridor Totals 1,129,017 0 161,168 14.3% 0.0% 0.0% $0.00 0 0
Southfield Totals 12,810,271 -9,902 153,819 1.2% 25.7% 25.9% $17.38 0 0
Troy Totals 10,470,696 -14,296 -17,667 -0.2% 24.4% 24.6% $18.12 0 0
Washtenaw Totals 5,529,408 -5,140 -349,280 -6.3% 9.4% 11.2% $23.85 0 0
Suburbs Totals 47,510,357 -70,762 -195,860 -0.4% 21.1% 21.0% $17.90 0 418,334
Detroit Totals 61,470,949 -156,796 -201,710 -0.3% 19.7% 19.6% $18.32 0 418,334
CBD A 6,194,714 -88,183 -43,001 -0.7% 14.2% 14.4% $22.20 0 0
Urban A 6,194,714 -88,183 -43,001 -0.7% 14.2% 14.4% $22.20 0 0
Birmingham/Bloomfield A 1,413,082 3,041 7,435 0.5% 6.6% 6.6% $27.68 0 34,354
Dearborn A 446,890 0 0 0.0% 11.3% 11.3% $25.00 0 0
Farmington/Farmington Hills A 618,109 0 -18,728 -3.0% 14.1% 14.1% $22.50 0 0
Macomb A 295,494 -3,167 -411 -0.1% 2.3% 2.3% $19.29 0 0
Northern I-275 Corridor A 1,059,039 -7,300 -4,959 -0.5% 4.2% 4.2% $22.80 0 383,980
North Oakland A 433,137 13 -18,577 -4.3% 47.5% 47.5% $20.02 0 0
Southern I-275 Corridor A 950,857 0 161,168 16.9% 0.0% 0.0% NA 0 0
Southfield A 2,789,819 -3,383 154,554 5.5% 16.4% 16.7% $22.89 0 0
Troy A 1,924,131 -1,670 70,189 3.6% 16.5% 17.3% $25.46 0 0
Washtenaw A 3,220,406 -2,071 -247,653 -7.7% 9.7% 12.8% $25.80 0 0
Suburbs A 13,150,964 -14,537 103,018 0.8% 12.0% 12.9% $23.92 0 418,334
Detroit A 19,345,678 -102,720 60,017 0.3% 12.7% 13.4% $23.31 0 418,334
CBD B 6,648,778 -2,199 32,803 0.5% 14.5% 14.6% $19.16 0 0
New Center B 1,117,100 4,348 4,348 0.4% 20.9% 21.2% $18.20 0 0
Urban B 7,765,878 2,149 37,151 0.5% 15.5% 15.5% $18.97 0 0
Birmingham/Bloomfield B 1,445,860 14,445 16,630 1.2% 8.7% 9.3% $20.26 0 0
Dearborn B 2,100,626 -5,533 -1,713 -0.1% 50.3% 50.3% $14.69 0 0
Downriver B 404,475 547 412 0.1% 41.9% 41.9% $12.65 0 0
Farmington/Farmington Hills B 3,560,716 -24,686 -14,079 -0.4% 28.0% 28.1% $17.75 0 0
Macomb B 649,646 0 -17,926 -2.8% 15.5% 15.5% $17.07 0 0
Northern I-275 Corridor B 2,562,632 6,898 -65,472 -2.6% 16.2% 16.9% $19.31 0 0
North Oakland B 1,942,652 -18,282 -19,945 -1.0% 11.8% 11.8% $15.77 0 0
Royal Oak/Southeast Oakland B 638,607 -7,400 -6,567 -1.0% 11.1% 11.1% $15.80 0 0
Southern I-275 Corridor B 178,160 0 0 0.0% 0.0% 0.0% $0.00 0 0
Southfield B 10,020,452 -6,519 -735 0.0% 28.3% 28.5% $16.49 0 0
Troy B 8,546,565 -12,626 -87,856 -1.0% 26.2% 26.3% $17.08 0 0
Washtenaw B 2,309,002 -3,069 -101,627 -4.4% 9.0% 9.0% $20.90 0 0
Suburbs B 34,359,393 -56,225 -298,878 -0.9% 24.6% 24.7% $16.78 0 0
Detroit B 42,125,271 -54,076 -261,727 -0.6% 22.9% 23.0% $17.05 0 0
©2016 Jones Lang LaSalle IP, Inc. All rights reserved.For more information, contact: Aaron Moore | aaron.moore@am.jll.com