Weekly Projects Update - w/e 24th March 2017
•
0 likes•614 views

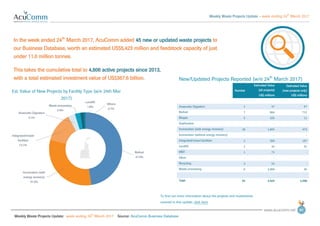
AcuComm's weekly projects update - w/e 24th March 2017. For more information on our latest projects, visit our website: acucomm.net

Recommended
Recommended
More Related Content
What's hot
What's hot (20)
Similar to Weekly Projects Update - w/e 24th March 2017
Similar to Weekly Projects Update - w/e 24th March 2017 (12)
More from AcuComm
Recently uploaded
Recently uploaded (20)
Weekly Projects Update - w/e 24th March 2017
- 1. Weekly Waste Projects Update – week ending 24 th March 2017 Weekly Waste Projects Update: week ending 24 th March 2017 Source: AcuComm Business Database 01 2nd September 2016 New/Updated Projects Reported (w/e 24th March 2017) Number Estimated Value (all projects) Estimated Value (new projects only) US$ millionsUS$ millions Anaerobic Digestion 1 47 47 Biofuel 7 864 712 Biogas 5 105 11 Gasification - - - Incineration (with energy recovery) 18 1,841 473 Incineration (without energy recovery) - - - Integrated/mixed facilities 2 394 197 Landfill 2 43 25 MBT 1 71 - Other - - - Recycling 3 55 - Waste processing 6 2,004 36 Total 45 5,423 1,500 In the week ended 24th March 2017, AcuComm added 45 new or updated waste projects to our Business Database, worth an estimated US$5,423 million and feedstock capacity of just under 11.0 million tonnes. This takes the cumulative total to 4,806 active projects since 2013, with a total estimated investment value of US$367.6 billion. To find out more information about the projects and investments covered in this update, click here Biofuel 47.5% Incineration (with energy recovery) 31.5% Integrated/mixed facilities 13.1% Anaerobic Digestion 3.1% Waste processing 2.4% Landfill 1.6% Others 0.7% Est. Value of New Projects by Facility Type (w/e 24th Mar 2017)
- 2. Weekly Waste Projects Update – week ending 24 th March 2017 Weekly Waste Projects Update: week ending 24 th March 2017 Source: AcuComm Business Database 02 New/Updated Projects Reported (w/e 24th March 2017) Number Capacity (tonnes) MW Anaerobic Digestion 1 352,561 3 Biofuel 7 3,013,779 238 Biogas 5 364,596 13 Gasification - - - Incineration (with energy recovery) 18 4,375,759 791 Incineration (without energy recovery) - - - Integrated/mixed facilities 2 168,000 29 Landfill 2 1,812,550 - MBT 1 201,340 14 Other - - - Recycling 3 257,045 - Waste processing 6 442,700 - Total 45 10,988,329 1,088 The total estimated feedstock capacity of projects reported on in the past week is just under 11.0 million tonnes. WtE incineration was the largest category, accounting for just under 4.4 million tonnes. The total estimated power generation from these projects was 1,088 MW. WtE incineration was the largest category, accounting for 791 MW. Incineration (with energy recovery) 39.8% Biofuel 27.4% Landfill 16.5% Others 16.3% Reported Capacity of Projects by Facility Type (w/e 24th Mar 2017) To find out more information about the projects and investments covered in this update, click here
- 3. Weekly Waste Projects Update – week ending 24 th March 2017 Weekly Waste Projects Update: week ending 24 th March 2017 Source: AcuComm Business Database 03 New Projects Reported by Waste Types (w/e 24th March 2017) Number Capacity (tonnes) MW Animal 1 129,040 3 Clinical - - - Construction/Demolition 1 227,045 - e-Waste - - - Food 1 29,200 2 Gas 1 - 20 Glass - - - Hazardous 4 374,467 30 Heat - - - Industrial 1 1,400,997 - Metals - - - MSW 14 3,564,152 299 Oil 2 120,000 16 Organic (general/unspecified) 3 206,356 9 Other - - - Paper - - - Plant biomass (non-waste) 3 1,836,649 81 Plant biomass (waste) 3 1,528,174 169 Plastics 1 24,000 - Radioactive 2 533 - Rubber - - - Sewage/wastewater 1 352,561 3 Wood 7 1,195,156 457 Total 45 10,988,329 1,088 MSW was the leading feedstock type reported on in the past week, accounting for an estimated 3.6 million tonnes, or 32.4% of the total. This was followed by non- waste biomass with 1.8 million tonnes or 16.7%. MSW 32.4% Plant biomass (non-waste) 16.7% Plant biomass (waste) 13.9% Others 36.9% Reported Capacity of Projects by Waste Type (w/e 24th Mar 2017) To find out more information about the projects and investments covered in this update, click here
- 4. Weekly Waste Projects Update – week ending 24 th March 2017 Weekly Waste Projects Update: week ending 24 th March 2017 Source: AcuComm Business Database 04 New/Updated Projects, Country Coverage, (w/e 24th March 2017) Projects USA 7 UK 6 China 5 Canada 4 Denmark 2 Fiji 2 Netherlands 2 Australia 2 Others 15 Total 45 The leading country in the past week was the USA with seven projects. This was followed by the UK with seven and China with five. 7 6 5 4 2 2 2 2 0 0 0 15 0 2 4 6 8 10 12 14 16 USA UK China Canada Denmark Fiji Netherlands Australia Others Reported Projects by Country (w/e 24th Mar 2017) To find out more information about the projects and investments covered in this update, click here
- 5. Weekly Waste Projects Update – week ending 24 th March 2017 Weekly Waste Projects Update: week ending 24 th March 2017 Source: AcuComm Business Database 05 Average Project Values by Facility Type US$ millions Anaerobic Digestion 25 Biofuel 118 Biogas 27 Gasification 145 Incineration (with energy recovery) 106 Incineration (without energy recovery) 50 Integrated/mixed facilities 191 Landfill 22 MBT 65 Other 81 Recycling 34 Waste processing 85 All Projects 76 Average Project Values by Feedstock Type US$ millions Animal 18 Clinical 29 Construction/Demolition 9 e-Waste 22 Food 20 Gas 75 Glass 14 Hazardous 65 Heat 37 Industrial 119 Metals 48 MSW 89 Oil 44 Organic (general/unspecified) 85 Other 64 Paper 74 Plant biomass (non-waste) 114 Plant biomass (waste) 79 Plastics 22 Radioactive 606 Rubber 38 Sewage/wastewater 42 Wood 88 All Projects 76 The average active waste project is worth US$76 million. There are naturally wide variations in average project value, due to the size, duration and complexity of different types of project. The figures on this page represent our latest estimates, based on data from 2013 to the current week. To find out more information about the projects and investments covered in this update, click here
- 6. Weekly Waste Projects Update – week ending 24 th March 2017 Weekly Waste Projects Update: week ending 24 th March 2017 Source: AcuComm Business Database 06 Top Five Projects, week ending 24th March 2017, by Estimated Value (US$ millions) Click the flag for more information on each project 1 Canada 1,134 Construction of waste management facilities for radioactive waste. 2 USA 657 Development of an interim storage facility for used nuclear fuel. 3 Denmark 302 Construction of a biomass cogeneration plant. 4 UK 240 Construction of a 20 MW WtE facility. 5 Fiji 200 Construction of a biomass pellet plant. Top Five Projects, week ending 24th March 2017, by Reported Waste Capacity (tonnes) 1 Kuwait 1,095,000 Construction of a >3,000 tpd MSW treatment complex. 2 China 365,000 Construction of a 1,000 tpd WtE facility. 3 China 328,500 Construction of a 900 tpd WtE facility. 4 Netherlands 200,000 Construction of third line at WtE facility. 5 UK 180,000 Construction of a 20 MW WtE facility. Top Five Projects, week ending 24th March 2017, by Reported Power Generation (MW) 1 Denmark 300 Construction of a biomass cogeneration plant. 2 Bosnia 49 Construction of a wood-fired heating plant. 3 Brazil 48 Expansion of a bagasse-fuelled cogeneration facility. 4 UK 40 Development of a WtE facility. 5 Philippines 25 Development of a landfill and 25 MW WtE facility.
- 7. Weekly Waste Projects Update – week ending 24 th March 2017 Weekly Waste Projects Update: week ending 24 th March 2017 Source: AcuComm Business Database 07