SlideShare a Scribd company logo
1 of 11
Download to read offline
23 April 2014 Irwin 1
The Climatological and Geographical Factors Influencing the Formation
of Severe Tropical Cyclone George (2007)
Alannah Irwin
School of Environment, Arts, and Society – Department of Earth and Environment, Florida
International University, Miami, FL
Abstract
Severe Tropical Cyclone George affected the northwestern region of Australia from March 2nd
to
March 16th
, 2007. The storm became one of the strongest landfalling storms in Port Hedland, Western
Australia. The storm caused 3 fatalities and $8 million (USD) in damage. Analysis of this storm is
important for two reasons: to better understand the climatology of this region to better predict storm
intensity and to enhance the warning system for tropical cyclone preparation. Some possibilities as to why
this storm intensified and held such a well-defined circulation after landfall are the location of the
Intertropical Convergence Zone (ITCZ) during the month of March in the Southern Hemisphere, the
presence of El Nino Southern Oscillation (ENSO), and the lack of rigorous terrain in the northwest region
of Australia that would rapidly inhibit tropical cyclone circulation upon landfall. The time series analysis
of microwave data is most effective in determining how circulation began and how the circulation
continued after landfall. Kaplan and Demaria’s research for wind decay over land and wind decay over
narrow landmasses are used in this analysis as models for expected intensity changes throughout the life
cycle of Severe TC George. It can be determined that the location of the ITCZ has a large influence of
tropical cyclone formation in the Australian Region. NOAA sea surface temperature (SST) data also
support a cool phase ENSO in the beginning of 2007. The terrain in the northwest region of Australia is
also very flat, which allowed the circulation to exist longer than over mountainous terrain.
23 April 2014 Irwin 2
Introduction
Severe Tropical Cyclone George affected parts of Australia for 14 days. This
storm can be deemed interesting for many reasons. Circulation began in a region in
Australia known as the “Top End,” located in the Northwest Territory along the Gulf of
Carpentaria to the east and the Bonaparte Gulf to the west. This tropical cyclone is being
investigated for a few reasons: the possibility of an ENSO cool phase formation, the
influence of the Intertropical Convergence Zone (ITCZ) seasonal shifts in this region, and
the effectiveness of the Kaplan and Demaria model for tropical cyclones over narrow
landmasses. The Bureau of Meteorology, Australia’s equivalent to the National Weather
Service and National Hurricane Center, (hereafter BOM, NWS, and NHC respectively)
took into account the Kaplan and Demaria model for wind decay over land (1995), but
did not factor in the decay of wind over narrow landmasses (2005) such as the Top End.
Severe Tropical Cyclone George appears to have intensified at the beginning of its life
cycle along the Top End.
Background
In order to properly discuss this study, tropical Australia must be analyzed. The
terminology used to define tropical cyclones, or TCs, in Australia differs greatly from
those used in the Atlantic and Eastern Pacific Ocean Basins. BOM defines a tropical
cyclones as a nonfrontal, synoptic-scale cyclone that has developed over tropical waters,
with a 10-minute average wind speed of at least 63 km h-1
near the center of the
organized wind circulation (Dare, et al. 2004). Similarly, the American Meteorological
Society, or AMS, defines a TC as a disturbance orienting over topical oceans as a warm-
core cyclonically rotating wind system in which maximum sustained winds are 17 m s-1
23 April 2014 Irwin 3
(40 mph, 35kt) or greater
(Glickman 2000, Gray
1968). The NHC monitors
TC formation ranging
from the International
Dateline to the 0°
longitude line.
The NHC and
other American agencies,
such as the Atlantic
Oceanographic and Meteorological Laboratory (AOML), use a 1-minute maximum
sustained surface wind threshold when defining TC wind speed. This differs from the
Australian system. AOML defines this 1-minute threshold as the averaging time for
reporting the sustained winds during a TC. These wind values issued in NHC advisories
are the highest 1-minute surface winds occurring within the circulation system. By
definition, the standard meteorological height of surface winds is ten meters in height,
having unobstructed exposure (i.e., no building or land obscuration). Similarly, the BOM
defines the 10-minute threshold as the ten-minute averaging time for reporting sustained
winds. These winds are the highest value of ten-minute surface winds occurring within
the circulation system. Again, the standard meteorological height of a surface wind is ten
meters. The conversion from 10-minute to 1-minute maximum sustained winds is ratio of
10-min to 1-min. This value is approximately 12% higher for 1-minute maximum
sustained surface winds. Both the AOML and the BOM find conversion from the 10-
Fig 1. A comparison of the Australian Region TC Intensity Scale
versus the Saffir-Simpson Hurricane Scale used by the BOM and
NHC/AOML, respectively.
23 April 2014 Irwin 4
minute to 1-minute maximum sustained winds problematic since there is no exact
conversion value for each.
Figure 1 shows a comparison of the Australian Region TC Intensity Scale and the
Saffir-Simpson Scale. It can be noted that the categorizing of the Saffir-Simpson Scale
has a much higher magnitude threshold than the Australian Region TC Intensity Scale
due to this difference in wind speed classification. Figure 2 shows this classification
difference between the
Australian and Atlantic
Basins. All 1-minute wind
speed thresholds have been
roughly converted to 10-
minute threshold values.
Australian TC classification
does not include tropical depression or tropical storm classifications like the Saffir-
Simpson Scale. The BOM therefore classifies all systems as tropical cyclones, regardless
of intensity.
Another discrepancy that must be defined is the Australian TC Region itself. This
TC region is extensive, which can be seen in
Figure 3. The Australian TC Region extends
from approximately 90°E to 160°E Longitude
and between 12°S and the Equator (Dare 2004).
This region is divided into four regions: the
Eastern region, ranging from 160°E to 145°E, the
Fig 2. Comparison of the 10-minute mean wind vs. 1-minute
mean winds.
Figure 3. The division of the Australian
TC region from the Australian Bureau
of Meteorology.
23 April 2014 Irwin 5
Figure 4. Standard atmospheric image of Pacific
Ocean during cool phase ENSO. A low pressure is
dominant over the NW region of Australia. The
blue line by the equator is the location of the ITCZ.
There is little difference in this location between
January and March. www.meted.ucar.edu
Northern Region/Australian region, ranging from about 145°E to 125°E, the
Northwestern sub-region, ranging from 125°E to 110°E, and the Western region, ranging
from 110°E to 90°E. It is not uncommon for systems in one region to travel into another
region. BOM offices in Brisbane, Perth, and Darwin monitor storms across regions,
meaning they will issue warnings for all areas in the various TC regions. For the purpose
of this study, the regions that will be most important are the Northern, Northwestern, and
Western Regions. This area ranges from about 145°E to 90°E longitude.
An important factor for this study is the annual variability of both the ITCZ and
ENSO. The ITCZ is the band of clouds located near the equator, according to the NWS.
The ITCZ occurs because of the convergence between the Northern and Southern
Hemisphere trade winds (NH and SH, respectively). Due to the tilt of the Earth, the ITCZ
will shift northward and southward depending on the time of year and location of Earth
from the sun. This happens due to an imbalance in solar heating along the ocean surfaces
near the equator. In austral winter, July, the ITCZ will be located in the NH. Conversely,
the ITCZ will be in the SH during austral summer, December. ENSO cycles are defined
by the AMS as interannual changes in
air pressure and sea surface temperature
along the Pacific Ocean Basin. ENSO
cycles have cold phases, called “La
Niña,” which are characterized as
standard conditions. Warm phases, called
“El Niño,” show a shift in atmospheric
circulation, called Walker Circulation,
23 April 2014 Irwin 6
and changes in sea surface temperature (SST) along the western coast of Peru, shutting
down deep ocean upwelling. The presence of a warm phase ENSO cycle is important to
TC formation along the Australian TC Region. The presence of a weak, transitional cool
phase ENSO cycle could have affected the intensification of Severe TC George along the
Top End.
Lastly, Kaplan and Demaria have devised an empirical model for the decay of TC
winds upon landfall (1995) and the decay of TC winds upon crossing narrow landmasses
(2005). This initial decay model is based upon the observation that the wind speed decay
rate after landfall is proportional to the wind speed (Kaplan and Demaria 1995). A TC
will lose half of its intensity every 12 hours under this model. This model is the most-
widely accepted for TC forecasting since 2008 and is standard model used upon the post-
analysis of Severe Tropical Cyclone George in 2007 by the BOM. This model, however,
does not apply to portions of land narrow
in diameter, such as an island or peninsula.
Previous studies show that TC winds have
a tendency to decay more slowly when
they move across narrow landmasses (Ho
et al. 1987, Emanuel et al. 2004, Demaria
et al. 2005). The differences in land surface
types are important in the decay of TC
winds. There is a smaller portion of storm
circulation over a narrow landmass, thus
allowing for wind decay to occur more
Figure 5. 85GHz Horizontal image of Severe
TC George on March 3rd
, 2007 exiting the Top
End before moving over the SE Indian Ocean.
The warmer colors are indicative of colder
cloud temperatures, meaning there are higher
clouds here. Image courtesy of the Naval
Research Laboratory (www.nrlmry.navy.mil)
23 April 2014 Irwin 7
slowly (Demaria et al. 2005). Most importantly, differences in terrain are important, but
the elevation itself is not as crucial (Demaria et al. 2005). For example, if the elevation of
the land is 3000 m, but is very flat, the particular elevation will not affect the decay of the
TC wind speed. This is important for the analysis of final landfall of Severe TC George.
Methods
The ability to interpret microwave satellite imagery is imperative for this analysis.
On top of Infrared (IR) imagery, 37GHz composite imagery and the 85 GHz Horizontal
channel were used to “see through” the clouds. The Naval Research Laboratory provided
all images. According to Dr. Haiyan Jiang at Florida International University (FIU), the
37GHz composite imagery shows brightness temperatures of clouds and rain, while ice
particles are scattered. The 85GHz imagery can detect ice particle scattering and low-
level emission of water vapor. These images give a better idea of cloud top temperatures
and possibly detect deep convection. However, the 37GHz composite does not work well
over land, therefore the 85GHz Horizontal imagery is the best solution for landfalling
storms. 300mb circulation maps are used to locate upper level highs and lows and search
for the necessary indicators of warm phase or cool phase ENSO cycles during March of
2007. 500mb relative humidity maps are important to explore the possibility of Severe
TC George sustaining itself over land, therefore not exactly following the Kaplan and
Demaria model (1995). Lastly, an analysis of wind speed along the Top End is important
to verify if the storm followed the Kaplan and Demaria model for wind decay over
narrow landmasses (2005).
Results and Discussion
23 April 2014 Irwin 8
There are many factors to analyze in this research project: ENSO cycles, the
geography of the Top End, and the Kaplan and Demaria model for wind decay over
narrow landmasses. According to the NOAA Climate Prediction Center, there was an
apparent shift in SST anomalies from warm phase to cool phase ENSO via SST
anomalies in early 2007. Shifting to an ENSO cool phase allows for TC formation along
the Southeast Indian Ocean Basin. This can be confirmed by 300mb level pressure
analysis, since during a cool phase ENSO cycle there will be an upper level high along
the northeast region of Australia. 300mb maps show the presence of upper level highs in
the NW and SW Australian regions, which indicate surface lows. As mentioned above,
Figure 6a-b. Sea surface temperature anomalies for the entire year of 2007. January began with a warm
anomaly, in red, and by March there was a transition into the cool phase. By the end of the year, the
ENSO cool phase had prevailed, in blue. Figure 6b (below) is the 300mb height pressure and wind.
The red circles indicate upper level highs, which support surface low-pressure systems. The upper
level low, is the location of Severe TC George on March 8th
, 2007. Courtesy of BOM.
23 April 2014 Irwin 9
the presence of a surface low is indicative of a cool phase ENSO. The Top End of
Australia is a peninsula, which greatly influences the intensity of TCs in this region. In
the case of Severe TC George, it did not limit circulation, allowing for the storm to
intensify into the severe storm that it became. Also, despite following the Kaplan and
Demaria Model of Wind Decay (1995), Severe TC George was able to maintain
circulation, shown in the 85GHz Composite imagery in Figure 7.
In 2007, there was a progression from warm anomalies to cool anomalies in SST,
indicating an ENSO cool phase. This means that Walker Circulation was returning back
to normal, allowing surface low pressure to return to the regions surrounding Australia.
This is important for TC formation in this area. 85GHz Horizontal and Composite
imagery were used to detect rainfall over land. The 37GHz would have increased any
Figure 7. 85GHZ Composite imagery of the landfall of Severe TC George on 3/8/2007. Circulation is
still defined 24 hours after landfall, indicating the minimal influence of terrain on the storm. Image
courtesy of the Naval Research Laboratory (www.nrlmry.navy.mil)
23 April 2014 Irwin 10
error, since it does not detect well over land. 300 mb maps were used to verify the
presence of cool ENSO, since there will be surface low pressure along the equator and
along the western coast of Australia during this time. In this time frame, there should
have been three surface lows: the two formerly mentioned and Severe TC George. To
prevent confusion, the 300mb was used because at the tropopause, the surface lows will
actually be upper level high-pressure systems, while the TC will still be a low-pressure
system. This was able to effectively distinguish these features. The Top End played little
role in prevention of the initial intensification of the storm. The storm was moving so
quickly that the peninsula did not inhibit formation of the TC. An explanation for the
circulation maintenance upon the final landfall is the lack of difference in the terrain in
the NW portion of Australia. This terrain, while at an elevation of 3000m, is a plateau,
meaning it is relatively flat throughout. Most importantly, differences in terrain are
important, but the elevation itself is not as crucial (Demaria et al. 2005). So this storm,
while following the Kaplan and Demaria model of wind decay upon landfall, was able to
circulate efficiently for over 24 hours because there was a decreased amount of friction
present. Also, there was an increased RH in the 500 mb level for this region, which
allowed for moisture content to remain present while the storm moved inland. Eventually,
though, friction from the terrain caused the storm to weaken, causing it to be carried
away by a cold front.
Conclusion
Severe TC George was an unusual storm from 2007 for many reasons. The storm
formed during a time where there was a transition from warm phase to cool phase ENSO.
This allowed for the storm to not only intensify, but also take this storm track. 300mb
23 April 2014 Irwin 11
maps support the formation of a cool ENSO cycle due to the upper level highs associated
with surface low pressure. Terrain had a minimal effect on the circulation of the storm
since it was able to maintain circulation for 24 hours after landfall. Wind decay of the
storm was concise with the Kaplan and Demaria model. The Top End had no effect on
the intensity of this storm since it was able to strengthen instead of weaken as it crossed
the peninsula. Terrain elevation has no effect on circulation as well; weakening of a
storm depends on the height differences of the land.
References
Kaplan, J., and Demaria, M., (1995), A Simple Empirical Model for Predicting
the Decay of Tropical Cyclone Winds after Landfall, J of. App. Met., 34, 2499- 2511
Demaria, M., Knaff, J.A., and Kaplan, J., (1995), On the Decay of Tropical
Cyclone Winds Crossing Narrow Landmasses J of. App. Met. and Cli., 45, 491-498
Goebbert, K. H., and Leslie, L.M., (2010), Interannual Variability of Northwest
Austalia Tropical Cyclones J of. App. Cli., 23, 491-498
Dare, R. A., and Davidson, N.N., (2004), Characteristics of Tropical Cyclones in
the Australian Region. Mon. Wea. Rev. 132, 3049-306

More Related Content

What's hot

Atmospheric Pressure and Winds
Atmospheric Pressure and WindsAtmospheric Pressure and Winds
Atmospheric Pressure and WindsAkepati S. Reddy
 
Cyclones - Understanding Storm Systems
Cyclones - Understanding Storm SystemsCyclones - Understanding Storm Systems
Cyclones - Understanding Storm SystemsJohn Johnston
 
Atmosphere, weather and climate
Atmosphere, weather and climateAtmosphere, weather and climate
Atmosphere, weather and climatekrferraro
 
Chapter 17 – meteorology
Chapter 17 – meteorologyChapter 17 – meteorology
Chapter 17 – meteorologyAnnie cox
 
Chapter 16 & 17-weather and climate
Chapter 16 & 17-weather and climateChapter 16 & 17-weather and climate
Chapter 16 & 17-weather and climateSteven_iannuccilli
 
GEOG100--Lecture 06--Atmospheric and ocean circulation
GEOG100--Lecture 06--Atmospheric and ocean circulationGEOG100--Lecture 06--Atmospheric and ocean circulation
GEOG100--Lecture 06--Atmospheric and ocean circulationangelaorr
 
Lab eight midlatitude cyclones
Lab eight midlatitude cyclonesLab eight midlatitude cyclones
Lab eight midlatitude cyclonesLisa Schmidt
 
Circulation of the Atmosphere
Circulation of the AtmosphereCirculation of the Atmosphere
Circulation of the AtmosphereZBTHS
 
GEOG 100 Lecture 08--Airmasses and Storms
GEOG 100 Lecture 08--Airmasses and StormsGEOG 100 Lecture 08--Airmasses and Storms
GEOG 100 Lecture 08--Airmasses and Stormsangelaorr
 
Physical Geography Lecture 04.5 - Earth's Atmosphere 101016
Physical Geography Lecture 04.5 - Earth's Atmosphere 101016Physical Geography Lecture 04.5 - Earth's Atmosphere 101016
Physical Geography Lecture 04.5 - Earth's Atmosphere 101016angelaorr
 
Atmosphere and weather
Atmosphere and weatherAtmosphere and weather
Atmosphere and weatherMailyn Morales
 
PRESSURE AND WINDS 11 CLASS GEOGRAPHY
PRESSURE AND WINDS 11 CLASS GEOGRAPHYPRESSURE AND WINDS 11 CLASS GEOGRAPHY
PRESSURE AND WINDS 11 CLASS GEOGRAPHYSaloni777
 
Aviation Weather Theory Made Easy
Aviation Weather Theory Made EasyAviation Weather Theory Made Easy
Aviation Weather Theory Made EasyTodd Shellnutt
 
Notes - Air Masses, Fronts, Global Winds
Notes - Air Masses, Fronts, Global WindsNotes - Air Masses, Fronts, Global Winds
Notes - Air Masses, Fronts, Global WindsBantay's Oceanography
 
Weather elements and factors
Weather elements and factorsWeather elements and factors
Weather elements and factorsShabana Yasmin
 
Physical Geography Lecture 05 - Atmospheric Energy and Global Temps 101216
Physical Geography Lecture 05 - Atmospheric Energy and Global Temps 101216Physical Geography Lecture 05 - Atmospheric Energy and Global Temps 101216
Physical Geography Lecture 05 - Atmospheric Energy and Global Temps 101216angelaorr
 

What's hot (20)

Atmospheric Pressure and Winds
Atmospheric Pressure and WindsAtmospheric Pressure and Winds
Atmospheric Pressure and Winds
 
Cyclones - Understanding Storm Systems
Cyclones - Understanding Storm SystemsCyclones - Understanding Storm Systems
Cyclones - Understanding Storm Systems
 
Atmosphere, weather and climate
Atmosphere, weather and climateAtmosphere, weather and climate
Atmosphere, weather and climate
 
Chapter 17 – meteorology
Chapter 17 – meteorologyChapter 17 – meteorology
Chapter 17 – meteorology
 
Chapter 16 & 17-weather and climate
Chapter 16 & 17-weather and climateChapter 16 & 17-weather and climate
Chapter 16 & 17-weather and climate
 
GEOG100--Lecture 06--Atmospheric and ocean circulation
GEOG100--Lecture 06--Atmospheric and ocean circulationGEOG100--Lecture 06--Atmospheric and ocean circulation
GEOG100--Lecture 06--Atmospheric and ocean circulation
 
Lab eight midlatitude cyclones
Lab eight midlatitude cyclonesLab eight midlatitude cyclones
Lab eight midlatitude cyclones
 
HURRICANES
HURRICANESHURRICANES
HURRICANES
 
Circulation of the Atmosphere
Circulation of the AtmosphereCirculation of the Atmosphere
Circulation of the Atmosphere
 
GEOG 100 Lecture 08--Airmasses and Storms
GEOG 100 Lecture 08--Airmasses and StormsGEOG 100 Lecture 08--Airmasses and Storms
GEOG 100 Lecture 08--Airmasses and Storms
 
Physical Geography Lecture 04.5 - Earth's Atmosphere 101016
Physical Geography Lecture 04.5 - Earth's Atmosphere 101016Physical Geography Lecture 04.5 - Earth's Atmosphere 101016
Physical Geography Lecture 04.5 - Earth's Atmosphere 101016
 
Atmosphere and weather
Atmosphere and weatherAtmosphere and weather
Atmosphere and weather
 
PRESSURE AND WINDS 11 CLASS GEOGRAPHY
PRESSURE AND WINDS 11 CLASS GEOGRAPHYPRESSURE AND WINDS 11 CLASS GEOGRAPHY
PRESSURE AND WINDS 11 CLASS GEOGRAPHY
 
Aviation Weather Theory Made Easy
Aviation Weather Theory Made EasyAviation Weather Theory Made Easy
Aviation Weather Theory Made Easy
 
Notes - Air Masses, Fronts, Global Winds
Notes - Air Masses, Fronts, Global WindsNotes - Air Masses, Fronts, Global Winds
Notes - Air Masses, Fronts, Global Winds
 
Atmosphere ppt
Atmosphere pptAtmosphere ppt
Atmosphere ppt
 
5
55
5
 
Weather elements and factors
Weather elements and factorsWeather elements and factors
Weather elements and factors
 
Physical Geography Lecture 05 - Atmospheric Energy and Global Temps 101216
Physical Geography Lecture 05 - Atmospheric Energy and Global Temps 101216Physical Geography Lecture 05 - Atmospheric Energy and Global Temps 101216
Physical Geography Lecture 05 - Atmospheric Energy and Global Temps 101216
 
Chapter five
Chapter fiveChapter five
Chapter five
 

Similar to Climatological factors influencing Severe Tropical Cyclone George (2007

Key concepts in Climate Science
Key concepts in Climate  ScienceKey concepts in Climate  Science
Key concepts in Climate Sciencecdenef
 
Earthquake and extreme weather
Earthquake and extreme weatherEarthquake and extreme weather
Earthquake and extreme weatherpetergnz
 
Hurricanes
HurricanesHurricanes
HurricanesRaza Ch
 
Enso Evolution Status of El niño and La niña
Enso Evolution Status of El niño and La niñaEnso Evolution Status of El niño and La niña
Enso Evolution Status of El niño and La niñagabrieltalimongan780
 
Weather and Climate
Weather and ClimateWeather and Climate
Weather and Climatetcooper66
 
enso_evolution-status-fcsts-web.ppt
enso_evolution-status-fcsts-web.pptenso_evolution-status-fcsts-web.ppt
enso_evolution-status-fcsts-web.pptRohitBalooni2
 
Hurricane Threat and Risk Analysis in Rhode Island
Hurricane Threat and Risk Analysis in Rhode IslandHurricane Threat and Risk Analysis in Rhode Island
Hurricane Threat and Risk Analysis in Rhode Islandriseagrant
 
Informe NASA / ENSO
Informe NASA / ENSOInforme NASA / ENSO
Informe NASA / ENSOviento2001
 
Understanding Cyclones. Cyclone Freddy being of interest
Understanding Cyclones. Cyclone Freddy being of interestUnderstanding Cyclones. Cyclone Freddy being of interest
Understanding Cyclones. Cyclone Freddy being of interestPeter Maphalla
 
Climate: Hurricane Basic Detail
Climate: Hurricane Basic DetailClimate: Hurricane Basic Detail
Climate: Hurricane Basic Detailgeomillie
 
diurnal temperature range trend over North Carolina and the associated mechan...
diurnal temperature range trend over North Carolina and the associated mechan...diurnal temperature range trend over North Carolina and the associated mechan...
diurnal temperature range trend over North Carolina and the associated mechan...Sayem Zaman, Ph.D, PE.
 
(3) References for el nino cause and effects essayBelow are 3 fu.docx
(3) References for el nino cause and effects essayBelow are 3 fu.docx(3) References for el nino cause and effects essayBelow are 3 fu.docx
(3) References for el nino cause and effects essayBelow are 3 fu.docxkatherncarlyle
 
Satellite Observations Of Rainfall And Water Vapor
Satellite Observations Of Rainfall And Water VaporSatellite Observations Of Rainfall And Water Vapor
Satellite Observations Of Rainfall And Water Vaporkehowell
 
Lecture 8 el nino, la nina, and their connection with hong kong climate
Lecture 8   el nino, la nina, and their connection with hong kong climateLecture 8   el nino, la nina, and their connection with hong kong climate
Lecture 8 el nino, la nina, and their connection with hong kong climatepolylsgiedx
 
LeeSideTroughsGouldUpdate
LeeSideTroughsGouldUpdateLeeSideTroughsGouldUpdate
LeeSideTroughsGouldUpdatesamuelgould
 

Similar to Climatological factors influencing Severe Tropical Cyclone George (2007 (20)

SeaSurfaceHeight
SeaSurfaceHeightSeaSurfaceHeight
SeaSurfaceHeight
 
Key concepts in Climate Science
Key concepts in Climate  ScienceKey concepts in Climate  Science
Key concepts in Climate Science
 
Earthquake and extreme weather
Earthquake and extreme weatherEarthquake and extreme weather
Earthquake and extreme weather
 
Hurricanes
HurricanesHurricanes
Hurricanes
 
Enso Evolution Status of El niño and La niña
Enso Evolution Status of El niño and La niñaEnso Evolution Status of El niño and La niña
Enso Evolution Status of El niño and La niña
 
Weather and Climate
Weather and ClimateWeather and Climate
Weather and Climate
 
enso_evolution-status-fcsts-web.ppt
enso_evolution-status-fcsts-web.pptenso_evolution-status-fcsts-web.ppt
enso_evolution-status-fcsts-web.ppt
 
Hurricane Threat and Risk Analysis in Rhode Island
Hurricane Threat and Risk Analysis in Rhode IslandHurricane Threat and Risk Analysis in Rhode Island
Hurricane Threat and Risk Analysis in Rhode Island
 
Informe NASA / ENSO
Informe NASA / ENSOInforme NASA / ENSO
Informe NASA / ENSO
 
Understanding Cyclones. Cyclone Freddy being of interest
Understanding Cyclones. Cyclone Freddy being of interestUnderstanding Cyclones. Cyclone Freddy being of interest
Understanding Cyclones. Cyclone Freddy being of interest
 
Climate: Hurricane Basic Detail
Climate: Hurricane Basic DetailClimate: Hurricane Basic Detail
Climate: Hurricane Basic Detail
 
diurnal temperature range trend over North Carolina and the associated mechan...
diurnal temperature range trend over North Carolina and the associated mechan...diurnal temperature range trend over North Carolina and the associated mechan...
diurnal temperature range trend over North Carolina and the associated mechan...
 
(3) References for el nino cause and effects essayBelow are 3 fu.docx
(3) References for el nino cause and effects essayBelow are 3 fu.docx(3) References for el nino cause and effects essayBelow are 3 fu.docx
(3) References for el nino cause and effects essayBelow are 3 fu.docx
 
Enso
EnsoEnso
Enso
 
Capter 5 Climate of Ethiopia and the Horn GeES 1011.pdf
Capter 5 Climate of Ethiopia and the Horn GeES 1011.pdfCapter 5 Climate of Ethiopia and the Horn GeES 1011.pdf
Capter 5 Climate of Ethiopia and the Horn GeES 1011.pdf
 
Satellite Observations Of Rainfall And Water Vapor
Satellite Observations Of Rainfall And Water VaporSatellite Observations Of Rainfall And Water Vapor
Satellite Observations Of Rainfall And Water Vapor
 
Chapter seven
Chapter sevenChapter seven
Chapter seven
 
Lecture 8 el nino, la nina, and their connection with hong kong climate
Lecture 8   el nino, la nina, and their connection with hong kong climateLecture 8   el nino, la nina, and their connection with hong kong climate
Lecture 8 el nino, la nina, and their connection with hong kong climate
 
Tropical Storms 2
Tropical Storms 2Tropical Storms 2
Tropical Storms 2
 
LeeSideTroughsGouldUpdate
LeeSideTroughsGouldUpdateLeeSideTroughsGouldUpdate
LeeSideTroughsGouldUpdate
 

Climatological factors influencing Severe Tropical Cyclone George (2007

  • 1. 23 April 2014 Irwin 1 The Climatological and Geographical Factors Influencing the Formation of Severe Tropical Cyclone George (2007) Alannah Irwin School of Environment, Arts, and Society – Department of Earth and Environment, Florida International University, Miami, FL Abstract Severe Tropical Cyclone George affected the northwestern region of Australia from March 2nd to March 16th , 2007. The storm became one of the strongest landfalling storms in Port Hedland, Western Australia. The storm caused 3 fatalities and $8 million (USD) in damage. Analysis of this storm is important for two reasons: to better understand the climatology of this region to better predict storm intensity and to enhance the warning system for tropical cyclone preparation. Some possibilities as to why this storm intensified and held such a well-defined circulation after landfall are the location of the Intertropical Convergence Zone (ITCZ) during the month of March in the Southern Hemisphere, the presence of El Nino Southern Oscillation (ENSO), and the lack of rigorous terrain in the northwest region of Australia that would rapidly inhibit tropical cyclone circulation upon landfall. The time series analysis of microwave data is most effective in determining how circulation began and how the circulation continued after landfall. Kaplan and Demaria’s research for wind decay over land and wind decay over narrow landmasses are used in this analysis as models for expected intensity changes throughout the life cycle of Severe TC George. It can be determined that the location of the ITCZ has a large influence of tropical cyclone formation in the Australian Region. NOAA sea surface temperature (SST) data also support a cool phase ENSO in the beginning of 2007. The terrain in the northwest region of Australia is also very flat, which allowed the circulation to exist longer than over mountainous terrain.
  • 2. 23 April 2014 Irwin 2 Introduction Severe Tropical Cyclone George affected parts of Australia for 14 days. This storm can be deemed interesting for many reasons. Circulation began in a region in Australia known as the “Top End,” located in the Northwest Territory along the Gulf of Carpentaria to the east and the Bonaparte Gulf to the west. This tropical cyclone is being investigated for a few reasons: the possibility of an ENSO cool phase formation, the influence of the Intertropical Convergence Zone (ITCZ) seasonal shifts in this region, and the effectiveness of the Kaplan and Demaria model for tropical cyclones over narrow landmasses. The Bureau of Meteorology, Australia’s equivalent to the National Weather Service and National Hurricane Center, (hereafter BOM, NWS, and NHC respectively) took into account the Kaplan and Demaria model for wind decay over land (1995), but did not factor in the decay of wind over narrow landmasses (2005) such as the Top End. Severe Tropical Cyclone George appears to have intensified at the beginning of its life cycle along the Top End. Background In order to properly discuss this study, tropical Australia must be analyzed. The terminology used to define tropical cyclones, or TCs, in Australia differs greatly from those used in the Atlantic and Eastern Pacific Ocean Basins. BOM defines a tropical cyclones as a nonfrontal, synoptic-scale cyclone that has developed over tropical waters, with a 10-minute average wind speed of at least 63 km h-1 near the center of the organized wind circulation (Dare, et al. 2004). Similarly, the American Meteorological Society, or AMS, defines a TC as a disturbance orienting over topical oceans as a warm- core cyclonically rotating wind system in which maximum sustained winds are 17 m s-1
  • 3. 23 April 2014 Irwin 3 (40 mph, 35kt) or greater (Glickman 2000, Gray 1968). The NHC monitors TC formation ranging from the International Dateline to the 0° longitude line. The NHC and other American agencies, such as the Atlantic Oceanographic and Meteorological Laboratory (AOML), use a 1-minute maximum sustained surface wind threshold when defining TC wind speed. This differs from the Australian system. AOML defines this 1-minute threshold as the averaging time for reporting the sustained winds during a TC. These wind values issued in NHC advisories are the highest 1-minute surface winds occurring within the circulation system. By definition, the standard meteorological height of surface winds is ten meters in height, having unobstructed exposure (i.e., no building or land obscuration). Similarly, the BOM defines the 10-minute threshold as the ten-minute averaging time for reporting sustained winds. These winds are the highest value of ten-minute surface winds occurring within the circulation system. Again, the standard meteorological height of a surface wind is ten meters. The conversion from 10-minute to 1-minute maximum sustained winds is ratio of 10-min to 1-min. This value is approximately 12% higher for 1-minute maximum sustained surface winds. Both the AOML and the BOM find conversion from the 10- Fig 1. A comparison of the Australian Region TC Intensity Scale versus the Saffir-Simpson Hurricane Scale used by the BOM and NHC/AOML, respectively.
  • 4. 23 April 2014 Irwin 4 minute to 1-minute maximum sustained winds problematic since there is no exact conversion value for each. Figure 1 shows a comparison of the Australian Region TC Intensity Scale and the Saffir-Simpson Scale. It can be noted that the categorizing of the Saffir-Simpson Scale has a much higher magnitude threshold than the Australian Region TC Intensity Scale due to this difference in wind speed classification. Figure 2 shows this classification difference between the Australian and Atlantic Basins. All 1-minute wind speed thresholds have been roughly converted to 10- minute threshold values. Australian TC classification does not include tropical depression or tropical storm classifications like the Saffir- Simpson Scale. The BOM therefore classifies all systems as tropical cyclones, regardless of intensity. Another discrepancy that must be defined is the Australian TC Region itself. This TC region is extensive, which can be seen in Figure 3. The Australian TC Region extends from approximately 90°E to 160°E Longitude and between 12°S and the Equator (Dare 2004). This region is divided into four regions: the Eastern region, ranging from 160°E to 145°E, the Fig 2. Comparison of the 10-minute mean wind vs. 1-minute mean winds. Figure 3. The division of the Australian TC region from the Australian Bureau of Meteorology.
  • 5. 23 April 2014 Irwin 5 Figure 4. Standard atmospheric image of Pacific Ocean during cool phase ENSO. A low pressure is dominant over the NW region of Australia. The blue line by the equator is the location of the ITCZ. There is little difference in this location between January and March. www.meted.ucar.edu Northern Region/Australian region, ranging from about 145°E to 125°E, the Northwestern sub-region, ranging from 125°E to 110°E, and the Western region, ranging from 110°E to 90°E. It is not uncommon for systems in one region to travel into another region. BOM offices in Brisbane, Perth, and Darwin monitor storms across regions, meaning they will issue warnings for all areas in the various TC regions. For the purpose of this study, the regions that will be most important are the Northern, Northwestern, and Western Regions. This area ranges from about 145°E to 90°E longitude. An important factor for this study is the annual variability of both the ITCZ and ENSO. The ITCZ is the band of clouds located near the equator, according to the NWS. The ITCZ occurs because of the convergence between the Northern and Southern Hemisphere trade winds (NH and SH, respectively). Due to the tilt of the Earth, the ITCZ will shift northward and southward depending on the time of year and location of Earth from the sun. This happens due to an imbalance in solar heating along the ocean surfaces near the equator. In austral winter, July, the ITCZ will be located in the NH. Conversely, the ITCZ will be in the SH during austral summer, December. ENSO cycles are defined by the AMS as interannual changes in air pressure and sea surface temperature along the Pacific Ocean Basin. ENSO cycles have cold phases, called “La Niña,” which are characterized as standard conditions. Warm phases, called “El Niño,” show a shift in atmospheric circulation, called Walker Circulation,
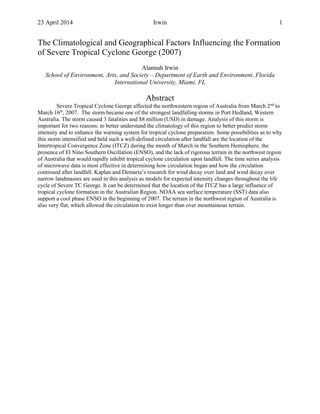
  • 6. 23 April 2014 Irwin 6 and changes in sea surface temperature (SST) along the western coast of Peru, shutting down deep ocean upwelling. The presence of a warm phase ENSO cycle is important to TC formation along the Australian TC Region. The presence of a weak, transitional cool phase ENSO cycle could have affected the intensification of Severe TC George along the Top End. Lastly, Kaplan and Demaria have devised an empirical model for the decay of TC winds upon landfall (1995) and the decay of TC winds upon crossing narrow landmasses (2005). This initial decay model is based upon the observation that the wind speed decay rate after landfall is proportional to the wind speed (Kaplan and Demaria 1995). A TC will lose half of its intensity every 12 hours under this model. This model is the most- widely accepted for TC forecasting since 2008 and is standard model used upon the post- analysis of Severe Tropical Cyclone George in 2007 by the BOM. This model, however, does not apply to portions of land narrow in diameter, such as an island or peninsula. Previous studies show that TC winds have a tendency to decay more slowly when they move across narrow landmasses (Ho et al. 1987, Emanuel et al. 2004, Demaria et al. 2005). The differences in land surface types are important in the decay of TC winds. There is a smaller portion of storm circulation over a narrow landmass, thus allowing for wind decay to occur more Figure 5. 85GHz Horizontal image of Severe TC George on March 3rd , 2007 exiting the Top End before moving over the SE Indian Ocean. The warmer colors are indicative of colder cloud temperatures, meaning there are higher clouds here. Image courtesy of the Naval Research Laboratory (www.nrlmry.navy.mil)
  • 7. 23 April 2014 Irwin 7 slowly (Demaria et al. 2005). Most importantly, differences in terrain are important, but the elevation itself is not as crucial (Demaria et al. 2005). For example, if the elevation of the land is 3000 m, but is very flat, the particular elevation will not affect the decay of the TC wind speed. This is important for the analysis of final landfall of Severe TC George. Methods The ability to interpret microwave satellite imagery is imperative for this analysis. On top of Infrared (IR) imagery, 37GHz composite imagery and the 85 GHz Horizontal channel were used to “see through” the clouds. The Naval Research Laboratory provided all images. According to Dr. Haiyan Jiang at Florida International University (FIU), the 37GHz composite imagery shows brightness temperatures of clouds and rain, while ice particles are scattered. The 85GHz imagery can detect ice particle scattering and low- level emission of water vapor. These images give a better idea of cloud top temperatures and possibly detect deep convection. However, the 37GHz composite does not work well over land, therefore the 85GHz Horizontal imagery is the best solution for landfalling storms. 300mb circulation maps are used to locate upper level highs and lows and search for the necessary indicators of warm phase or cool phase ENSO cycles during March of 2007. 500mb relative humidity maps are important to explore the possibility of Severe TC George sustaining itself over land, therefore not exactly following the Kaplan and Demaria model (1995). Lastly, an analysis of wind speed along the Top End is important to verify if the storm followed the Kaplan and Demaria model for wind decay over narrow landmasses (2005). Results and Discussion
  • 8. 23 April 2014 Irwin 8 There are many factors to analyze in this research project: ENSO cycles, the geography of the Top End, and the Kaplan and Demaria model for wind decay over narrow landmasses. According to the NOAA Climate Prediction Center, there was an apparent shift in SST anomalies from warm phase to cool phase ENSO via SST anomalies in early 2007. Shifting to an ENSO cool phase allows for TC formation along the Southeast Indian Ocean Basin. This can be confirmed by 300mb level pressure analysis, since during a cool phase ENSO cycle there will be an upper level high along the northeast region of Australia. 300mb maps show the presence of upper level highs in the NW and SW Australian regions, which indicate surface lows. As mentioned above, Figure 6a-b. Sea surface temperature anomalies for the entire year of 2007. January began with a warm anomaly, in red, and by March there was a transition into the cool phase. By the end of the year, the ENSO cool phase had prevailed, in blue. Figure 6b (below) is the 300mb height pressure and wind. The red circles indicate upper level highs, which support surface low-pressure systems. The upper level low, is the location of Severe TC George on March 8th , 2007. Courtesy of BOM.
  • 9. 23 April 2014 Irwin 9 the presence of a surface low is indicative of a cool phase ENSO. The Top End of Australia is a peninsula, which greatly influences the intensity of TCs in this region. In the case of Severe TC George, it did not limit circulation, allowing for the storm to intensify into the severe storm that it became. Also, despite following the Kaplan and Demaria Model of Wind Decay (1995), Severe TC George was able to maintain circulation, shown in the 85GHz Composite imagery in Figure 7. In 2007, there was a progression from warm anomalies to cool anomalies in SST, indicating an ENSO cool phase. This means that Walker Circulation was returning back to normal, allowing surface low pressure to return to the regions surrounding Australia. This is important for TC formation in this area. 85GHz Horizontal and Composite imagery were used to detect rainfall over land. The 37GHz would have increased any Figure 7. 85GHZ Composite imagery of the landfall of Severe TC George on 3/8/2007. Circulation is still defined 24 hours after landfall, indicating the minimal influence of terrain on the storm. Image courtesy of the Naval Research Laboratory (www.nrlmry.navy.mil)
  • 10. 23 April 2014 Irwin 10 error, since it does not detect well over land. 300 mb maps were used to verify the presence of cool ENSO, since there will be surface low pressure along the equator and along the western coast of Australia during this time. In this time frame, there should have been three surface lows: the two formerly mentioned and Severe TC George. To prevent confusion, the 300mb was used because at the tropopause, the surface lows will actually be upper level high-pressure systems, while the TC will still be a low-pressure system. This was able to effectively distinguish these features. The Top End played little role in prevention of the initial intensification of the storm. The storm was moving so quickly that the peninsula did not inhibit formation of the TC. An explanation for the circulation maintenance upon the final landfall is the lack of difference in the terrain in the NW portion of Australia. This terrain, while at an elevation of 3000m, is a plateau, meaning it is relatively flat throughout. Most importantly, differences in terrain are important, but the elevation itself is not as crucial (Demaria et al. 2005). So this storm, while following the Kaplan and Demaria model of wind decay upon landfall, was able to circulate efficiently for over 24 hours because there was a decreased amount of friction present. Also, there was an increased RH in the 500 mb level for this region, which allowed for moisture content to remain present while the storm moved inland. Eventually, though, friction from the terrain caused the storm to weaken, causing it to be carried away by a cold front. Conclusion Severe TC George was an unusual storm from 2007 for many reasons. The storm formed during a time where there was a transition from warm phase to cool phase ENSO. This allowed for the storm to not only intensify, but also take this storm track. 300mb
  • 11. 23 April 2014 Irwin 11 maps support the formation of a cool ENSO cycle due to the upper level highs associated with surface low pressure. Terrain had a minimal effect on the circulation of the storm since it was able to maintain circulation for 24 hours after landfall. Wind decay of the storm was concise with the Kaplan and Demaria model. The Top End had no effect on the intensity of this storm since it was able to strengthen instead of weaken as it crossed the peninsula. Terrain elevation has no effect on circulation as well; weakening of a storm depends on the height differences of the land. References Kaplan, J., and Demaria, M., (1995), A Simple Empirical Model for Predicting the Decay of Tropical Cyclone Winds after Landfall, J of. App. Met., 34, 2499- 2511 Demaria, M., Knaff, J.A., and Kaplan, J., (1995), On the Decay of Tropical Cyclone Winds Crossing Narrow Landmasses J of. App. Met. and Cli., 45, 491-498 Goebbert, K. H., and Leslie, L.M., (2010), Interannual Variability of Northwest Austalia Tropical Cyclones J of. App. Cli., 23, 491-498 Dare, R. A., and Davidson, N.N., (2004), Characteristics of Tropical Cyclones in the Australian Region. Mon. Wea. Rev. 132, 3049-306